. 2020 Sep 15;202(6):866-877.
doi: 10.1164/rccm.201912-2489OC.

Rifapentine Population Pharmacokinetics and Dosing Recommendations for Latent Tuberculosis Infection

Affiliations

Rifapentine Population Pharmacokinetics and Dosing Recommendations for Latent Tuberculosis Infection

Jennifer E Hibma et al. Am J Respir Crit Care Med. .

Abstract

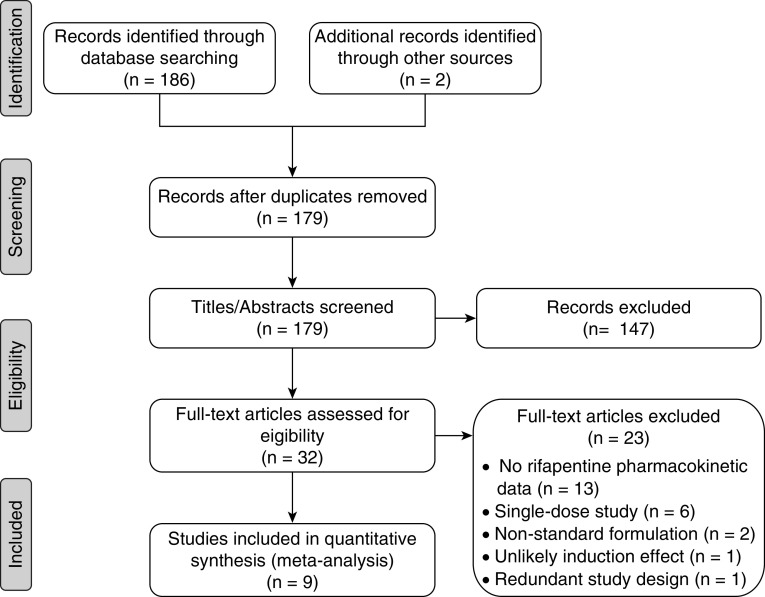
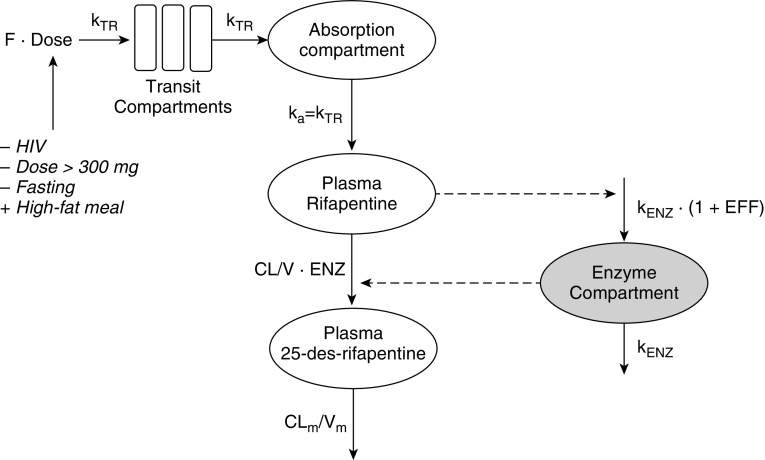
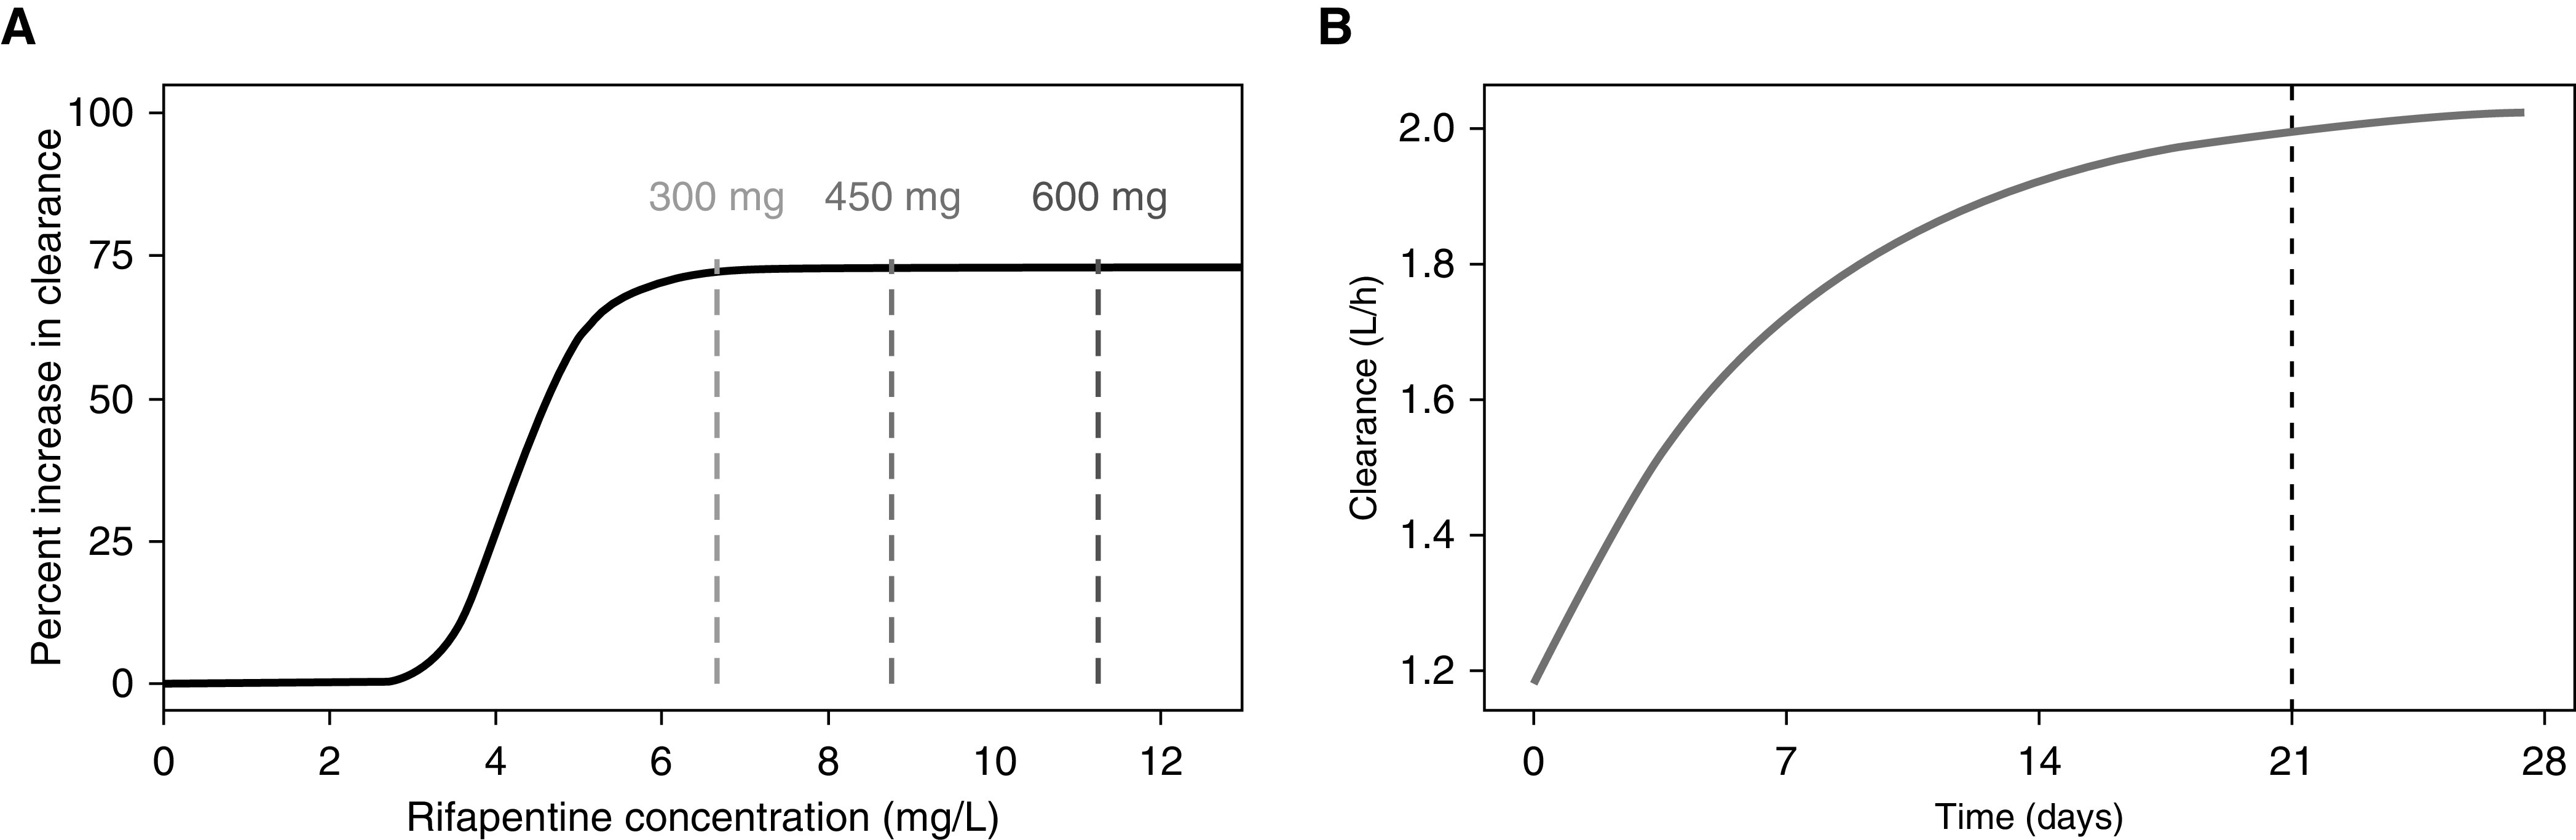
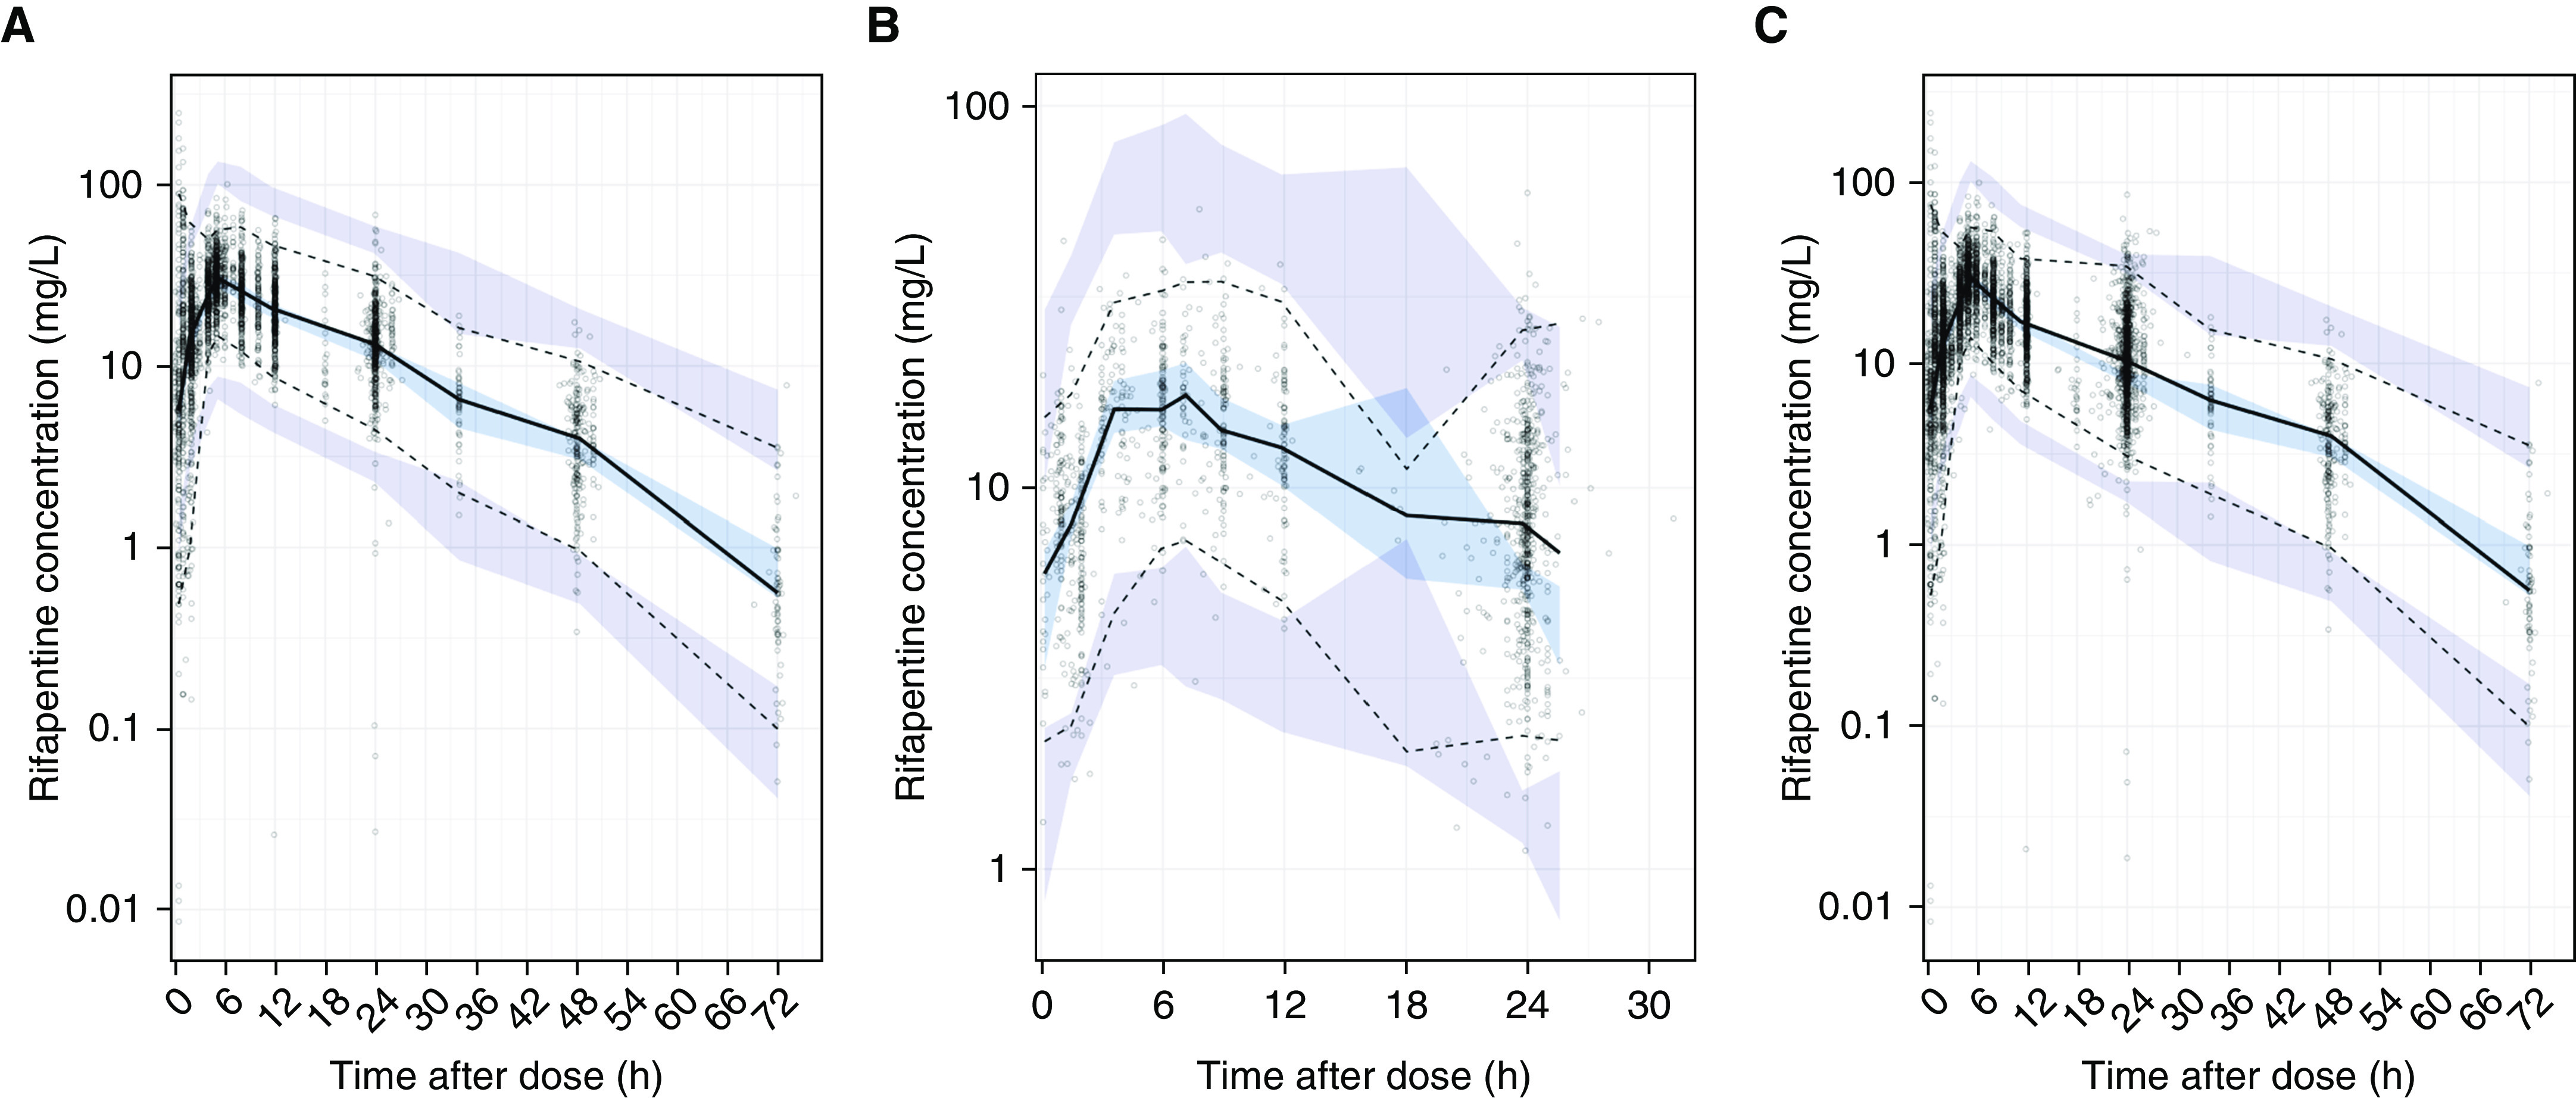
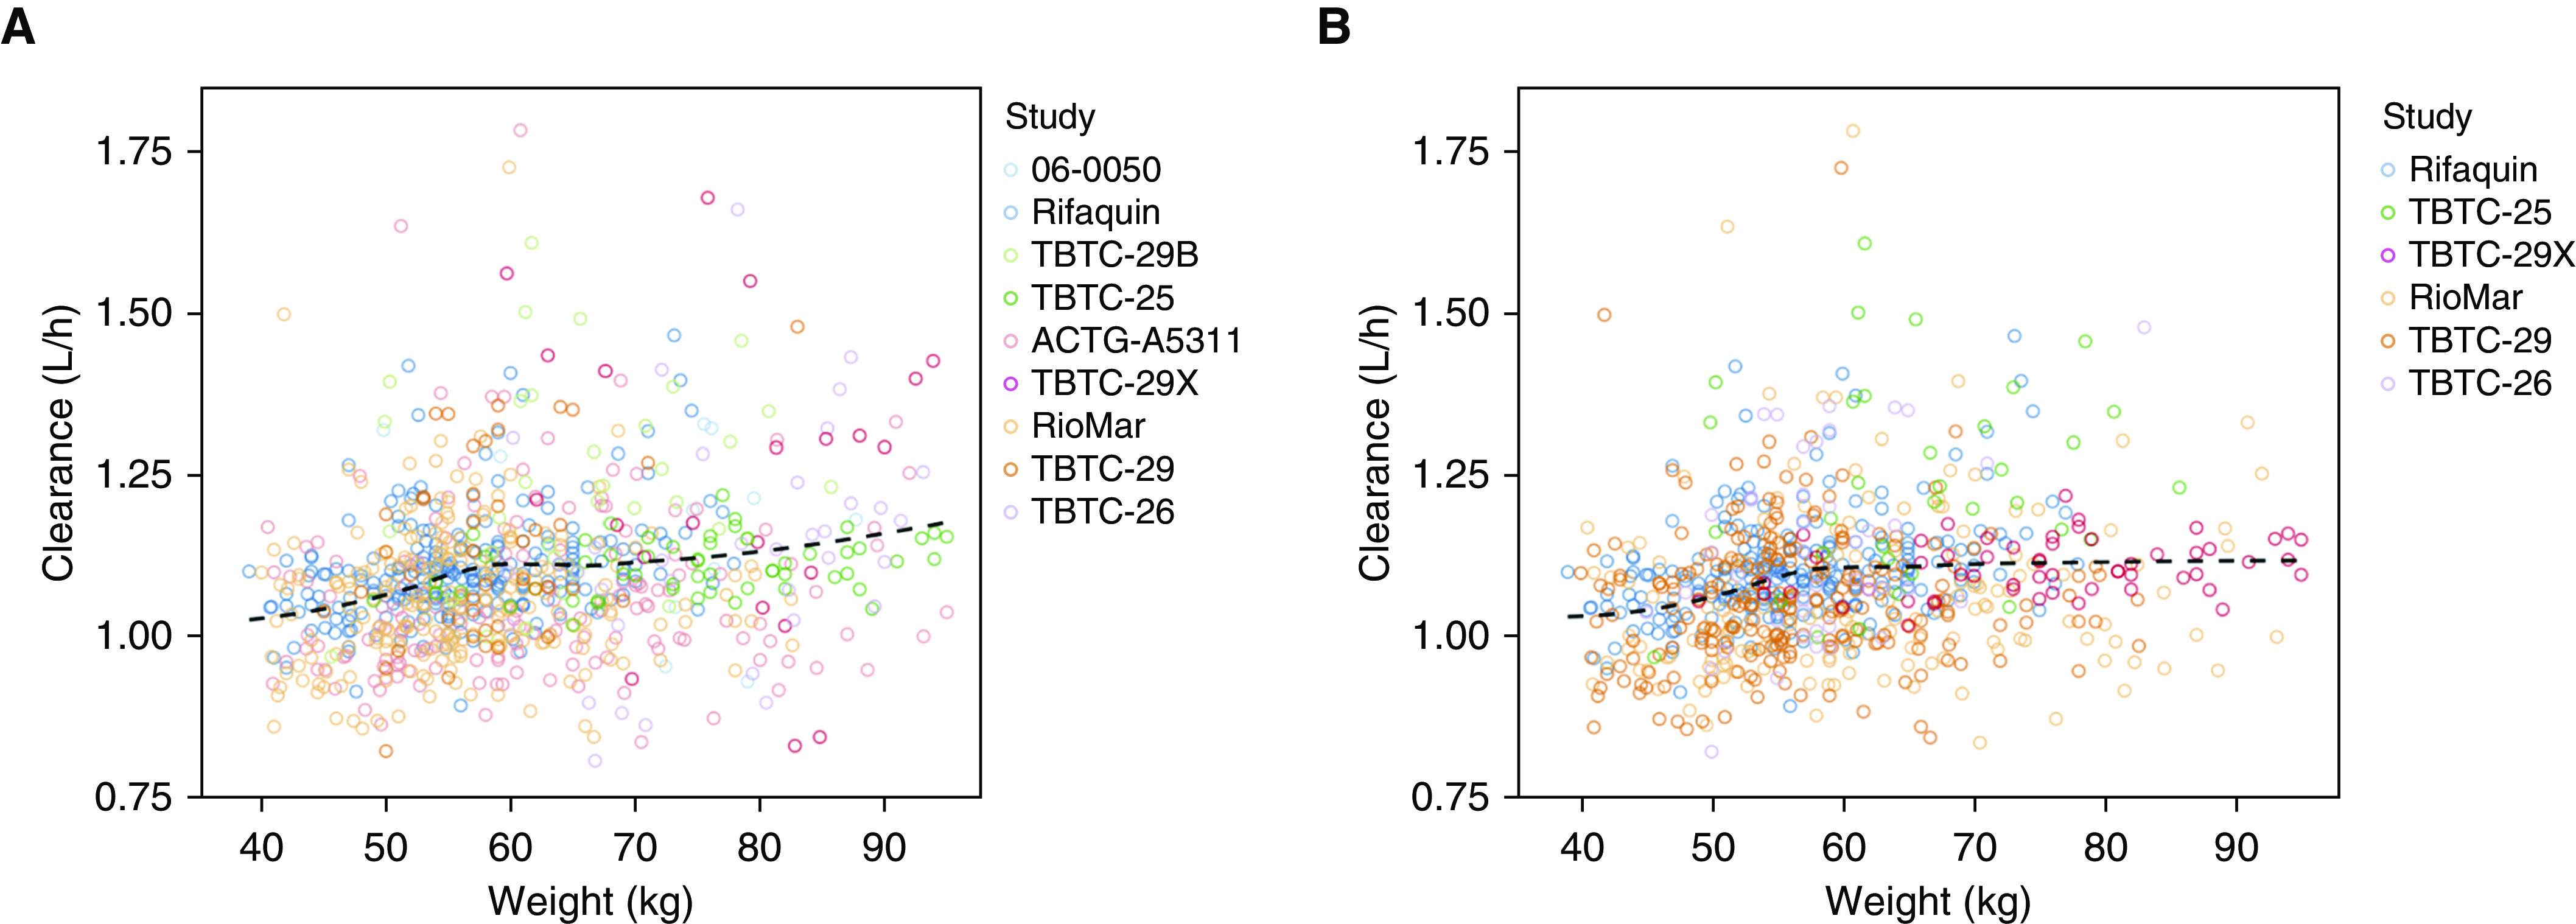
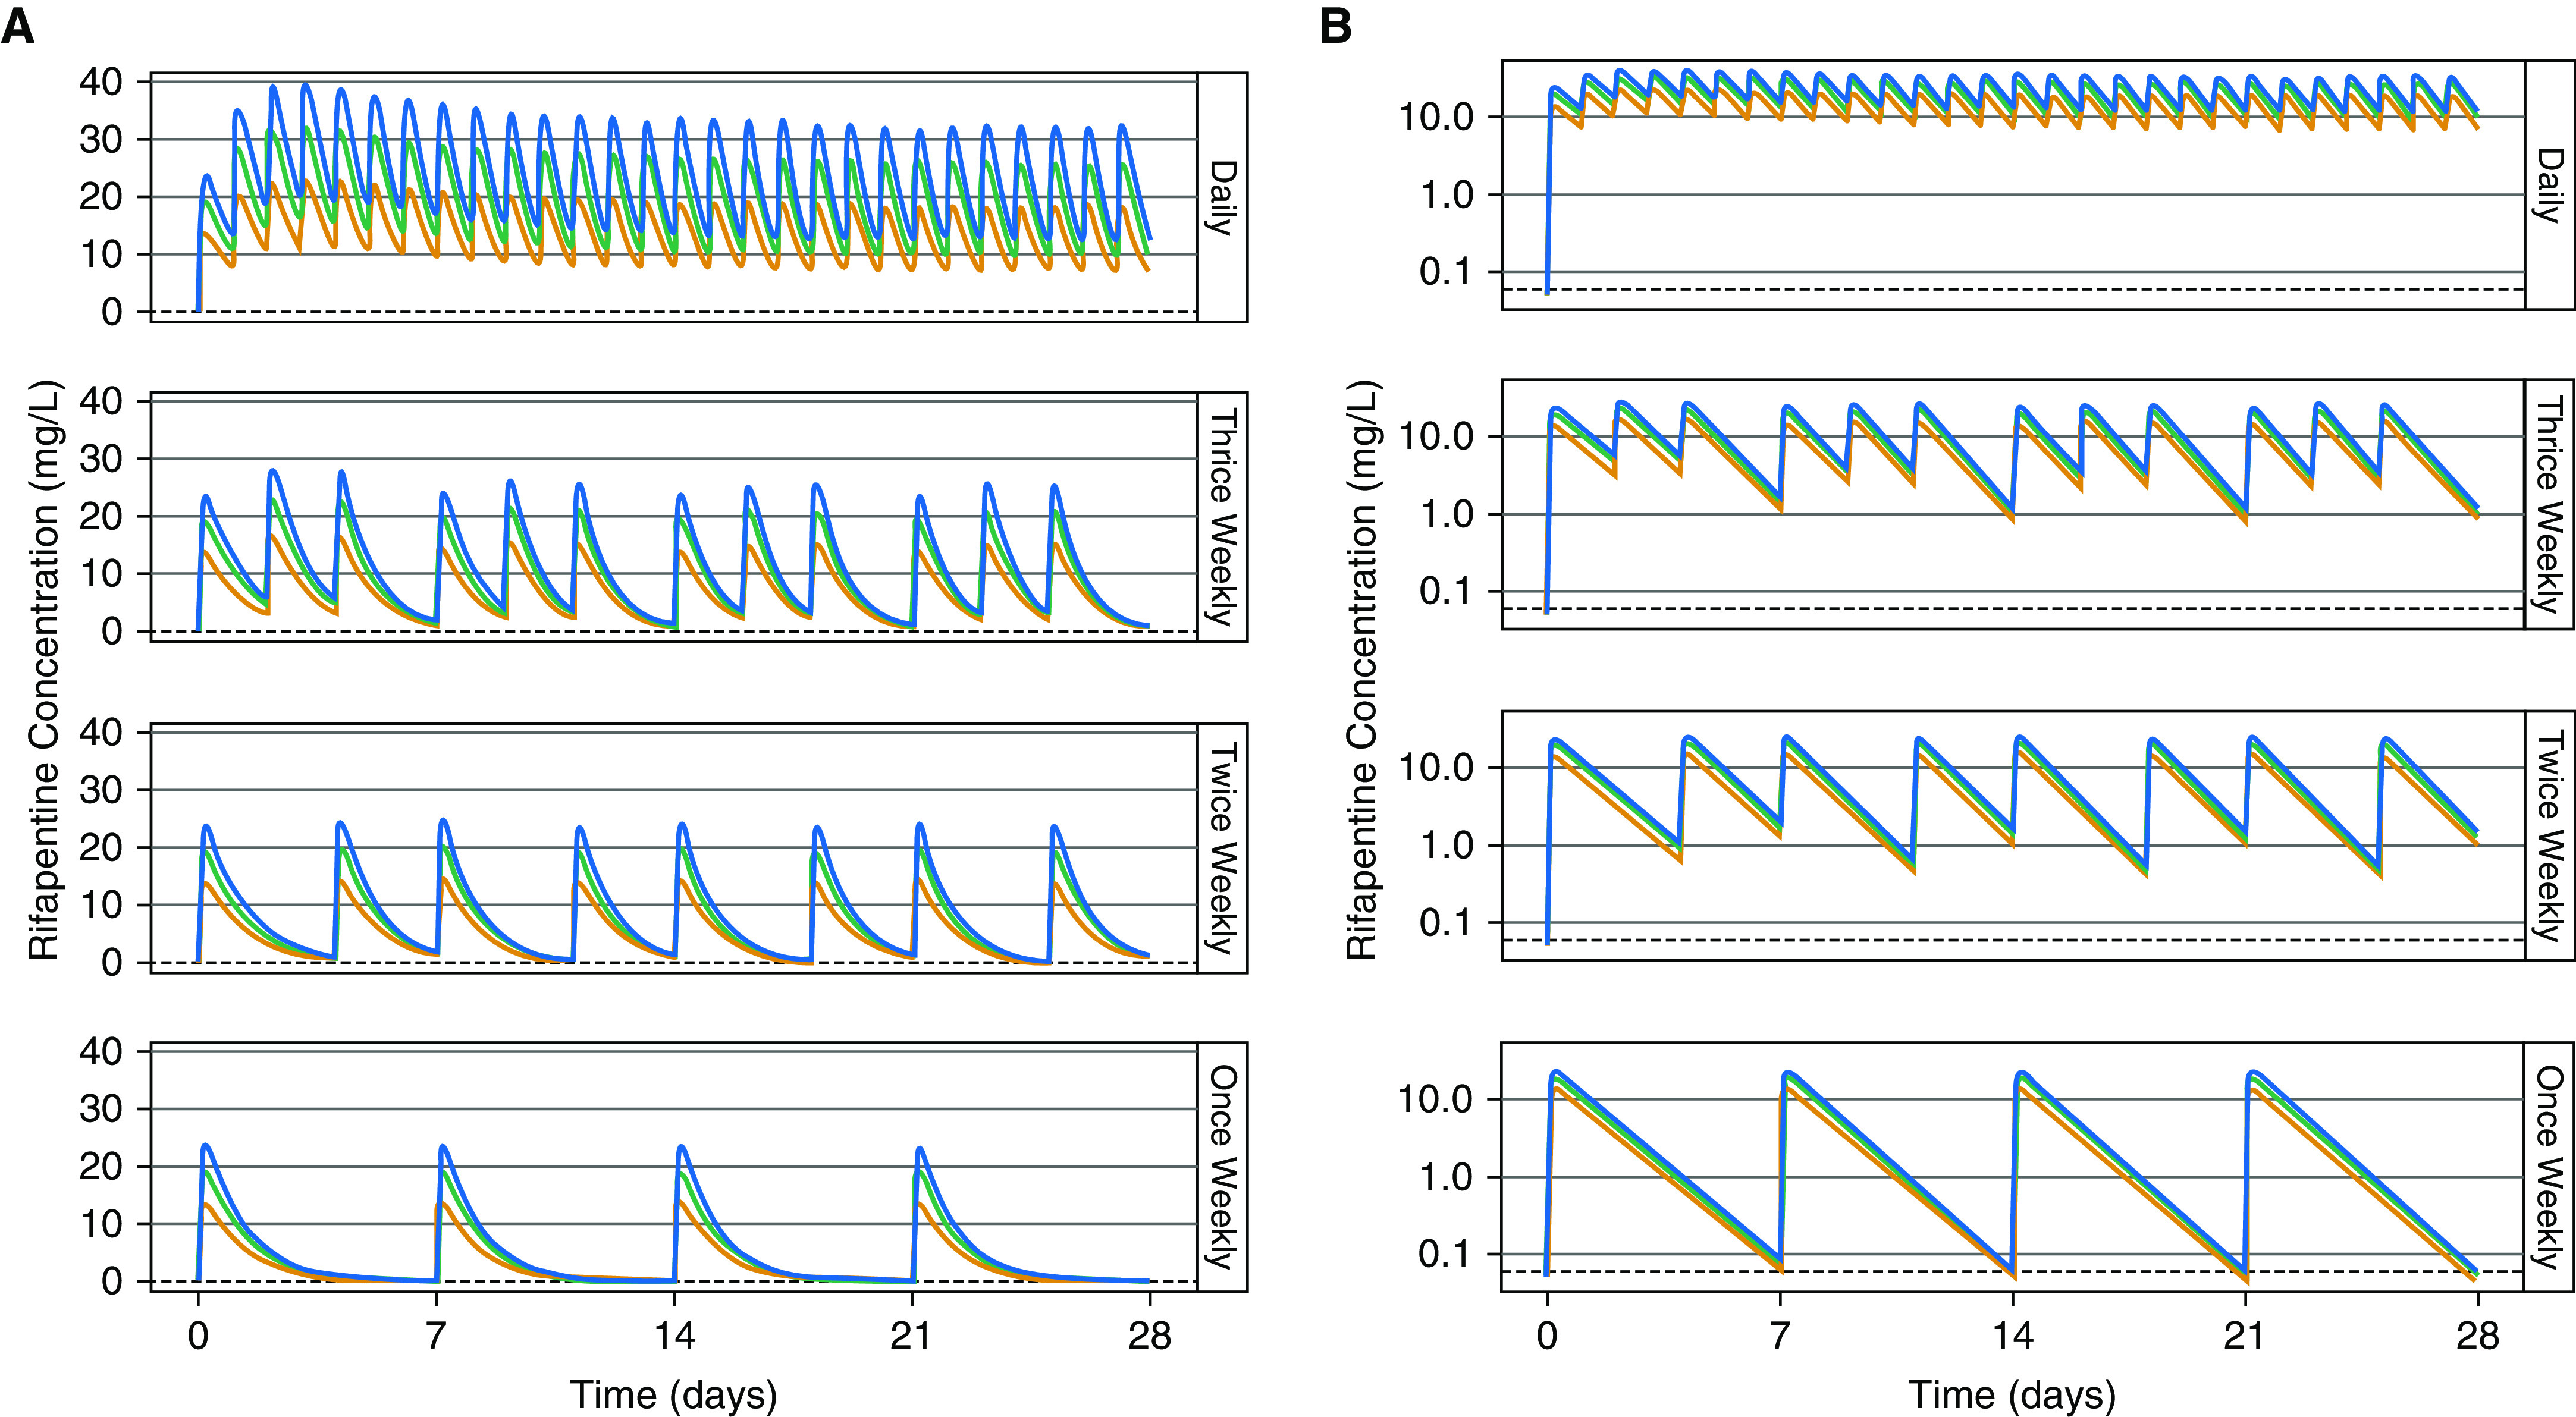
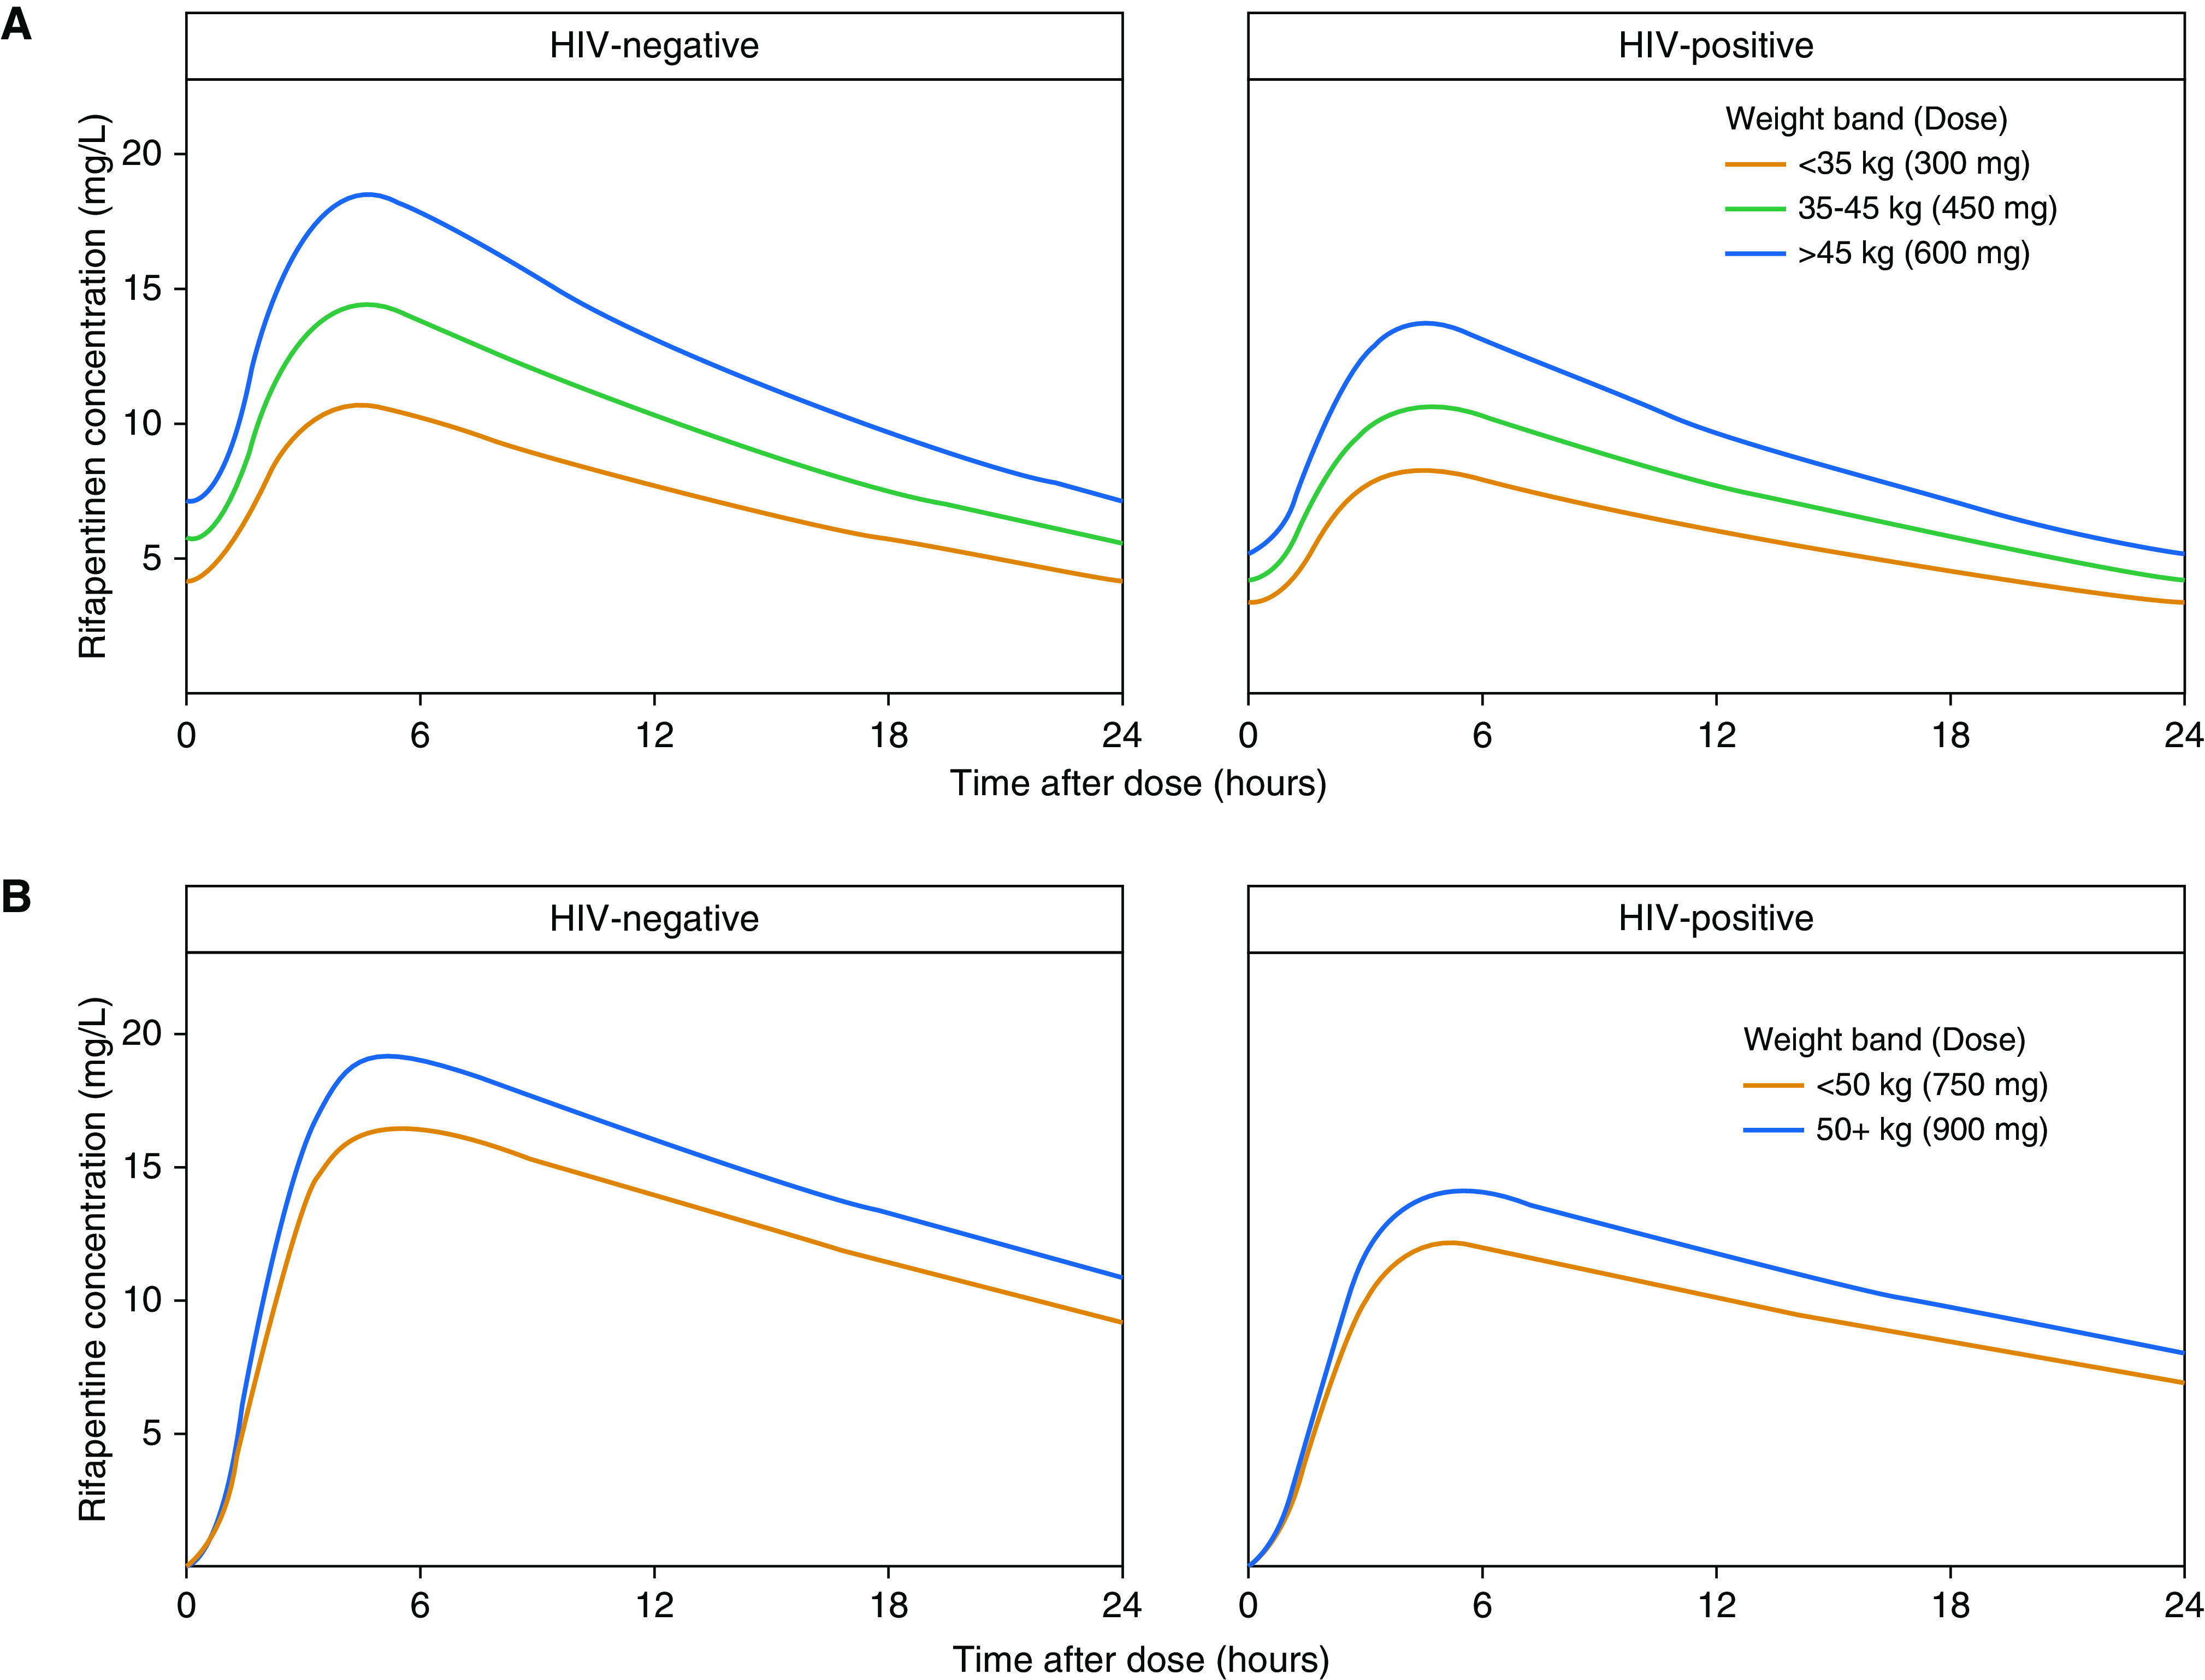
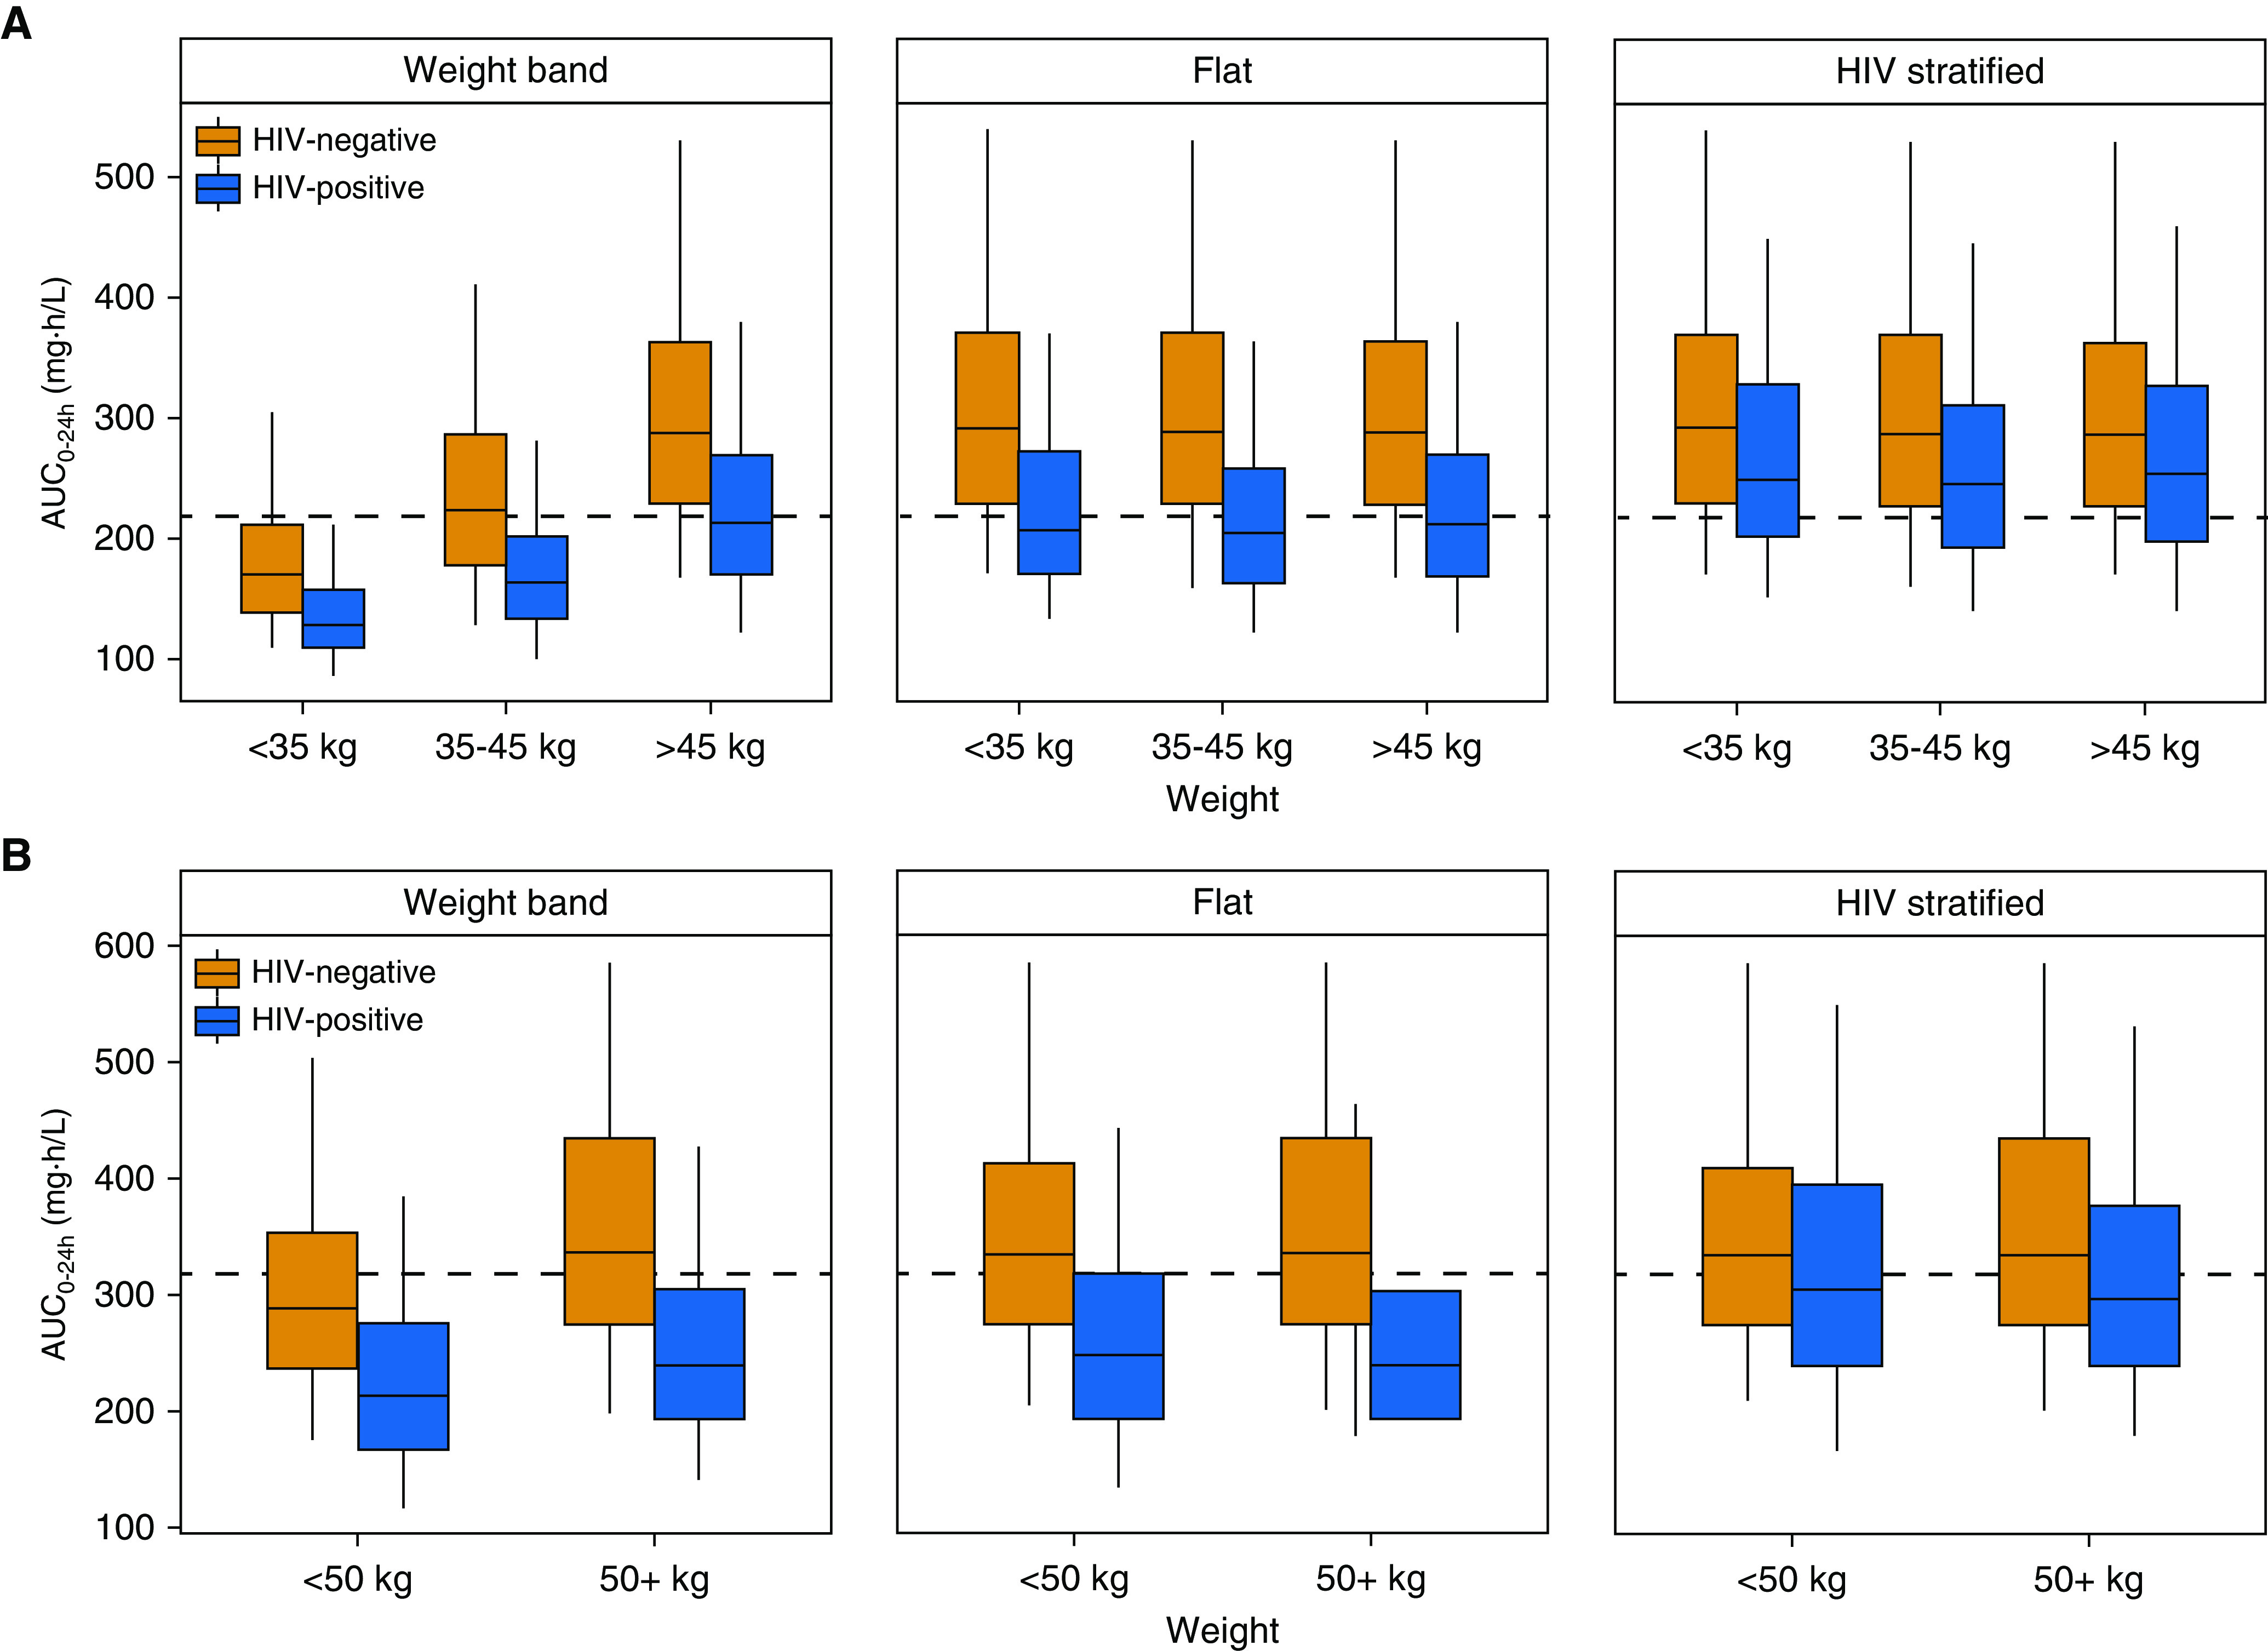
Rationale: Rifapentine has been investigated at various doses, frequencies, and dosing algorithms, but clarity on the optimal dosing approach is lacking.Objectives: To characterize rifapentine population pharmacokinetics, including autoinduction, and determine optimal dosing strategies for short-course rifapentine-based regimens for latent tuberculosis infection.Methods: Rifapentine pharmacokinetic studies were identified though a systematic review of literature. Individual plasma concentrations were pooled, and nonlinear mixed-effects modeling was performed. A subset of data was reserved for external validation. Simulations were performed under various dosing conditions, including current weight-based methods; and alternative methods driven by identified covariates.Measurements and Main Results: We identified nine clinical studies with a total of 863 participants with pharmacokinetic data (n = 4,301 plasma samples). Rifapentine population pharmacokinetics were described successfully with a one-compartment distribution model. Autoinduction of clearance was driven by rifapentine plasma concentrations. The maximum effect was a 72% increase in clearance and was reached after 21 days. Drug bioavailability decreased by 27% with HIV infection, decreased by 28% with fasting, and increased by 49% with a high-fat meal. Body weight was not a clinically relevant predictor of clearance. Pharmacokinetic simulations showed that current weight-based dosing leads to lower exposures in individuals with low weight, which can be overcome with flat dosing. In HIV-positive patients, 30% higher doses are required to match drug exposure in HIV-negative patients.Conclusions: Weight-based dosing of rifapentine should be removed from clinical guidelines, and higher doses for HIV-positive patients should be considered to provide equivalent efficacy.

Keywords: latent tuberculosis; population pharmacokinetics; rifamycins; rifapentine; tuberculosis.


Figures

Figure 1.
Figure 1.
Preferred Reporting Items for Systematic Reviews and Meta-analyses flow diagram.
Figure 2.
Figure 2.
Final rifapentine pharmacokinetic-enzyme model. The number of transit compartments was estimated using the relationship kTR = (N + 1)/MTT. The ka was assumed to equal the kTR. Rifapentine autoinduction was modeled with an enzyme turnover model, in which the EFF of rifapentine concentration in the central compartment increased the kENZ, thereby increasing the ENZ. Rifapentine CL increased as a result of increased ENZ. The F increased (+) or decreased (−) as indicated. CL = clearance; CLm = metabolite clearance; EFF = effect; ENZ = enzyme pool; F = fraction of drug absorbed or relative availability; ka = absorption rate constant; kENZ = enzyme production rate; kTR = transit-rate constant; MTT = mean transit time; V = apparent volume of distribution; Vm = metabolite volume of distribution.
Figure 3.
Figure 3.
Rifapentine autoinduction profile. (A) The sigmoid relationship between rifapentine concentration and autoinduction is shown with the solid black line. Dashed lines represent the average concentration at a steady state of daily therapy with 300, 450, and 600 mg of rifapentine in a typical HIV-negative individual. (B) Rifapentine induction over time after daily administration of 600 mg. The black dashed line represents the time at which the induction process reaches a steady state.
Figure 4.
Figure 4.
Validation of the structural rifapentine population pharmacokinetic model. Prediction-corrected visual predictive check of base model with (A) analysis data set, (B) validation data set, and (C) combined data set. Panels show the model predictions (shaded areas) compared with observed or raw rifapentine concentrations (dots). Model predictions were based on the base structural model, built from the analysis data set alone. The 5th (dashed line), 50th (solid line), and 95th (dashed line) percentiles of the observed raw data are overlaid onto the 95% confidence intervals of model-predicted concentrations at the 50th (light blue) as well as 5th and 95th (purple) percentiles, obtained from 500 simulations of each respective data set.
Figure 5.
Figure 5.
Relationship between weight and rifapentine clearance. The relationship was assessed for (A) all subjects and (B) only patients with drug-sensitive tuberculosis disease or latent tuberculosis infection with final model-parameter estimates. The dashed line represents local regression curve. ACTG = AIDS Clinical Trials Group; Rifaquin = Rifapentine and a Quinolone in the Treatment of Pulmonary Tuberculosis; RioMar = Rifapentine Plus Moxifloxacin-based Regimen for Treatment of Pulmonary Tuberculosis; TBTC = Tuberculosis Trials Consortium Study.
Figure 6.
Figure 6.
Effect of dose and dosing frequency on rifapentine exposure. (A) Rifapentine concentration over time and (B) concentration over time in log scale in a typical individual without HIV infection following once-daily, thrice-weekly, twice-weekly, and once-weekly administration of 600 mg (orange), 900 mg (green), or 1,200 mg (blue). The black dashed lines show the minimum inhibitory concentration (equal to 0.06 mg/L).
Figure 7.
Figure 7.
Pharmacokinetic profiles of rifapentine following (A) a regimen of daily isoniazid-rifapentine for 1 month and (B) a regimen of once-weekly rifapentine-isoniazid for 3 months. Concentration–time profiles over 24 hours are shown for the typical adult by HIV status on (A) Day 21 of therapy, to reflect steady-state concentrations, and (B) after the first dose, as no accumulation occurs with weekly dosing.
Figure 8.
Figure 8.
Predicted rifapentine exposures with different dosing methods for (A) a regimen of daily isoniazid-rifapentine for 1 month (1HP) and (B) a regimen of once-weekly rifapentine-isoniazid for 3 months (3HP). Profiles for drug-exposure area under the concentration–time curve over 24 hours (AUC0–24h) are based on 500 simulations. (A) 1HP predictions reflect steady-state exposures to account for autoinduction. “Weight-band” rifapentine doses were 300 mg for <35 kg, 450 mg for 35–45 kg, and 600 mg for >45 kg, as currently recommended for 1HP. The “flat” approach prescribed 600 mg to all individuals, and the “HIV-stratified” approach increased the dose in HIV-positive individuals to 750 mg. (B) 3HP doses were 750 mg for <50 kg and 900 mg for ≥50 kg for the weight-band approach, as currently recommended. The flat approach prescribed 900 mg to all individuals, and the HIV-stratified approach increased the dose in HIV-positive individuals to 1,200 mg. Dashed lines represent (B) the median AUC0–24h (317 mg · h/L) observed in patients treated with 3HP in the PREVENT-TB trial (i.e., TBTC-26 [Tuberculosis Trials Consortium Study 26]) and (A) the median predicted AUC0–24h in HIV-positive patients with 600 mg daily (219 mg · h/L).
Figure 9.
Figure 9.
Predictors of Month 2 culture conversion. Data were acquired from two phase 2 clinical studies (TBTC-29 [Tuberculosis Trials Consortium Study 29] and TBTC-29X), in which participants received 10 mg/kg of rifapentine daily. Odds ratios are from univariate analysis. AUC = area under the concentration–time curve; CI = confidence interval.

Comment in

References

    1. World Health Organization. Global tuberculosis report 2018. Geneva, Switzerland: WHO Press; 2018.
    1. American Thoracic Society; Centers for Disease Control and Prevention. Targeted tuberculin testing and treatment of latent tuberculosis infection. This official statement of the American Thoracic Society was adopted by the ATS Board of Directors, July 1999. This is a Joint Statement of the American Thoracic Society (ATS) and the Centers for Disease Control and Prevention (CDC). This statement was endorsed by the Council of the Infectious Diseases Society of America. (IDSA), September 1999, and the sections of this statement as it relates to infants and children were endorsed by the American Academy of Pediatrics (AAP), August 1999. Am J Respir Crit Care Med. 2000;161:S221–S247. - PubMed
    1. Horsburgh CR, Jr, Goldberg S, Bethel J, Chen S, Colson PW, Hirsch-Moverman Y, et al. Tuberculosis Epidemiologic Studies Consortium. Latent TB infection treatment acceptance and completion in the United States and Canada. Chest. 2010;137:401–409. - PubMed
    1. Sterling TR, Villarino ME, Borisov AS, Shang N, Gordin F, Bliven-Sizemore E, et al. TB Trials Consortium PREVENT TB Study Team. Three months of rifapentine and isoniazid for latent tuberculosis infection. N Engl J Med. 2011;365:2155–2166. - PubMed
    1. Swindells S, Ramchandani R, Gupta A, Benson CA, Leon-Cruz J, Mwelase N, et al. BRIEF TB/A5279 Study Team. One month of rifapentine plus isoniazid to prevent HIV-related tuberculosis. N Engl J Med. 2019;380:1001–1011. - PMC - PubMed

Publication types