. 2020 Nov 26;22(11):1614-1624.
doi: 10.1093/neuonc/noaa121.

Clinical, molecular, and radiomic profile of gliomas with FGFR3-TACC3 fusions

Affiliations

Clinical, molecular, and radiomic profile of gliomas with FGFR3-TACC3 fusions

Anna Luisa Di Stefano et al. Neuro Oncol. .

Abstract

Background: Actionable fibroblast growth factor receptor 3 (FGFR3)-transforming acidic coiled-coil protein 3 fusions (F3T3) are found in approximately 3% of gliomas, but their characteristics and prognostic significance are still poorly defined. Our goal was to characterize the clinical, radiological, and molecular profile of F3T3 positive diffuse gliomas.

Methods: We screened F3T3 fusion by real-time (RT)-PCR and FGFR3 immunohistochemistry in a large series of gliomas, characterized for main genetic alterations, histology, and clinical evolution. We performed a radiological and radiomic case control study, using an exploratory and a validation cohort.

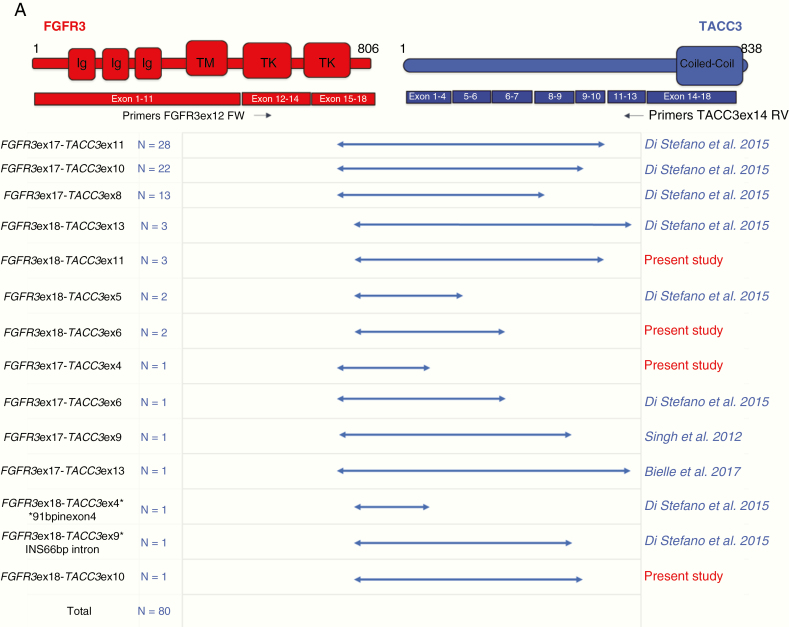
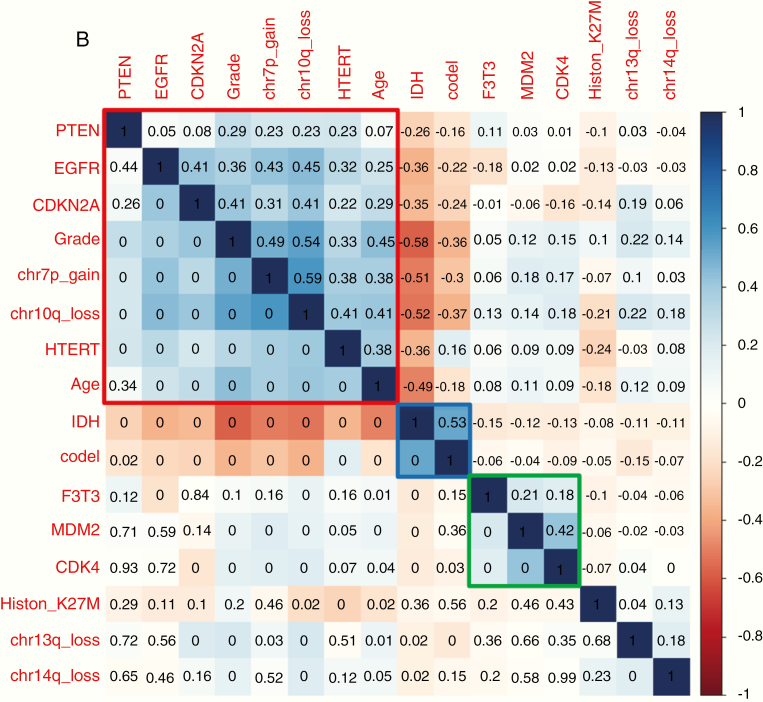
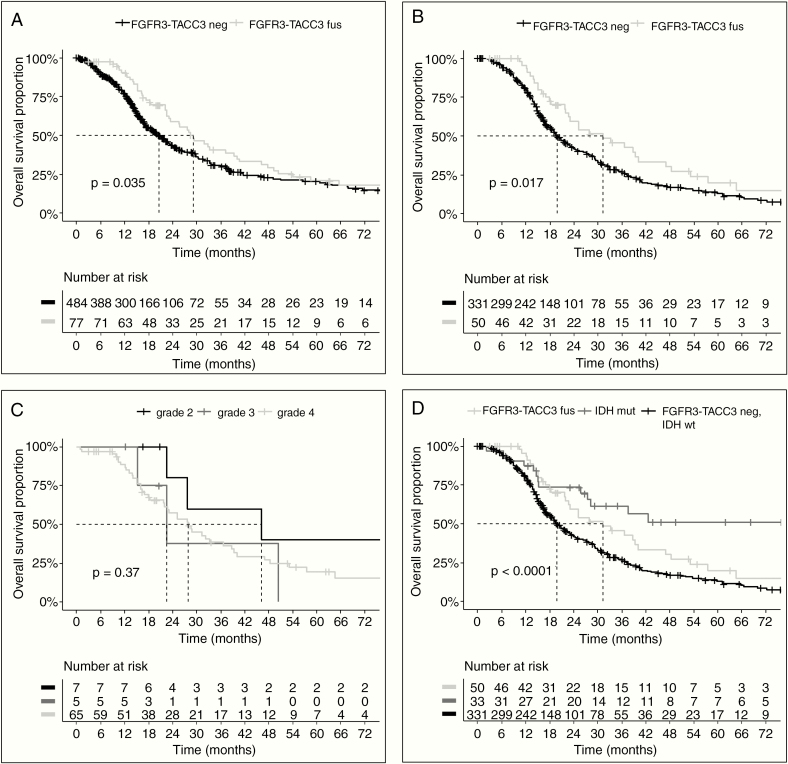
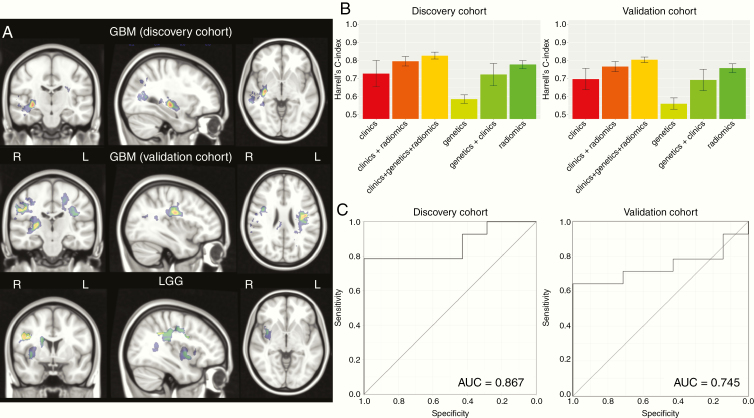
Results: We screened 1162 diffuse gliomas (951 unselected cases and 211 preselected for FGFR3 protein immunopositivity), identifying 80 F3T3 positive gliomas. F3T3 was mutually exclusive with IDH mutation (P < 0.001) and EGFR amplification (P = 0.01), defining a distinct molecular cluster associated with CDK4 (P = 0.04) and MDM2 amplification (P = 0.03). F3T3 fusion was associated with longer survival for the whole series and for glioblastomas (median overall survival was 31.1 vs 19.9 mo, P = 0.02) and was an independent predictor of better outcome on multivariate analysis.F3T3 positive gliomas had specific MRI features, affecting preferentially insula and temporal lobe, and with poorly defined tumor margins. F3T3 fusion was correctly predicted by radiomics analysis on both the exploratory (area under the curve [AUC] = 0.87) and the validation MRI (AUC = 0.75) cohort. Using Cox proportional hazards models, radiomics predicted survival with a high C-index (0.75, SD 0.04), while the model combining clinical, genetic, and radiomic data showed the highest C-index (0.81, SD 0.04).

Conclusion: F3T3 positive gliomas have distinct molecular and radiological features, and better outcome.

Keywords: F3T3 gene fusions; VASARI features; diffuse gliomas; lesion to symptom mapping.


Figures

Fig.1
Fig.1
(A) Structure of F3T3 fusions identified by RT-PCR Sanger sequencing. Predicted F3T3 fusion protein encoded by the transcripts identified by RT-PCR. Regions corresponding to FGFR3 or TACC3 are shown in red or blue, respectively. On the left are indicated FGFR3 and TACC3 exons joined in the fused mRNA; the presence of TACC3 introns is also reported when they are spliced in the fusion cDNA. In the second column, the number of patients harboring the corresponding fusion variant is indicated. The novel transcripts discovered in this study are highlighted in red. Black arrows indicate the position of the primers used for the F3T3 fusion screening. (B) Correlation matrix of the main genetic alterations in the whole data set of 1162 diffuse gliomas. The variables are indicated in blue when associated, in red when inversely associated. Upper triangle: strength of the correlation (rho values). Lower triangle: statistical significance (P-values; 0 means P < 0.01). Three main clusters were identified: EGFR amplification with 7p gain, 10q loss and older age at diagnosis (cluster 1, in red), IDH mutation with 1p/19q codeletion (cluster 2, in blue), and F3T3 fusion with MDM2 and CDK4 amplifications (cluster 3, in green).
Fig.1
Fig.1
(A) Structure of F3T3 fusions identified by RT-PCR Sanger sequencing. Predicted F3T3 fusion protein encoded by the transcripts identified by RT-PCR. Regions corresponding to FGFR3 or TACC3 are shown in red or blue, respectively. On the left are indicated FGFR3 and TACC3 exons joined in the fused mRNA; the presence of TACC3 introns is also reported when they are spliced in the fusion cDNA. In the second column, the number of patients harboring the corresponding fusion variant is indicated. The novel transcripts discovered in this study are highlighted in red. Black arrows indicate the position of the primers used for the F3T3 fusion screening. (B) Correlation matrix of the main genetic alterations in the whole data set of 1162 diffuse gliomas. The variables are indicated in blue when associated, in red when inversely associated. Upper triangle: strength of the correlation (rho values). Lower triangle: statistical significance (P-values; 0 means P < 0.01). Three main clusters were identified: EGFR amplification with 7p gain, 10q loss and older age at diagnosis (cluster 1, in red), IDH mutation with 1p/19q codeletion (cluster 2, in blue), and F3T3 fusion with MDM2 and CDK4 amplifications (cluster 3, in green).
Fig. 2
Fig. 2
Survival analysis of patients in the study. (A) Survival of IDH wildtype diffuse glioma (grades II‒IV) patients according to the F3T3 status (median OS = 29.1 mo for F3T3-positive vs 20.5 mo for F3T3-negative; P = 0.04). (B) Survival of IDH wildtype glioblastoma (GBM) patients treated with standard radiation therapy plus concomitant and adjuvant temozolomide after surgery or biopsy, according to the F3T3 status (median OS, 31.1 mo for F3T3-positive vs. 19.9 mo for F3T3-negative, P = 0.02). (C) Survival of F3T3-positive patients according to grade (P = 0.37). (D) Survival of GBM patients according to F3T3 and IDH status (median OS, 29.1 mo for F3T3-positive/IDH wildtype GBM vs 19.9 mo for F3T3-negative/IDH wildtype GBM, P = 0.04; median OS not reached for F3T3-negative/IDH mutant, P < 0.001). Tick marks represent censored patients.
Fig. 3
Fig. 3
(A) Heatmap of brain regions with positive significant correlation with F3T3 fusion (adjusted P < 0.05) using a SCCAN (sparse canonical correlation analysis). Color scale represents the value r of correlation (from black = 0 to red = 1). R = right hemisphere; L = left hemisphere. This analysis shows a more frequent involvement of insula and cortico-subcortical regions. (B) Barplots representing the mean value of Harrell’s C-index of 5 cross-validations using different types of data (genetics, clinics, and radiomics) in the 2 independent exploratory and validation cohorts of GBM. Error bars indicate the SD of 5 cross-validations. (C) Performance of the F3T3 status classification in the 2 independent exploratory and validation cohorts of GBM, assessed by ROC curve. Further details are provided in the supplementary methods, available at https://sansonlab.gitbook.io/workspace/.

References

    1. Singh D, Chan JM, Zoppoli P, et al. Transforming fusions of FGFR and TACC genes in human glioblastoma. Science. 2012;337(6099):1231–1235. - PMC - PubMed
    1. Carneiro BA, Elvin JA, Kamath SD, et al. FGFR3-TACC3: A novel gene fusion in cervical cancer. Gynecol Oncol Rep. 2015;13:53–56. - PMC - PubMed
    1. Capelletti M, Dodge ME, Ercan D, et al. Identification of recurrent FGFR3-TACC3 fusion oncogenes from lung adenocarcinoma. Clin Cancer Res. 2014;20(24):6551–6558. - PubMed
    1. Williams SV, Hurst CD, Knowles MA. Oncogenic FGFR3 gene fusions in bladder cancer. Hum Mol Genet. 2013;22(4):795–803. - PMC - PubMed
    1. Yuan L, Liu ZH, Lin ZR, Xu LH, Zhong Q, Zeng MS. Recurrent FGFR3-TACC3 fusion gene in nasopharyngeal carcinoma. Cancer Biol Ther. 2014;15(12):1613–1621. - PMC - PubMed

Publication types

Substances