. 2020 Jun 9;14(6):1076-1092.
doi: 10.1016/j.stemcr.2020.04.005. Epub 2020 May 14.

The Median Eminence, A New Oligodendrogenic Niche in the Adult Mouse Brain

Affiliations

The Median Eminence, A New Oligodendrogenic Niche in the Adult Mouse Brain

Rina Zilkha-Falb et al. Stem Cell Reports. .

Abstract

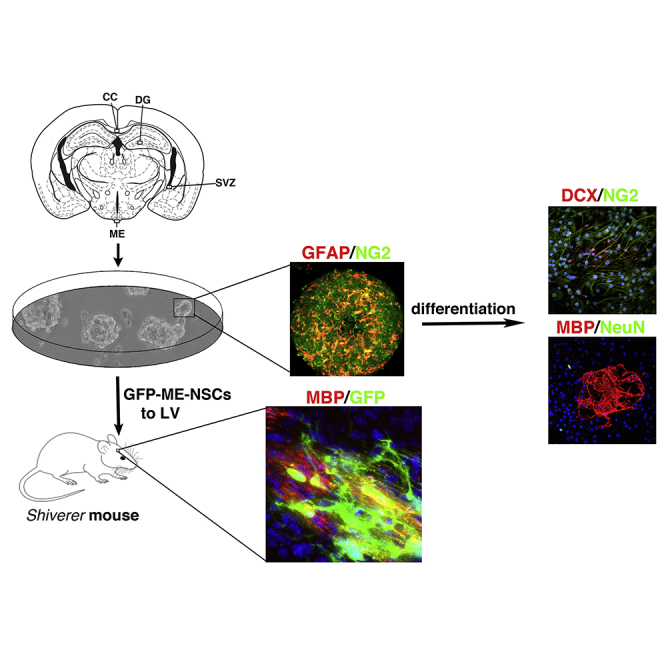
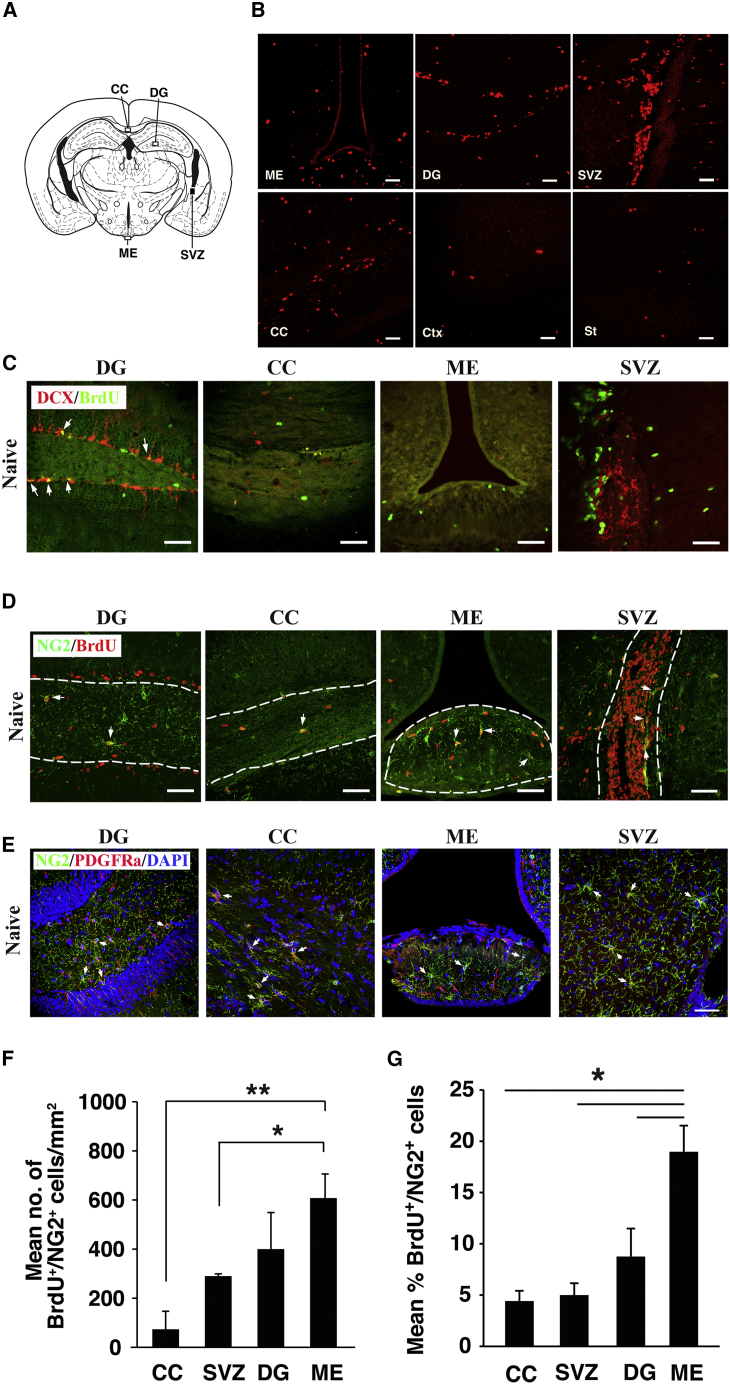
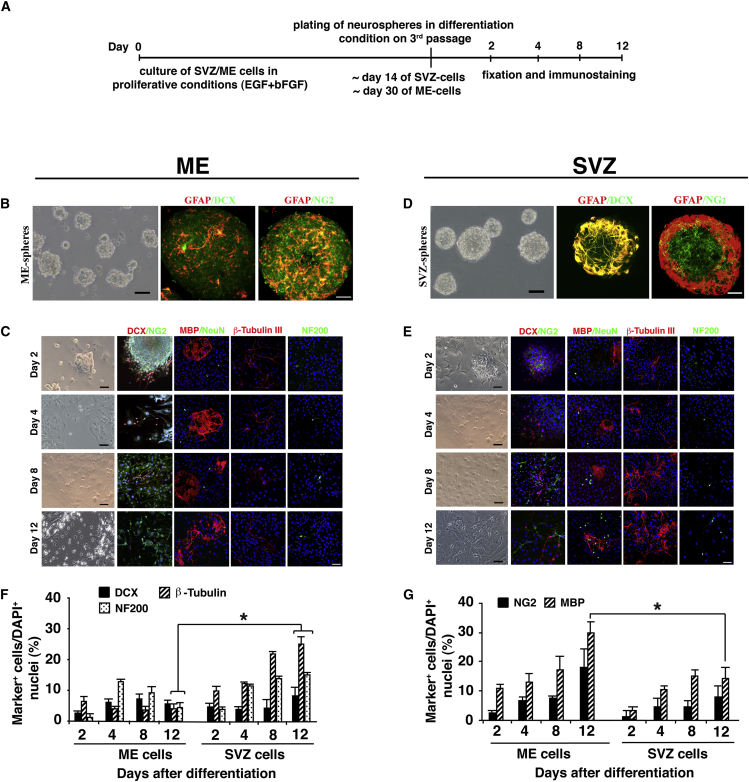
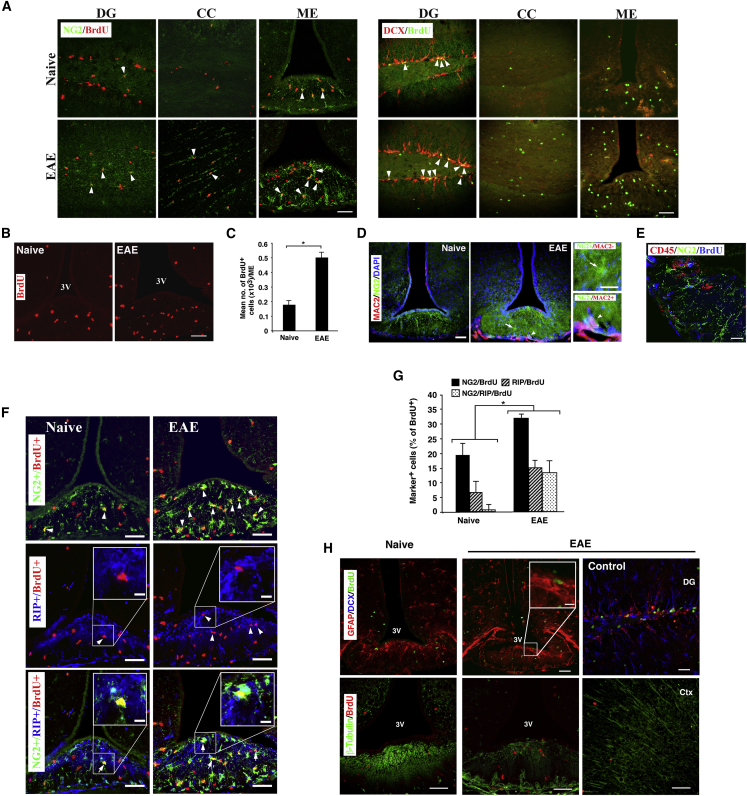
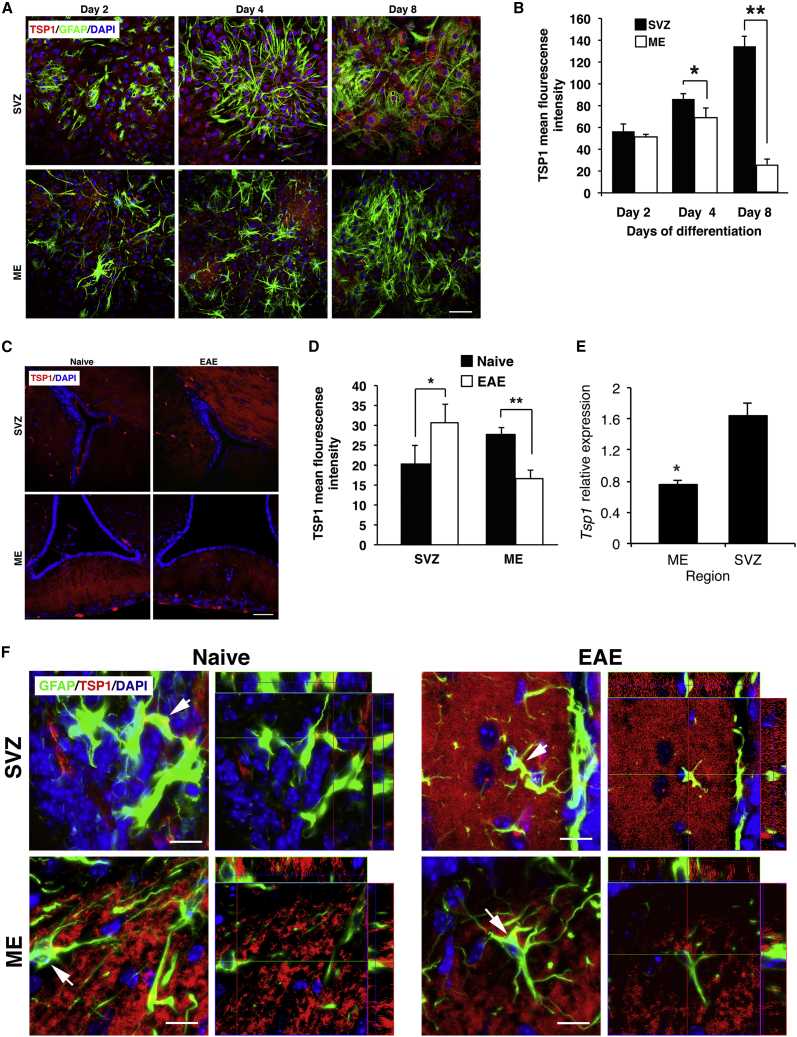
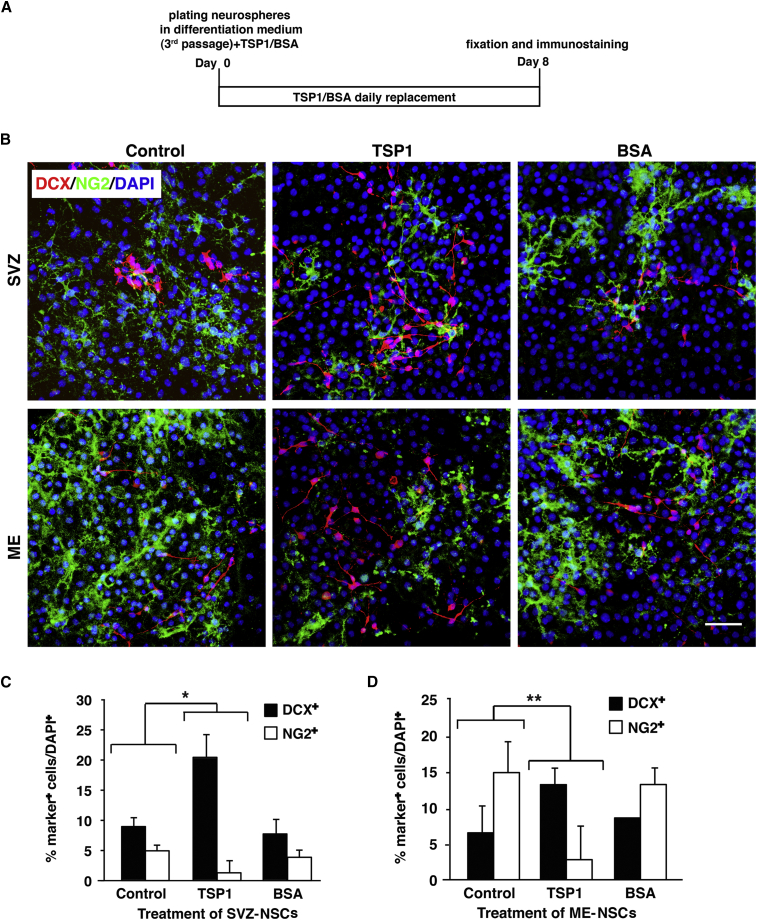
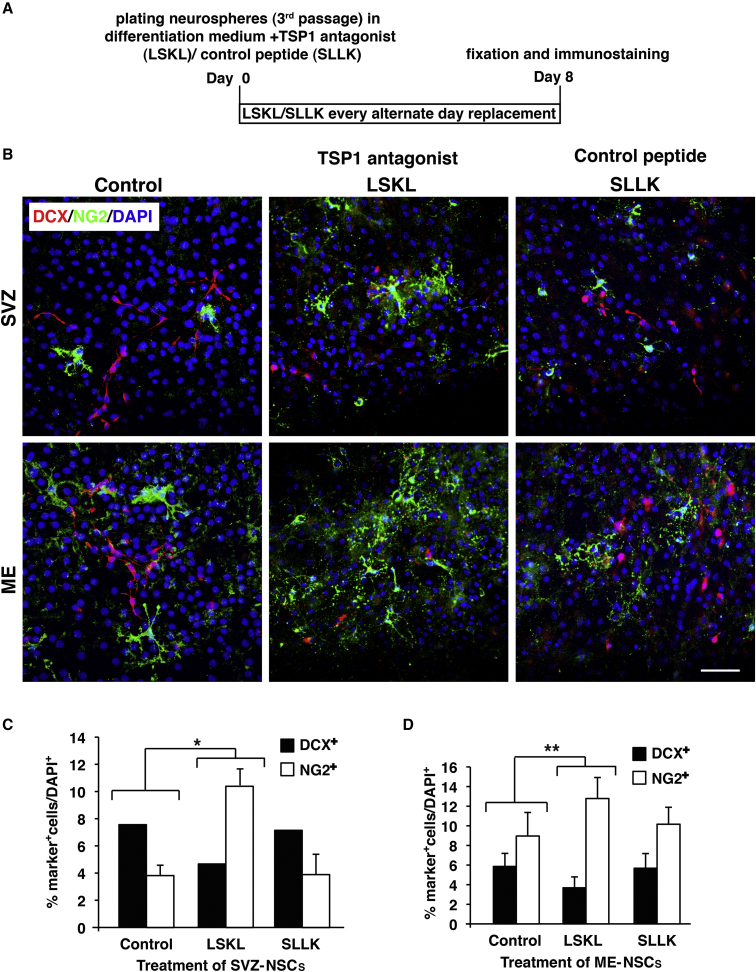
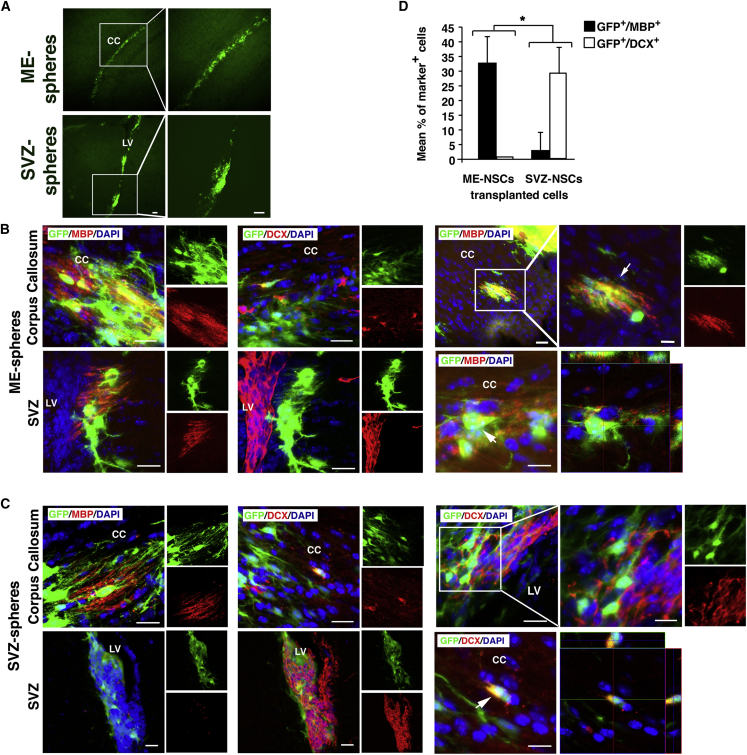
The subventricular zone (SVZ) of the lateral ventricles and the subgranular zone (SGZ) of the dentate gyrus in the hippocampus are known as neurogenic niches. We show that the median eminence (ME) of the hypothalamus comprises BrdU+ newly proliferating cells co-expressing NG2 (oligodendrocyte progenitors) and RIP (pre-myelinating oligodendrocytes), suggesting their differentiation toward mature oligodendrocytes (OLs). ME cells can generate neurospheres (NS) in vitro, which differentiate mostly to OLs compared with SVZ-NS that typically generate neurons. Interestingly, this population of oligodendrocyte progenitors is increased in the ME from experimental autoimmune encephalomyelitis (EAE)-affected mice. Notably, the thrombospondin 1 (TSP1) expressed by astrocytes, acts as negative regulator of oligodendrogenesis in vitro and is downregulated in the ME of EAE mice. Importantly, transplanted ME-NS preferentially differentiate to MBP+ OLs compared with SVZ-NS in Shiverer mice. Hence, discovering the ME as a new site for myelin-producing cells has a great importance for advising future therapy for demyelinating diseases and spinal cord injury.

Keywords: corpus callosum; experimental autoimmune encephalomyelitis; median eminence; multiple sclerosis; myelin repair; neural stem cells; oligodendrocyte progenitors cells; subventricular zone.


Figures

None
Graphical abstract
Figure 1
Figure 1
OPCs in the ME of Naive Mice (A) Scheme shows regions analyzed for BrdU+ cells. (B) BrdU staining in the ME DG, SVZ, CC, Ctx, and St. (C) Absence of neuronal progenitors (DCX) in the ME and CC compared with DG. Arrows indicate DCX+ BrdU+ cells. (D) Images show OPCs (NG2) in the DG, CC, SVZ, and ME boxed in (A). Arrows indicate NG2+ BrdU+ cells. (E) Images show NG2+ PDGFRa+ OPCs. (F and G) Quantitative analysis of NG2+ BrdU+ cells in the DG, CC, SVZ, and ME as (F) mean number of NG2+ BrdU+ cells/mm2. p = 0.013, ∗∗p = 0.00079, and (G) as their mean percentage of BrdU+. p = 0.0007 (n = 4 for each group). Scale bar, 50 μm.
Figure 2
Figure 2
ME Cells Generate NS and Differentiate In Vitro to Neuro/Oligo Progenitors (A) Explanation of NS culture and fixation schedule. (B and D) Generation of NS from (B) isolated ME compared with (D) SVZ cells. Expended ME-NS express markers of neuronal (DCX), oligodendrocyte progenitors (NG2), and astrocytes (GFAP). Shown are bright field images of NS and immunostaining for neural markers. (C and E) Temporal analysis of neural markers expressed by ME-NS (C) upon differentiation compared with (E) SVZ-NS and their quantitative analysis of (F) neuronal and (G) oligodendrocyte markers (G). Scale bar, 50 μm.
Figure 3
Figure 3
Increased Number of OPCs in the ME of EAE Mice (A) Images show NG2/BrdU and DCX/BrdU staining in the DG, CC, and ME. (B) Enhanced BrdU staining of ME in EAE mice compared with naive mice. Arrows indicate double-positive cells. (C) Increased BrdU+ cells in EAE mice compared with naive mice (n = 5 per group). (D) Macrophages (MAC2+) are not localized where OPCs are scored. (E) NG2+ cells are distinctive from CD45+ cells. (F and G) (F) Images of BrdU+ NG2+, BrdU+ RIP+ (arrowheads), and BrdU+ NG2+ RIP+ cells (arrows) in the ME of EAE mice and (G) their quantitative analysis (n = 4 per group). (H) Immunostaining for DCX or β-tubulin with BrdU in the ME. Scale bar, 50 μm. (C) p < 0.01, (G) p = 0.02.
Figure 4
Figure 4
Expression of TSP1 by ME- and SVZ-NSCs (A and B) (A) Immunostaining for GFAP and TSP1 after the indicated time points of differentiation and (B) quantitative analysis of TSP1 fluorescence intensity (n = 6). (C) Images of immunostaining for TSP1 in SVZ and ME. (D) Quantitative analysis of TSP1 fluorescence intensity in SVZ and ME (n = 4 per group). p = 0.003, ∗∗p = p < 0.001. (E) Tsp1 relative expression in the ME and SVZ. p = 0.036. (F) Orthogonal views of GFAP and TSP1 in ME and SVZ in naive mice compared with EAE mice. Low-power images of TSP1 are shown in Figure S4C. Scale bar, 50 μm.
Figure 5
Figure 5
Effect of TSP1 on Differentiation of ME-NSCs Compared with SVZ-NSCs (A) Explanation of NS culture, differentiation in presence of TSP1, and fixation schedule. (B) Staining for DCX and NG2 in ME- and SVZ-NSCs cultures treated with TSP1 or BSA. NSCs cultured in differentiation medium served as control. Shown are representative images out of three repeats. (C and D) Quantitative analysis of (C) SVZ-NSC and (D) ME-NSC differentiation to DCX+ cells and NG2+ cells in the presence of TSP1 (mean ± SD). Scale bar, 50 μm. p ≤ 0.004, ∗∗p ≤ 0.005.
Figure 6
Figure 6
Effect of TSP1 Antagonist on Differentiation of ME-NSCs Compared with SVZ-NSCs (A) Explanation of NS culture, differentiation in the presence of TSP1 antagonist or control peptide and fixation schedule. (B) Staining for DCX and NG2 in ME- and SVZ-NSCs cultures treated with TSP1 antagonist (LSKL) or control peptide (SLLK) (50 μg/mL). (C and D) Quantitative analysis of (C) SVZ-NSCs and (D) ME-NSCs differentiation to DCX+ and NG2+ cells in the presence of TSP1 antagonist (mean ± SD). Scale bar, 50 μm. p ≤ 0.004, ∗∗p ≤ 0.015.
Figure 7
Figure 7
ME-Derived OLs Express MBP in Shi Mice Coronal brain sections processed 3 weeks after injection of GFP-labeled NS into the LV. (A) Images show GFP+ ME-NS (upper panel) or GFP+ SVZ-NS. (B) Images show transplanted GFP+ ME-NSCs in the ME (upper panel) and SVZ (lower panel) expressing MBP (left column) or DCX (middle column). Upper images in the right column show higher magnification of GFP+ MBP+ in the CC. Scale bars, 20 μm and 10 μm (inset). The lower image is an orthogonal view showing localization of MBP with GFP+ ME-NSCs. Scale bar, 10 μm. (C) Images show GFP+ SVZ-NSCs in the CC (upper panel) and adjacent LV (lower panel). Shown are immunostaining for MBP (left column) and DCX (middle column). Upper images in the right column show higher magnification of GFP+ DCX+ in the SVZ. Scale bars, 20 μm and 10 μm (inset). The lower image is orthogonal view showing localization of DCX with GFP+ SVZ-NSCs. Scale bar, 10 μm. (D) Quantitative analysis of GFP+ cells co-express MBP or DCX in Shi mice transplanted with ME-NSCs compared with SVZ-NSCs (n = 5 per group). Scale bars, 50 μm (A–C). p < 0.001.

References

    1. Aharoni R., Arnon R., Eilam R. Neurogenesis and neuroprotection induced by peripheral immunomodulatory treatment of experimental autoimmune encephalomyelitis. J. Neurosci. 2005;25:8217–8228. - PMC - PubMed
    1. Altman J., Das G.D. Autoradiographic and histological evidence of postnatal hippocampal neurogenesis in rats. J. Comp. Neurol. 1965;124:319–335. - PubMed
    1. Alvarez-Buylla A., Seri B., Doetsch F. Identification of neural stem cells in the adult vertebrate brain. Brain Res. Bull. 2002;57:751–758. - PubMed
    1. Armada-Moreira A., Ribeiro F.F., Sebastião A.M., Xapelli S. Neuroinflammatory modulators of oligodendrogenesis. Neuroimmunol. Neuroinflam. 2015;2:263–273.
    1. Bedard A., Cossette M., Levesque M., Parent A. Proliferating cells can differentiate into neurons in the striatum of normal adult monkey. Neurosci. Lett. 2002;328:213–216. - PubMed

LinkOut - more resources