

Subnational mapping of under-5 and neonatal mortality trends in India: the Global Burden of Disease Study 2000-17
- PMID: 32413293
- PMCID: PMC7262604
- DOI: 10.1016/S0140-6736(20)30471-2
Subnational mapping of under-5 and neonatal mortality trends in India: the Global Burden of Disease Study 2000-17
Abstract
Background: India has made substantial progress in improving child survival over the past few decades, but a comprehensive understanding of child mortality trends at disaggregated geographical levels is not available. We present a detailed analysis of subnational trends of child mortality to inform efforts aimed at meeting the India National Health Policy (NHP) and Sustainable Development Goal (SDG) targets for child mortality.
Methods: We assessed the under-5 mortality rate (U5MR) and neonatal mortality rate (NMR) from 2000 to 2017 in 5 × 5 km grids across India, and for the districts and states of India, using all accessible data from various sources including surveys with subnational geographical information. The 31 states and groups of union territories were categorised into three groups using their Socio-demographic Index (SDI) level, calculated as part of the Global Burden of Diseases, Injuries, and Risk Factors Study on the basis of per-capita income, mean education, and total fertility rate in women younger than 25 years. Inequality between districts within the states was assessed using the coefficient of variation. We projected U5MR and NMR for the states and districts up to 2025 and 2030 on the basis of the trends from 2000 to 2017 and compared these projections with the NHP 2025 and SDG 2030 targets for U5MR (23 deaths and 25 deaths per 1000 livebirths, respectively) and NMR (16 deaths and 12 deaths per 1000 livebirths, respectively). We assessed the causes of child death and the contribution of risk factors to child deaths at the state level.
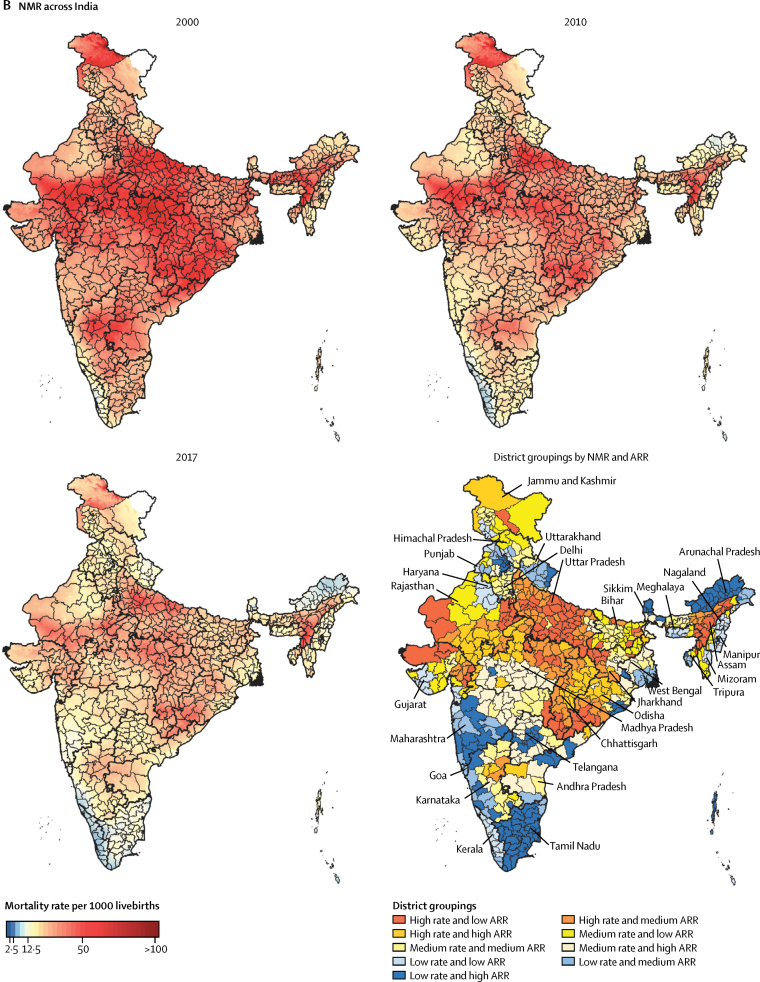
Findings: U5MR in India decreased from 83·1 (95% uncertainty interval [UI] 76·7-90·1) in 2000 to 42·4 (36·5-50·0) per 1000 livebirths in 2017, and NMR from 38·0 (34·2-41·6) to 23·5 (20·1-27·8) per 1000 livebirths. U5MR varied 5·7 times between the states of India and 10·5 times between the 723 districts of India in 2017, whereas NMR varied 4·5 times and 8·0 times, respectively. In the low SDI states, 275 (88%) districts had a U5MR of 40 or more per 1000 livebirths and 291 (93%) districts had an NMR of 20 or more per 1000 livebirths in 2017. The annual rate of change from 2010 to 2017 varied among the districts from a 9·02% (95% UI 6·30-11·63) reduction to no significant change for U5MR and from an 8·05% (95% UI 5·34-10·74) reduction to no significant change for NMR. Inequality between districts within the states increased from 2000 to 2017 in 23 of the 31 states for U5MR and in 24 states for NMR, with the largest increases in Odisha and Assam among the low SDI states. If the trends observed up to 2017 were to continue, India would meet the SDG 2030 U5MR target but not the SDG 2030 NMR target or either of the NHP 2025 targets. To reach the SDG 2030 targets individually, 246 (34%) districts for U5MR and 430 (59%) districts for NMR would need a higher rate of improvement than they had up to 2017. For all major causes of under-5 death in India, the death rate decreased between 2000 and 2017, with the highest decline for infectious diseases, intermediate decline for neonatal disorders, and the smallest decline for congenital birth defects, although the magnitude of decline varied widely between the states. Child and maternal malnutrition was the predominant risk factor, to which 68·2% (65·8-70·7) of under-5 deaths and 83·0% (80·6-85·0) of neonatal deaths in India could be attributed in 2017; 10·8% (9·1-12·4) of under-5 deaths could be attributed to unsafe water and sanitation and 8·8% (7·0-10·3) to air pollution.
Interpretation: India has made gains in child survival, but there are substantial variations between the states in the magnitude and rate of decline in mortality, and even higher variations between the districts of India. Inequality between districts within states has increased for the majority of the states. The district-level trends presented here can provide crucial guidance for targeted efforts needed in India to reduce child mortality to meet the Indian and global child survival targets. District-level mortality trends along with state-level trends in causes of under-5 and neonatal death and the risk factors in this Article provide a comprehensive reference for further planning of child mortality reduction in India.
Funding: Bill & Melinda Gates Foundation; and Indian Council of Medical Research, Department of Health Research, Ministry of Health and Family Welfare, Government of India.
© 2020 World Health Organization; licensee Elsevier. This is an Open Access article published under the CC BY 3.0 IGO license which permits unrestricted use, distribution, and reproduction in any medium, provided the original work is properly cited. In any use of this article, there should be no suggestion that WHO endorses any specific organisation, products, or services. The use of the WHO logo is not permitted. This notice should be preserved along with the article's original URL.
Figures


Comment in
-
Mapping neonatal and under-5 mortality in India.Lancet. 2020 May 23;395(10237):1591-1593. doi: 10.1016/S0140-6736(20)31050-3. Epub 2020 May 12. Lancet. 2020. PMID: 32413292 No abstract available.
References
Publication types
MeSH terms
LinkOut - more resources
Full Text Sources
Miscellaneous
