. 2020 Jun 8;30(11):2092-2103.e5.
doi: 10.1016/j.cub.2020.04.031. Epub 2020 May 14.

Linking Virus Discovery to Immune Responses Visualized during Zebrafish Infections

Affiliations

Linking Virus Discovery to Immune Responses Visualized during Zebrafish Infections

Keir M Balla et al. Curr Biol. .

Abstract

The discovery of new viruses currently outpaces our capacity for experimental examination of infection biology. To better couple virus discovery with immunology, we genetically modified zebrafish to visually report on virus infections. After generating a strain that expresses green fluorescent protein (GFP) under an interferon-stimulated gene promoter, we repeatedly observed transgenic larvae spontaneously expressing GFP days after hatching. RNA sequencing comparisons of co-housed GFP-positive and GFP-negative zebrafish revealed a naturally occurring picornavirus that induced a canonical interferon-mediated response and hundreds of antiviral defense genes not observed following immunostimulatory treatments or experimental infections with other viruses. Among the many genes induced by picornavirus infection was a large set encoding guanosine triphosphatase (GTPase) of immunity-associated proteins (GIMAPs). The GIMAP gene family is massively expanded in fish genomes and may also play a crucial role in antiviral responses in mammals, including humans. We subsequently detected zebrafish picornavirus in publicly available sequencing data from seemingly asymptomatic zebrafish in many research institutes and found that it altered gene expression in a previous study of zebrafish development. Experiments revealed a horizontal mode of virus transmission, highlighting a system for studying the spread of picornavirus infections within and between individuals. Our study describes a naturally occurring picornavirus that elicits strong antiviral responses in zebrafish and provides new strategies for simultaneously discovering viruses and their impact on vertebrate hosts.

Keywords: GIMAP; ISG15; evolution; host-pathogen; immunity; infection; interferon; picornavirus; virus; zebrafish.


Conflict of interest statement

Declaration of Interests The authors declare no competing interests.

Figures
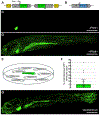
Figure 1.
Figure 1.. Induced and spontaneous GFP expression in transgenic zebrafish that report on interferon signaling.
(A) Transgenic animals were generated with a Tol2 transposon construct bearing the promoter from isg15 fused to the coding sequence for GFP along with a heart-specific (cmlc2) transgenesis marker in the opposite orientation. (B) Illustration of the construct used to drive type I interferon expression in zebrafish, with IFNϕ1 driven by the CMV promoter. (C) An untreated isg15:GFP zebrafish at 8dpf. (D) An IFNϕ1-treated isg15:GFP zebrafish at 8dpf. (E) Illustration of a dish of untreated isg15:GFP zebrafish larvae in which spontaneous GFP expression was observed. (F) Frequency at which spontaneous GFP was observed across independent clutches of isg15:GFP zebrafish. Each dot represents the percent of larvae within a clutch that spontaneously expressed GFP. (G) An untreated isg15:GFP zebrafish that spontaneously expressed GFP at 8dpf. All microscope images are maximum intensity projections of confocal Z-stacks. Scale bars are 500μm, dpf: days post fertilization. See also Video S1; Table S4.
Figure 2.
Figure 2.. A naturally occurring picornavirus sequenced from zebrafish larvae induces extensive antiviral immune responses.
(A) Genome organization of Zebrafish picornavirus (ZfPV). Untranslated regions of the genome are depicted as lines. Schematics above lines represent secondary structures in the UTRs with high base-pairing probabilities based on minimum free energy predictions. The 5’ UTR is predicted to contain an internal ribosome entry site (IRES). Coding regions are depicted as boxes. Dashed lines indicate approximate cleavage positions within the polyprotein. Grey regions lack recognizable protein domain structures and do not share sequence similarity with any other organism. Other colors denote regions that have homology to other picornaviruses. Names in boxes are based on similarity to other picornavirus proteins or are inferred based on the conserved nature of picornavirus genome structures. Numbers below the boxes refer to nucleotide positions. (B) Normalized virus counts in the 8dpf RNA-seq samples that were used to identify ZfPV. Samples are defined based on spontaneous expression of the isg15:GFP reporter. Only GFP-positive animals contained virus reads. (C) Differential gene expression in the same isg15:GFP animals spontaneously expressing GFP compared to GFP-negative animals. Genes that were differentially expressed greater than 2-fold with adjusted p-values less than 0.05 are plotted in red. (D) Gene expression in response to experimentally-administered interferon or Chikungunya virus [29] compared to naturally occurring ZfPV infection. 971 genes were significantly induced in at least one condition at an adjusted p-value of less than 0.05. See also Figures S1–S4; Tables S1–S4.
Figure 3.
Figure 3.. A large family of GIMAP genes induced by ZfPV is a major component of the IFN-inducible immune GTPase superfamily.
(A) Number of GIMAP genes in all vertebrate genomes represented in Ensembl. Blue branches indicate lineages that do not contain any genes with AIG1 domains. All other lineages contain at least one GIMAP gene, with numbers scaled by the intensity of red. The median number of GIMAP genes identified among all species within each vertebrate group is shown next to the group name. (B) Maximum likelihood phylogeny of the GTP-binding domains from GIMAP proteins and the interferon-inducible GTPase superfamily proteins from zebrafish (purple branches) and mouse (green branches). Included are domains from all members of the GTPase of immunity-associated protein (GIMAP), very large inducible GTPase (VLIG), immunity-related GTPase (IRG), Myxoma resistance (MX), and guanylate-binding protein (GBP) subfamilies. The RAS GTPase family (orange) is included as an outgroup, and is not regulated by virus infection or interferon expression. Bootstrap support values are shown at branches leading to each subfamily. Scale is in estimated substitutions per site. (C) Expression of human GIMAP genes in cells treated with interferons compared to untreated controls compiled from the Interferome database [34]. The median fold change was plotted from all combined timepoints post-treatment where data from more than one timepoint was available.
Figure 4.
Figure 4.. ZfPV is widespread in publicly available RNA-seq datasets and alters zebrafish gene expression.
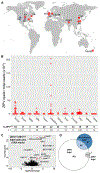
(A) Locations of institutions that have submitted zebrafish RNA-seq projects to the Sequence Read Archive (SRA) that contain reads from ZfPV. Red dots denote locations in which ZfPV reads were identified in the SRA. The blue dot denotes the location of the present study where ZfPV was initially discovered. The purple dot denotes the location of a recent study where ZfPV was also discovered [22]. Names next to the dots refer to the strain of zebrafish that was sequenced. (B) Number of ZfPV reads normalized by library size that were identified in the SRA from adult tissues. Each dot represents a single sequencing sample. The percentage of SRA samples that contained ZfPV reads and the total number of samples that were searched for each tissue are shown beneath the plot. (C) Differential gene expression in 5dpf replicates that contained ZfPV reads compared to replicates that did not from BioProject PRJEB12982. Genes that were differentially expressed greater than 2-fold with adjusted p-values less than 0.05 are plotted in red. (D) Comparison of gene sets induced by ZfPV infection in larvae collected at 8 dpf (white circle, current study), at 5 dpf (grey circle, SRA reads from [38]), or induced by Mycobacterium marinum infection in larvae collected at 5 dpf (blue circle, reads from [39]). Genes were defined as induced if expressed greater than 2-fold over matched control groups with adjusted p-values less than 0.05, and numbers of genes are plotted. See also Figure S5; Table S5.
Figure 5:
Figure 5:. Virus levels are higher in the CG2 strain compared to Tübingen (Tüb) zebrafish.
(A) Coverage of the ZfPV genome by reads derived from all 12 Tüb intestine SRA datasets that had virus reads from Figure 3 compared to reads in the SRA derived from a single CG2 animal. Nucleotide positions and genomic features of ZfPV are shown below the coverage plots. Scale is in number of reads that cover each position. (B) Quantitative real-time PCR quantification of ZfPV levels in tissues dissected from adult Tüb and CG2 animals. Each dot represents the relative amount of virus in one individual. Virus levels are scaled by normalizing to the sample with the lowest non-zero amount of ZfPV. P-values are reported from unpaired t-tests assuming equal variance. See also Tables S4–S5.
Figure 6.
Figure 6.. ZfPV is transmitted horizontally and can be experimentally controlled.
(A) Three strategies for investigating ZfPV infection and transmission in zebrafish larvae. Half a clutch of transgenic isg15:GFP embryos were bleached and compared to conventionally-reared siblings at 8 dpf for GFP expression (blue box). Alternatively, bleached embryos were treated with a 0.45μm filtrate from adult intestinal tissue at 5 dpf and analyzed at 8 dpf (pink box). To assess transmission of ZfPV between larvae, conventionally-reared animals exhibiting spontaneous GFP expression were co-housed with bleached animals at 8 dpf. Additionally, two separate clutches of bleached animals were co-housed as a control (not depicted). GFP expression in the donors and recipients was observed at 15 dpf (grey box). (B) Quantitative real-time PCR quantification of isg15 and ZfPV levels in zebrafish larvae from the experiments depicted above. Each dot represents the relative amount of isg15 gene expression or virus in a pool of 25 larvae. A small fraction of bleached animals occasionally exhibited low levels of GFP induction at the time of collection (see Figure S6) and are plotted separately. isg15 levels are scaled by normalizing to the average level quantified in bleached samples. Virus levels are scaled by normalizing to the sample with the lowest non-zero amount of ZfPV. See also Figure S6; Table S4.

References

    1. Cobian Guemes AG, Youle M, Cantu VA, Felts B, Nulton J, and Rohwer F (2016). Viruses as Winners in the Game of Life. Annu. Rev. Virol 3, 197–214. - PubMed
    1. Suttle CA (2005). Viruses in the sea. Nature 437, 356–361. - PubMed
    1. Li L, Victoria JG, Wang C, Jones M, Fellers GM, Kunz TH, and Delwart E (2010). Bat guano virome: predominance of dietary viruses from insects and plants plus novel mammalian viruses. J. Virol 84, 6955–6965. - PMC - PubMed
    1. Shi M, Lin X-D, Tian J-H, Chen L-J, Chen X, Li C-X, Qin X-C, Li J, Cao J-P, Eden J-S, et al. (2016). Redefining the invertebrate RNA virosphere. Nature 540, 539–543. - PubMed
    1. Shi M, Lin X-D, Chen X, Tian J-H, Chen L-J, Li K, Wang W, Eden J-S, Shen J-J, Liu L, et al. (2018). The evolutionary history of vertebrate RNA viruses. Nature 556, 197–202. - PubMed

Publication types

MeSH terms

Substances

LinkOut - more resources