. 2020 Jun 8;30(11):2116-2130.e6.
doi: 10.1016/j.cub.2020.04.042. Epub 2020 May 14.

Two Distinct Types of Eye-Head Coupling in Freely Moving Mice

Affiliations

Two Distinct Types of Eye-Head Coupling in Freely Moving Mice

Arne F Meyer et al. Curr Biol. .

Abstract

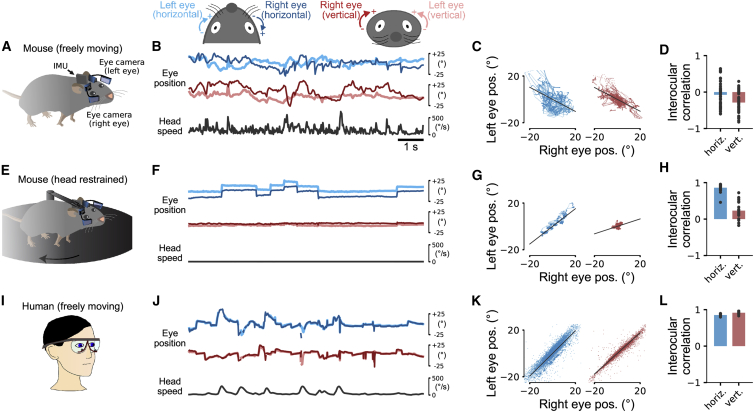
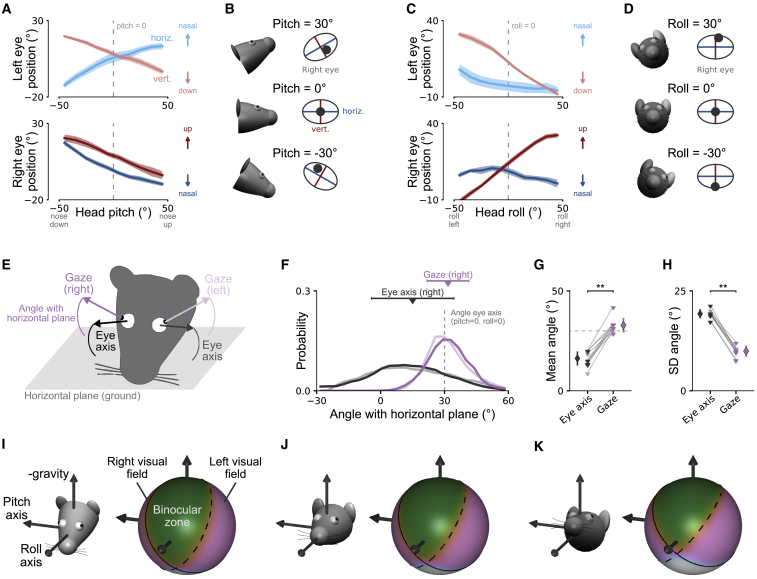
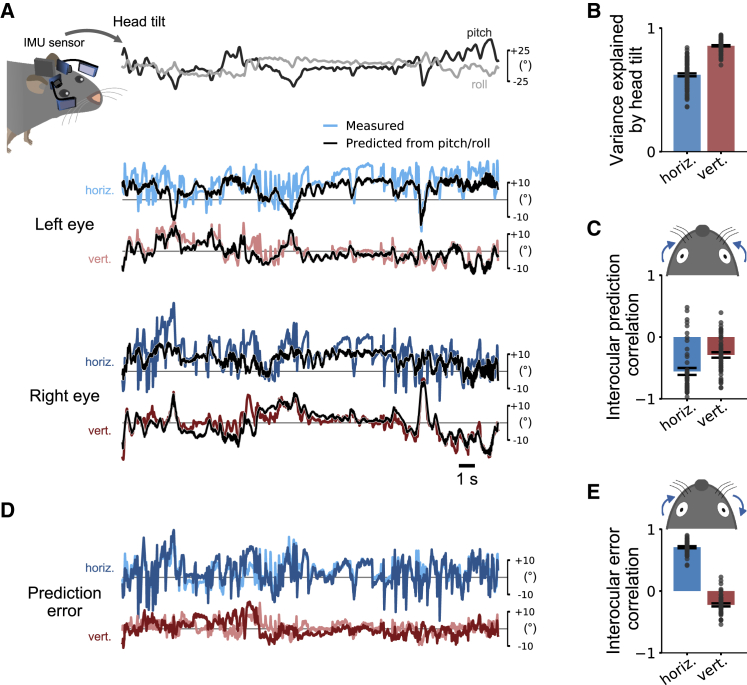
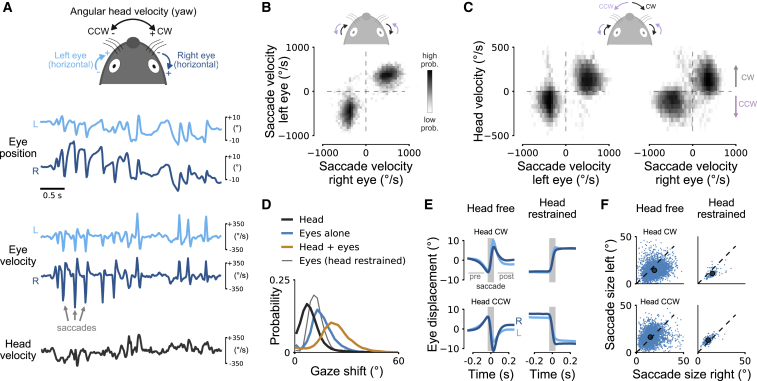
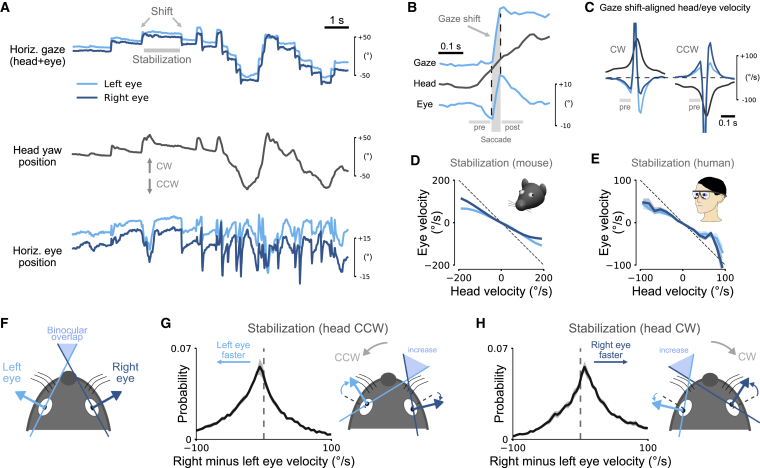
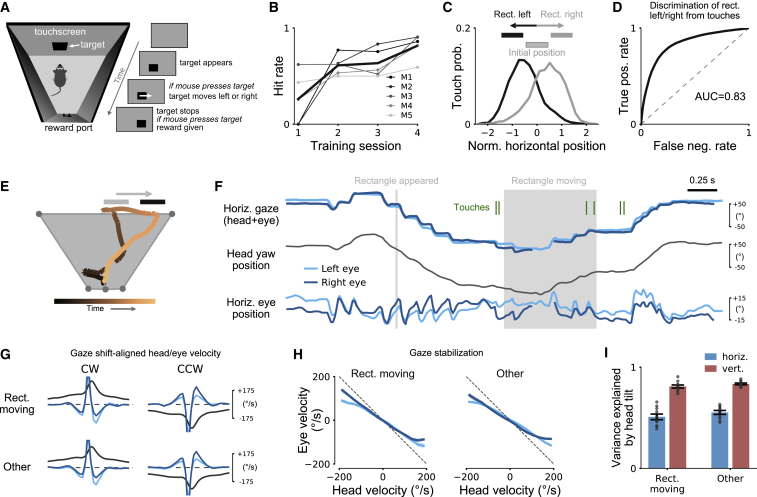
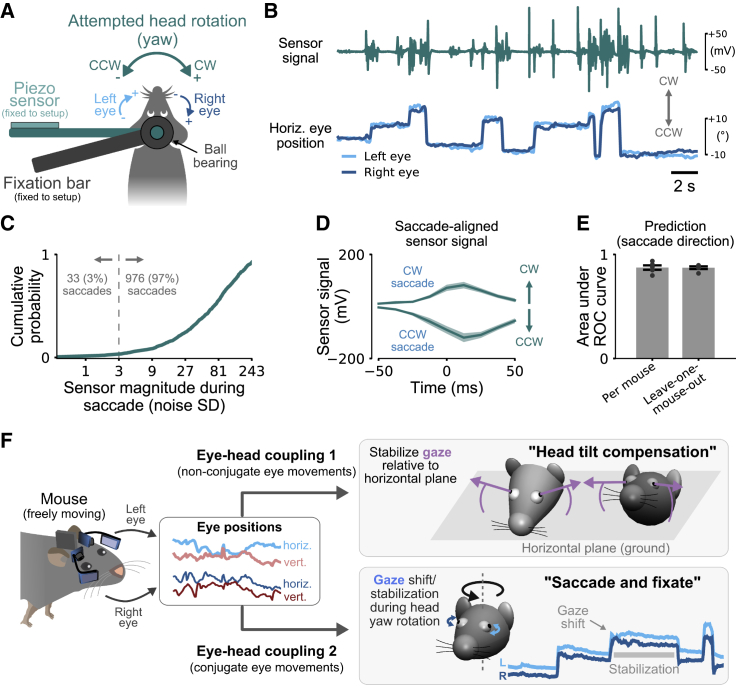
Animals actively interact with their environment to gather sensory information. There is conflicting evidence about how mice use vision to sample their environment. During head restraint, mice make rapid eye movements coupled between the eyes, similar to conjugate saccadic eye movements in humans. However, when mice are free to move their heads, eye movements are more complex and often non-conjugate, with the eyes moving in opposite directions. We combined head and eye tracking in freely moving mice and found both observations are explained by two eye-head coupling types, associated with vestibular mechanisms. The first type comprised non-conjugate eye movements, which compensate for head tilt changes to maintain a similar visual field relative to the horizontal ground plane. The second type of eye movements was conjugate and coupled to head yaw rotation to produce a "saccade and fixate" gaze pattern. During head-initiated saccades, the eyes moved together in the head direction but during subsequent fixation moved in the opposite direction to the head to compensate for head rotation. This saccade and fixate pattern is similar to humans who use eye movements (with or without head movement) to rapidly shift gaze but in mice relies on combined head and eye movements. Both couplings were maintained during social interactions and visually guided object tracking. Even in head-restrained mice, eye movements were invariably associated with attempted head motion. Our results reveal that mice combine head and eye movements to sample their environment and highlight similarities and differences between eye movements in mice and humans.

Keywords: eye movement; gaze; head movement; natural behavior; oculomotor system; pupil; vestibular system; vision.


Conflict of interest statement

Declaration of Interests The authors declare no competing interests.

Figures

Figure 1
Figure 1
Eye Movements in Freely Moving Mice, Head-Restrained Mice, and Humans (A) Tracking eye and head motion in a freely moving mouse. Videos of each eye are recorded using miniature cameras and infrared (IR) mirrors mounted on an implant with a custom holder. Each eye is illuminated by two IR light sources attached to the holder. The mirrors reflect only IR light and allow visible light to pass so that the animal’s vision is not obstructed. Head motion and orientation are measured using an inertial measurement unit (IMU). (B) Eye coordinate systems used in this study (top). A 10-s example segment showing horizontal and vertical position of both eyes and head speed (magnitude of angular head velocity) in an unrestrained, spontaneously behaving mouse (bottom). (C) Horizontal (left) and vertical (right) eye positions for the whole recording of the data in (B) (10 min). Interocular eye positions were negatively correlated (solid black line). (D) On average, interocular correlations were small and negative. Mean ± SEM. (E) Eye tracking in a head-restrained mouse on a running disk using the same technique as in (A). (F–H) The same as in (B)–(D) but for a head-restrained mouse. In contrast to the freely moving condition, eye movements mostly occurred in the horizontal direction and were tightly coupled between the eyes. (I) Tracking eye and head movement in freely moving humans, using goggles with integrated eye-tracking cameras and IR illumination. (J–L) The same as in (B)–(D) but for humans walking through the environment. Interocular correlations between the two eyes in humans show strong coupling between horizontal and vertical eye positions. Note that the lines in (J) for left and right eye positions are closely overlapping. Timescale in (F) and (J) is the same as (B). See also Video S1.
Figure 2
Figure 2
Head-Tilt-Related Changes in Eye Position Stabilize Gaze Relative to the Horizontal Plane in Freely Moving Mice (A) Horizontal (blue lines) and vertical eye position (red lines) as a function of head pitch for the left (top) and right eye (bottom) for freely moving mice. Plots show means ± SEM across 5 mice. Arrows indicate directions of eye position change in the eye coordinate system. Dashed vertical line shows pitch = 0°. Same data as in Figure 1D. (B) Illustration of systematic dependence of horizontal and vertical eye position on head pitch for different pitch values. For illustration, intersection of horizontal and vertical eye axes aligned with average eye position for pitch = 0° (dashed line in A). (C and D) The same as in (A) and (B) but as a function of head roll. (E) Illustration of eye axes fixed in a head-centered reference frame (black arrow) and gaze axes (center of pupil rotating in head; violet arrow) for left and right eyes. Angles of axes are relative to horizontal plane (ground; gray area). (F) Distributions of angles of eye axes (black/gray lines) and gaze axes (violet lines) with horizontal plane for one example mouse. Negative angles indicate axis pointing downward (to the horizontal plane), whereas positive angles indicate upward pointing axis. For reference, angle of eye axis for pitch = 0° and roll = 0° is shown (dashed gray line). Triangles and bars indicate circular mean and standard deviation of distributions, respectively. Same color scheme as in (E). (G) Circular mean angles for left and right eye in 5 mice. Eye axis angle is as shown in (F) (dashed gray line). Same color scheme as in (E). Wilcoxon signed-rank test, **p < 0.01. (H) Circular standard deviation of angles for the same data. Diamonds represent mean and standard deviation across mice (left and right eye). Same data as in (A) and (C). (I) Visual field coverage for negative head pitch (−45° ≤ pitch ≤ −15°) for the example mouse in (F). Data are shown in a laboratory reference frame with average head pitch indicated by mouse head (relative to horizontal ground plane; left). Solid and dashed black lines indicate iso-contours (probability of part of visual field in monocular field = 0.5) for the left and right visual field, respectively. Green area, binocular zone where both monocular visual fields overlap; violet areas, monocular visual fields. (J) The same as in (I) but for approximately level head (−15° ≤ pitch ≤ +15°). (K) The same as in (I) but for upward pitch (+15° ≤ pitch ≤ +45°). See also Figure S1 and Video S2.
Figure 3
Figure 3
Horizontal Eye Movements Not Explained by Head Tilt Are Conjugate across the Two Eyes (A) Top: head tilt was measured using the IMU sensor attached to the animal’s head. Eye positions were measured using the head-mounted camera system. Nonlinear regression models were used to predict horizontal and vertical eye positions from head pitch and roll for each eye. Bottom: measured (colored lines) and predicted (black lines) horizontal and vertical eye positions for both eyes. (B) Cross-validated explained variance along the horizontal (horiz.) and vertical (vert.) eye axes (n = 47 recordings from 5 mice, 10 min each). Head tilt explained 86% variance in vertical but only 62% in horizontal eye position. Recordings for each eye axis pooled across eyes and mice. Mean ± SEM. (C) Interocular correlation of the eye movements that were predictable by head pitch and roll (i.e., the predictions of independent models for the two eyes as shown in A). Strong negative correlation for horizontal eye movements indicates convergence and divergence across eyes. Blue arrows show horizontal convergence. Mean ± SEM. Same data as in (B). (D) Prediction errors for the eye position traces in (A) showed strong co-fluctuations in horizontal, but not vertical, eye direction. (E) Interocular correlation of the eye movements that were not predictable by head pitch and roll (i.e., the prediction errors of independent models for the two eyes as shown in D). There was a strong positive correlation for horizontal eye movements, suggesting that conjugate eye movements occurred during head-free behavior and were not explained by head tilt. Arrows show coupling for left eye rotating in nasal direction. Mean ± SEM. Same data as in (B).
Figure 4
Figure 4
Rapid Saccadic Conjugate Horizontal Eye Movements in Freely Moving Mice (A) Schema for representing horizontal head and eye rotation axes (top). Examples of eye position (top traces), angular eye velocity (middle), and angular head velocity (bottom) in a freely moving mouse. High-velocity peaks during saccades coordinated between the two eyes are visible. Left eye is in light blue; right eye is in dark blue. Positive and negative head velocity indicates clockwise (CW) and counterclockwise (CCW) head rotation, respectively. (B) Log-scaled joint distribution of horizontal saccade velocity for the left and right eyes. 94% of saccades had the same sign for both eyes (10,331 saccades detected in both eyes). (C) Log-scaled joint distribution of horizontal saccade velocity for the left and right eyes and angular head velocity. Most saccades occurred during head rotations with eye rotations in the same direction as the head; same data as in Figure 1B. (D) Gaze shift magnitudes during saccades in freely moving mice: eyes and head together in orange, eyes alone in blue, head alone in dark gray, and, for comparison, gaze shift in head-restrained mice in thin gray line. (E) Average saccade profiles in freely moving (left) and head-restrained (right) mice. Saccades for CW (top) and CCW (bottom) head rotations (shaded gray area) were preceded and followed by a counter eye movement (“pre” and “post”) in freely moving mice, but not in head-restrained mice. Means ± SEM (smaller than line width). (F) Saccade sizes for CW and CCW head rotations in head-free (left) mice. On average, saccades were larger for temporal-to-nasal than for nasal-to-temporal saccades. Dots indicate average saccade sizes. Saccades in head-restrained mice for comparison (right) with same asymmetry in average saccade sizes as in head-free mice. See also Figure S2.
Figure 5
Figure 5
Head and Eyes Contribute to a “Saccade and Fixate” Gaze Pattern (A) Horizontal positions of the two eyes (bottom), angular head yaw position (middle), and gaze (head + eye, top) during 12-s segment in a freely moving mouse selected to highlight the saccade and fixate pattern. Small-amplitude, jerky eye movements and large-amplitude, smooth head movements combine to produce the saccade and fixate gaze pattern. (B) Magnified traces for a single gaze shift from the recording in (A). Head movement is accompanied by an initial counter-rotation of the eye before the gaze saccade. Vertical and horizontal gray bars indicate saccade and pre/post periods, respectively. (C) Gaze shift-aligned head and eye velocity traces for clockwise (CW, left) and counter-clockwise (CCW, right) gaze shifts. 44,396 gaze shifts from 5 mice (22,226 CW and 22,170 CCW); mean ± SEM (smaller than line width). (D) Relation between horizontal eye and head velocity during stabilization periods (example period marked in A). Eye movements between saccadic gaze shifts counteract head rotations; mean ± SEM (smaller than line width). Dashed line indicates complete offsetting counter-rotation; same data as in Figure 1C. (E) The same as in (D) but for humans wearing head-mounted eye goggles. (F) Illustration of monocular left and right visual field (about 180°) and horizontal binocular overlap. (G) Left: distribution of the difference in right and left eye velocity during stabilizing eye movements (CCW head rotation); mean ± SEM for 5 mice. Right: illustration of consequence of asymmetric nasal-to-temporal and temporal-to-nasal eye velocity on binocular overlap (increase relative to setting shown in F). At the same time, gaze stabilization is enhanced for the left eye during leftward turn. (H) The same as in (G) but for CW head rotations. Enhanced gaze stabilization for the right eye for mouse turning to the right. See also Figure S3.
Figure 6
Figure 6
Both Types of Eye-Head Coupling Are Preserved during Visually Guided Behaviors (A) Visually guided tracking task. Mice pressed a black rectangle that appeared on an IR touchscreen. The rectangle then moved randomly for different distances to the left or right, and the mouse had to press the rectangle again once the rectangle stopped moving to get a reward at the other end of the box. Mice were first pretrained to press rectangles appearing on the screen with a single touch and then to press the rectangle for a second time after it had shifted to a new position. (B) Learning of the final version of the task in which the initial and final positions of the rectangle were non-overlapping. Data show average hit rates for 5 mice (thin lines) and average hit rate (fraction correct) across mice (thick black line). 211.1 ± 198.9 trials per session. (C) Distribution of touchscreen touches for rectangle moving left (black line) or right (gray line). Touch positions are normalized by rectangle position and width. Extent of rectangles is shown above. Data are for 4,221 trials from 5 mice. (D) Receiver operating characteristics curve for discrimination of left/right rectangle movement based on touchscreen touches for the data shown in (C). Area under curve was 0.83. (E) Example trial of mouse performing the task. Overhead view of head position with color indicating trial time as in color bar below. Gray and black rectangles show initial and final rectangle positions, respectively. (F) Gaze (top), head yaw (middle), and eye (bottom) positions for the trial in (E). Rectangle appearance and movement period are marked by gray areas. Green lines indicate time points when the mouse is touching the rectangle. (G) Eye-head coupling during gaze shifts was preserved during rectangle tracking compared to a baseline condition (“Other”; without visual stimulus). Means ± SEM (smaller than line width). (H) Relation between head and eye velocity during gaze-stabilization periods. Means ± SEM (typically smaller than line width). (I) Cross-validated explained variance (mean ± SEM) of models trained on head pitch/roll for the baseline condition (“Other”; without visual stimulus). See also Figure S4 and Videos S3 and S4.
Figure 7
Figure 7
Saccades in Head-Restrained Mice Occur during Head Rotation Attempts (A) Measurement of attempted head rotations in a head-restrained mouse. A fixation bar (dark gray) is attached to the animal’s head post via a ball bearing. A second bar connected to animal’s head post is free to rotate about the yaw axis. The end of the bar is attached to a non-elastic piezoelectric sensor that measures changes in exerted head motion (in the absence of actual head rotation). The animal’s body was restrained by two plastic side plates and a cover above the animal (not shown). (B) Sensor output signal (top) and simultaneously measured horizontal eye positions of both eyes (bottom). Gray arrows indicate CW and CCW directions of sensor signal (head) and eye movements. (C) Sensor signal magnitude during saccades normalized by the standard deviation (SD) of the sensor noise (measured without mouse attached). For 97% of all 1,009 saccades in five mice, the sensor magnitude was larger than 3 noise standard deviations (dashed gray line). (D) Saccade-aligned sensor trace for CW and CCW saccade directions. Average sensor deflections were in the same direction as the saccades. Mean ± SEM. Same data as in (C). (E) Cross-validated prediction performance of saccade directions based on sensor data. Predictions were performed by training a linear classifier using the sensor signals around the saccades (−50 ms to +50 ms; 9 equally spaced time points). “Per mouse,” 5-fold cross-validation for each mouse separately; “Leave-one-mouse-out,” saccade direction of a given mouse is predicted using a classifier trained on the data of the other mice. Mean ± SEM. Same data as in (C). (F) Schematic summary of the two types of eye-head coupling identified in this study in freely moving mice. See also Figure S5, Table S1, and Video S5.

Comment in

References

    1. Kleinfeld D., Ahissar E., Diamond M.E. Active sensation: insights from the rodent vibrissa sensorimotor system. Curr. Opin. Neurobiol. 2006;16:435–444. - PubMed
    1. Gottlieb J., Oudeyer P.Y. Towards a neuroscience of active sampling and curiosity. Nat. Rev. Neurosci. 2018;19:758–770. - PubMed
    1. Sağlam M., Lehnen N., Glasauer S. Optimal control of natural eye-head movements minimizes the impact of noise. J. Neurosci. 2011;31:16185–16193. - PMC - PubMed
    1. Land M., Mennie N., Rusted J. The roles of vision and eye movements in the control of activities of daily living. Perception. 1999;28:1311–1328. - PubMed
    1. Hayhoe M. Vision using routines: a functional account of vision. Vis. Cogn. 2000;7:43–64.

Publication types

LinkOut - more resources