. 2020 Jun 11;181(6):1410-1422.e27.
doi: 10.1016/j.cell.2020.04.048. Epub 2020 May 14.

An Engineered CRISPR-Cas9 Mouse Line for Simultaneous Readout of Lineage Histories and Gene Expression Profiles in Single Cells

Affiliations

An Engineered CRISPR-Cas9 Mouse Line for Simultaneous Readout of Lineage Histories and Gene Expression Profiles in Single Cells

Sarah Bowling et al. Cell. .

Erratum in

Abstract

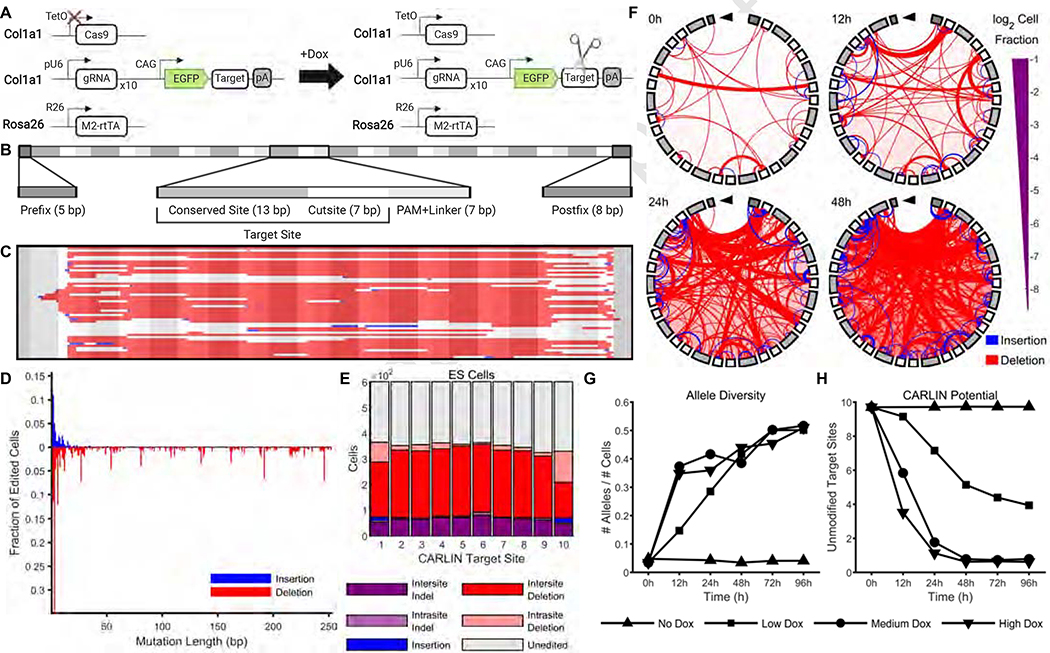
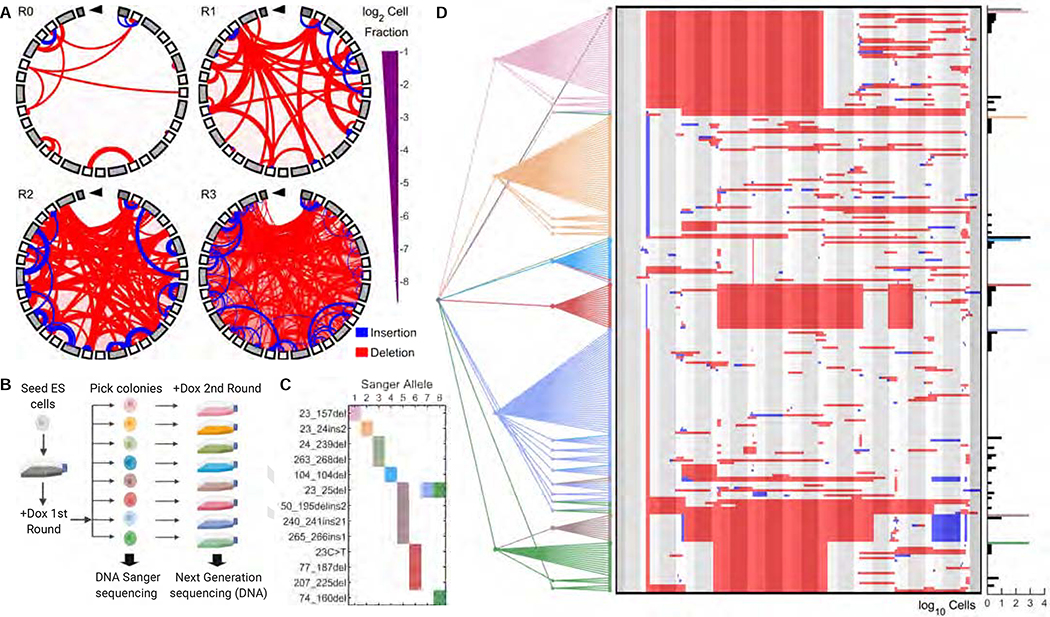
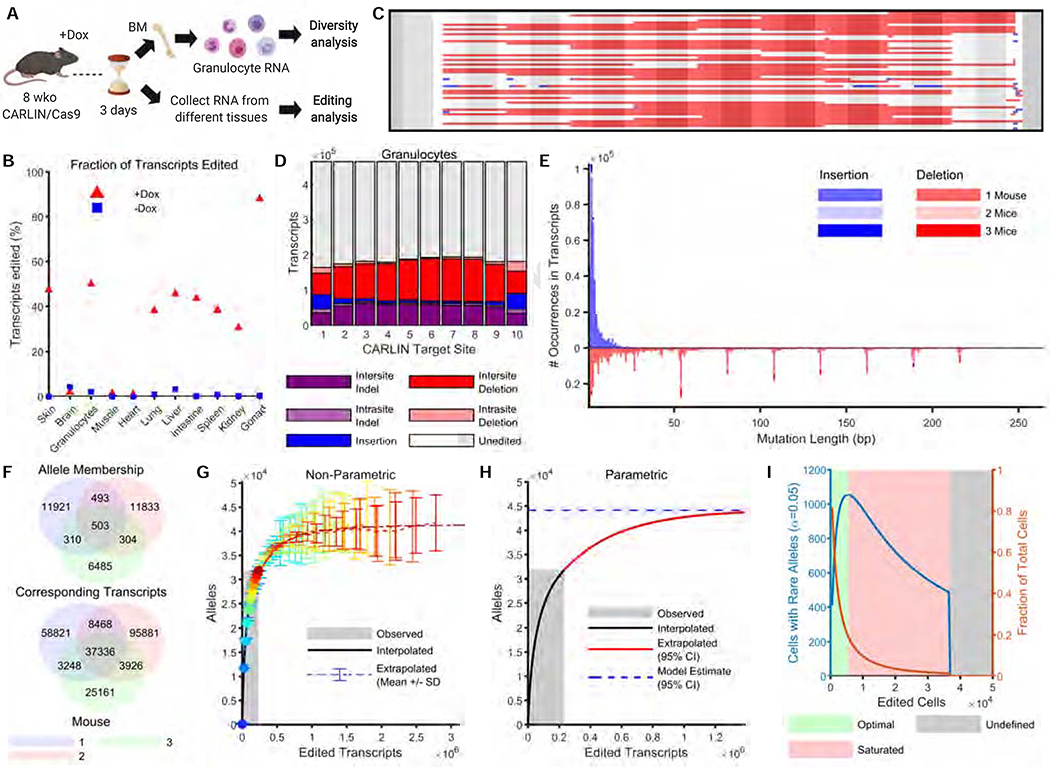
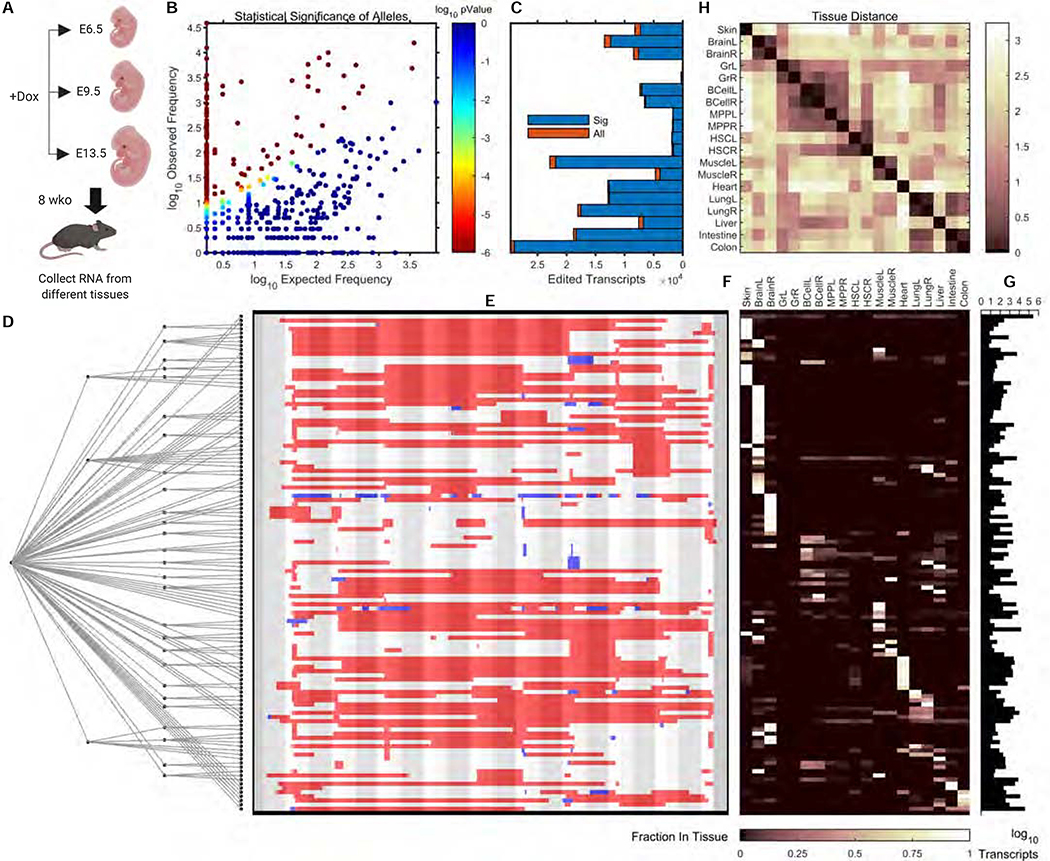
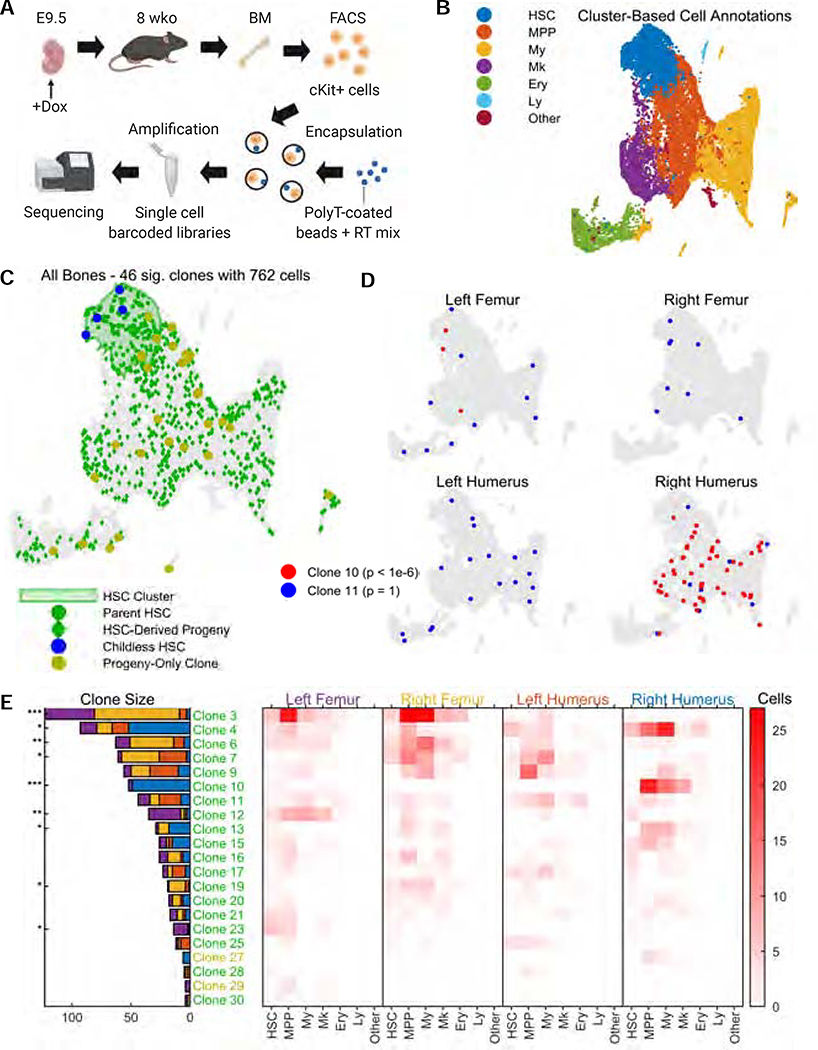
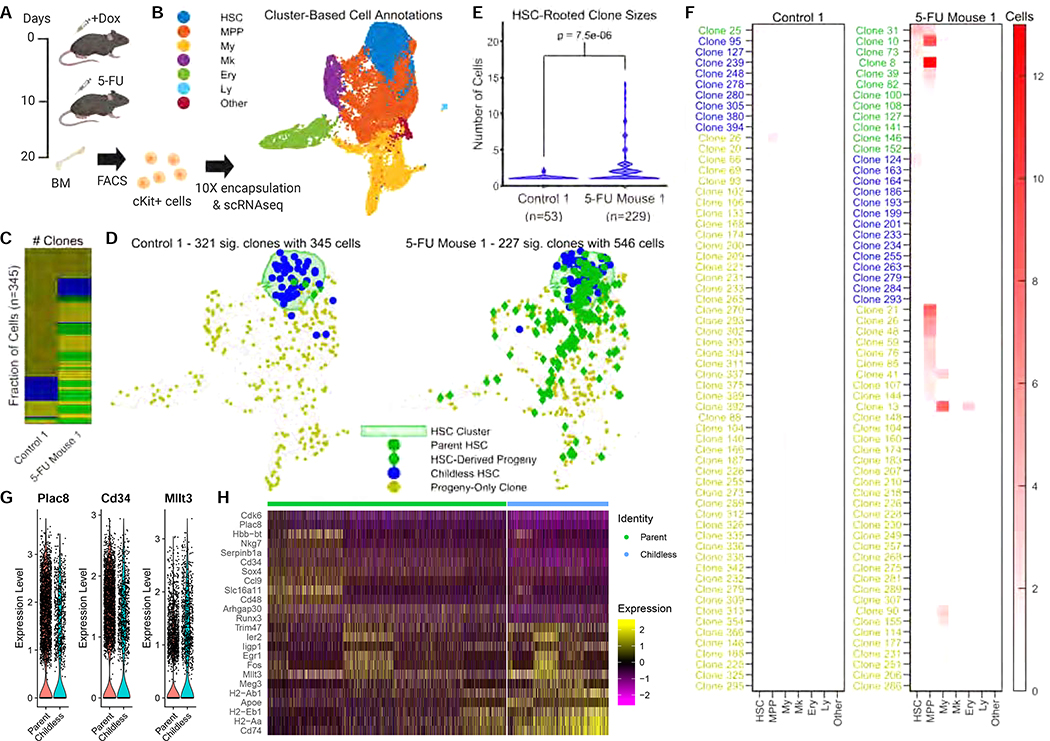
Tracing the lineage history of cells is key to answering diverse and fundamental questions in biology. Coupling of cell ancestry information with other molecular readouts represents an important goal in the field. Here, we describe the CRISPR array repair lineage tracing (CARLIN) mouse line and corresponding analysis tools that can be used to simultaneously interrogate the lineage and transcriptomic information of single cells in vivo. This model exploits CRISPR technology to generate up to 44,000 transcribed barcodes in an inducible fashion at any point during development or adulthood, is compatible with sequential barcoding, and is fully genetically defined. We have used CARLIN to identify intrinsic biases in the activity of fetal liver hematopoietic stem cell (HSC) clones and to uncover a previously unappreciated clonal bottleneck in the response of HSCs to injury. CARLIN also allows the unbiased identification of transcriptional signatures associated with HSC activity without cell sorting.

Keywords: barcoding; hematopoiesis; lineage tracing; single cell; stem cells.


Conflict of interest statement

Declaration of Interests The authors declare no competing interests.

Figures

Figure 1:
Figure 1:. A high diversity of edits are generated by CARLIN in embryonic stem cells
A. Schematic of CARLIN system. Guides RNAs, target sites and inducible Cas9 components are contained within the Col1a1 locus. The expression of each of the 10 gRNAs is driven by a separate U6 promoter (pU6). The CARLIN array sits in the 3’UTR of GFP and consists of 10 sites that perfectly match the gRNAs. The doxycycline (Dox) reverse tetracycline-controlled transactivator (rtTA) is contained within the Rosa26 locus. Schematic created with BioRender. B. For computational purposes, we consider the CARLIN array as a series of motifs. We divide each target site into a 13bp conserved site (that lies outside the expected range of Cas9 editing) and 7bp cutsite. Consecutive target sites are interleaved by a 3bp protospacer adjacent motif (PAM) and 4bp linker sequence. There is a 5bp prefix motif upstream of the first target site and an 8bp postfix motif downstream of the last target site. C. The 50 most common edited CARLIN alleles generated in CARLIN mouse embryonic stem (ES) cells following 96h induction with 0.04 μg/mL Dox. Each row represents a different allele. Deletions are marked in red. Insertions are shown in blue with the left endpoint indicating the start of the insertion; the length of the strip matches the length of the insertion (except when occluded by a subsequent deletion). A grayscale mask as in (B) is overlaid to demarcate the CARLIN motifs. D. The fraction of edited ES cells, following 96h induction with 0.04 μg/mL of Dox, in which insertions and deletions of various lengths are observed. E. Distribution of mutation types across different target sites in ES cells following 96h induction with 0.04 μg/mL of Dox. F. Chord plots of CARLIN alleles before induction and at 12h, 24h, and 48h after induction with 0.04 μg/mL of Dox. The shading of the iris (ccw. from top) corresponds to the shading of the motifs in Figure 1B (from left to right). The thickness of an interior line is proportional to the number of cells with that mutation. The endpoints of a red line indicate the starting and ending bps of a deletion. The upstream endpoint of a blue line indicates the insertion site, and the downstream endpoint is offset by an amount equal to the insertion length. G. Time-course of the total number of distinct alleles detected normalized by the total number of cells, and (H) average CARLIN potential (Methods) across cells in the absence of Dox and after induction with 0.04 μg/mL (low), 0.2 μg/mL (medium) and 1 μg/mL (high) of Dox.
Figure 2:
Figure 2:. Multiple pulses of doxycycline can consecutively label lineages and enable phylogenetic tree reconstruction in embryonic stem cells
A. Chord plots of CARLIN alleles in the absence of doxycycline (Dox) and after one, two or three 6h pulses of Dox (R0–3, respectively). Color scheme as in Figure 1F. B. Following one 6h round of Dox induction, cells were seeded at single-cell density and 8 colonies were picked for further outgrowth and Sanger sequencing. Following a second round of Dox, DNA from cells was collected and sequenced by Next Generation Sequencing (NGS). Schematic created with BioRender. C. Mutations called in each of the 8 colonies from the CARLIN pipeline applied to the Sanger sequences. Colonies are colored according to the schematic in (B). Colonies 5, 7 and 8 share a common mutation. D. (Left panel) The consensus tree, accounting for 95% of cells, obtained from 10,000 lineage reconstruction simulations applied to alleles pooled from all libraries (Methods; Supplementary Figure 4C). The color of a node and its branch to a parent corresponds to the NGS library in which the allele was observed. Leaves that connect to internal nodes of a different color correspond to false positives. (Centre panel) Sequence of each CARLIN allele visualized as in Figure 1C. (Right panel) Histogram of the number of cells in which each allele was detected. Colored bars correspond to NGS sequences which match a Sanger sequence.
Figure 3:
Figure 3:. Inducible CARLIN editing in vivo
A. 8-week old mice were induced with doxycycline (Dox) for one week. RNA from granulocytes and other tissues were collected following 3 days chase. Schematic created with BioRender. B. Fraction of transcripts edited across tissues in the presence and absence of Dox. C. The 50 most common edited CARLIN alleles observed in granulocytes, visualized as in Figure 1C. D. Distribution of mutation types across different target sites in granulocytes comprising the allele bank (Methods). E. Histogram of insertion and deletion lengths found in the allele bank shaded according to presence across mice. F. Venn diagram showing number of edited alleles (and the corresponding number of edited transcripts) in the bank shared across the three induced mice. G. Non-parametric and (H) parametric extrapolation of the total allele diversity achievable by the CARLIN system as a function of the number of edited transcripts observed (Methods). The system is estimated to saturate at an allele diversity of 44,000 ± 400. The area shaded in grey indicates the number of observed transcripts used to construct the bank. I. Number of cells expected to harbor rare alleles (that are unlikely to occur independently in multiple cells) as a function of the number of cells edited. When the number of cells is small with respect to the CARLIN diversity (shaded in green), many cells harbor rare alleles. As the number of edited cells increases (shaded in red), the probability that a given allele marks only one cell decreases (orange curve), so that the number of cells that are uniquely marked with a CARLIN allele decreases (blue curve). In the regime shaded in grey, no cell can confidently be said to be uniquely marked by an allele (Methods).
Figure 4:
Figure 4:. Lineage reconstruction in vivo through multiple pulses of doxycycline
A. Pregnant dams were induced with doxycycline at E6.5, E9.5 and E13.5. At 8 weeks, RNA from different tissues was collected and sequenced by Next Generation Sequencing (NGS). Schematic created with BioRender. B. Scatter plot of observed allele frequencies vs. expected frequencies obtained by querying the bank. Alleles whose statistical significance did not survive a FDR of 0.05 were discarded (Methods). C. Number of edited transcripts found in different tissues after running the CARLIN pipeline (All), and after screening for significant alleles (Sig) as described in (B). D. The consensus tree which accounts for 95% of edited transcripts, obtained from 10,000 simulations, using the same algorithm as in Figure 2D (Supplementary Figure 4D; Methods). E. Allele sequences called from NGS corresponding to the leaf nodes, visualized as in Figure 1C. F. Distribution of number of transcripts corresponding to each allele across tissues (row normalized to 1). G. Histogram of total transcript counts across all tissues for each allele. H. Pairwise similarity matrix of tissues computed across alleles of the consensus tree (Methods).
Figure 5:
Figure 5:. Clonal tracing of blood progenitors to adulthood
A. CARLIN mice were labelled at E9.5. At 8 weeks, bone marrow cells were collected, sorted, and encapsulated for single-cell RNA sequencing. Schematic created with BioRender. B. UMAP representation of pooled transcriptome data from the bone marrow of 4 separate bones. See Supplementary Figure 5D,E for the breakdown of clusters and markers used for annotation. HSC, hematopoietic stem cell; MPP, multipotent progenitor cell; My, myeloid progenitor cells; Ery, erythrocyte; Ly, lymphoid cell. C. Statistically significant CARLIN alleles (FDR = 0.05; Methods) across all bones combined, overlaid onto the UMAP plot from (B). The green shaded area corresponds to the HSC cluster in the transcriptome, shown in (B). We are able to directly map the ancestry between differentiated cells (green diamonds) and HSCs (green circles) which share the same set of alleles. HSCs without children are shown in blue, and differentiated cells that do not share their allele with HSCs are shown in yellow. D. CARLIN clones overlaid onto the transcriptome of individual bones; a non-biased clone (blue) and a biased clone (red) are shown with the Bonferroni-corrected p-values for bone bias (Methods). E. (Left) Bar graph indicating the prevalence of each statistically significant allele across the 4 bones, with the Bonferroni-corrected p-value for bone bias marked as *p<0.05; **p<10−3; ***p<10−6. (Right) Heatmap indicating occurrence frequency of alleles across bones and cell types. Alleles found in fewer than 4 cells are not displayed. The clone labels follow the color scheme in (C).
Figure 6:
Figure 6:. Clonal dynamics of adult hematopoiesis following perturbation
A. 8-week old CARLIN mice were labelled with doxycycline and injected with 5-FU after 10 days. After another 10 days, bone marrow cells were sorted and encapsulated for single-cell RNA sequencing. Schematic created with BioRender. B. UMAP representation of pooled transcriptome data from control and 5-FU treated mice. See Supplementary Figure 6C,D for the breakdown of clusters and markers used for annotation. Cluster labels as in Figure 5B. C. Number of statistically significant clones in the first control and 5-FU treated mouse (FDR=0.05; Methods) after downsampling the 5-FU treated mouse to have the same number of cells marked by statistically significant alleles as the control mouse. The control mouse has many small clones. The colors correspond to the legend for (D) below with blue clones containing only HSCs, yellow clones containing only non-HSCs, and green clones containing both. D. Statistically significant CARLIN alleles (as defined in C) overlaid onto the transcriptome indicating childless HSCs (blue), parent HSCs (green circles), non-HSC cells in an HSC-rooted clone (green diamonds) and non-HSC cells not in an HSC-rooted clone (yellow). The green shaded area corresponds to the HSC cluster in the transcriptome shown in (B). E. Violin plot showing the distribution of the number of cells in statistically significant HSC-rooted clones (as defined in C) in the first control and 5-FU treated mouse (the green and blue markers in D). The total number of cells in statistically significant HSC-rooted clones is shown in brackets under the sample label. F. Heatmap indicating occurrence frequency of statistically significant alleles (as defined in C) across different cell types in the first control and 5-FU animals. The clone labels are colored according to the scheme in (D). The number of clones has been downsampled for both animals. G. Violin plots of log-normalized expression levels of selected genes differentially expressed between the parent and childless HSC cluster group (as defined in Supplementary Figure 6C). H. Heatmap of the z-score of log-normalized expression levels of genes most differentially expressed between the parent and childless HSC cluster group (as defined in Supplementary Figure 6C).

Comment in

  • A mouse with history.
    Burgess DJ. Burgess DJ. Nat Rev Genet. 2020 Jul;21(7):388. doi: 10.1038/s41576-020-0252-x. Nat Rev Genet. 2020. PMID: 32457510 No abstract available.

References

    1. Alemany A, Florescu M, Baron CS, Peterson-Maduro J and Van Oudenaarden A (2018). Whole-organism clone tracing using single-cell sequencing. Nature 556, 108–112. - PubMed
    1. Aubrey BJ, Kelly GL, Kueh AJ, Brennan MS, O’Connor L, Milla L, Wilcox S, Tai L, Strasser A, and Herold MJ (2015). An inducible lentiviral guide RNA platform enables the identification of tumor-essential genes and tumor-promoting mutations in vivo. Cell Rep 10, 1422–1432 - PubMed
    1. Balakier H and Pedersen RA (1982). Allocation of cells to inner cell mass and trophectoderm lineages in preimplantation mouse embryos. Dev. Biol. 90, 352–362. - PubMed
    1. Beard C, Hochedlinger K, Plath K, Wutz A and Jaenisch R (2006). Efficient method to generate single-copy transgenic mice by site-specific integration in embryonic stem cells. Genesis 44, 23–28. - PubMed
    1. Buchholz F, Angrand PO, and Stewart AF (1998). Improved properties of FLP recombinase evolved by cycling mutagenesis. Nat Biotechnol 16, 657–662. - PubMed

Publication types