. 2020 Jul 7;32(1):100-116.e4.
doi: 10.1016/j.cmet.2020.04.018. Epub 2020 May 14.

Untangling Determinants of Enhanced Health and Lifespan through a Multi-omics Approach in Mice

Affiliations

Untangling Determinants of Enhanced Health and Lifespan through a Multi-omics Approach in Mice

Miguel A Aon et al. Cell Metab. .

Abstract

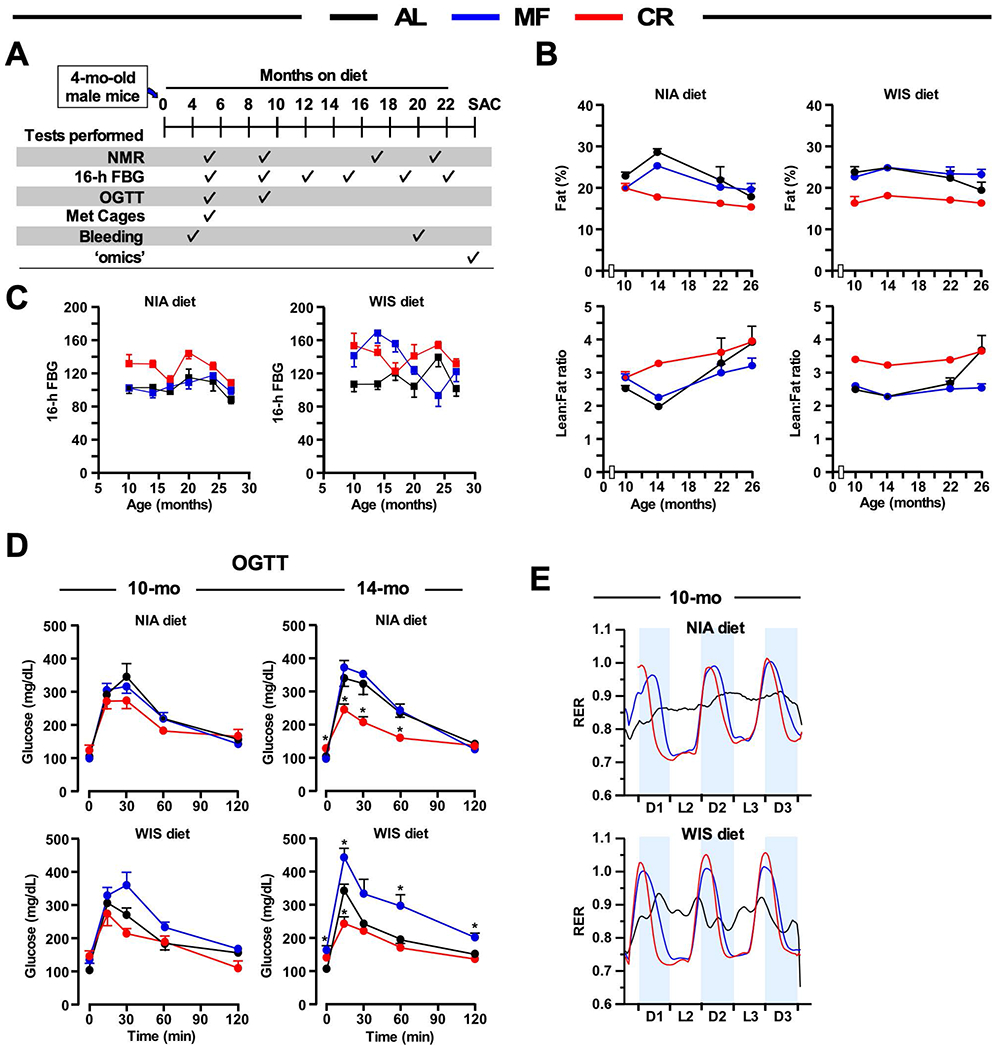
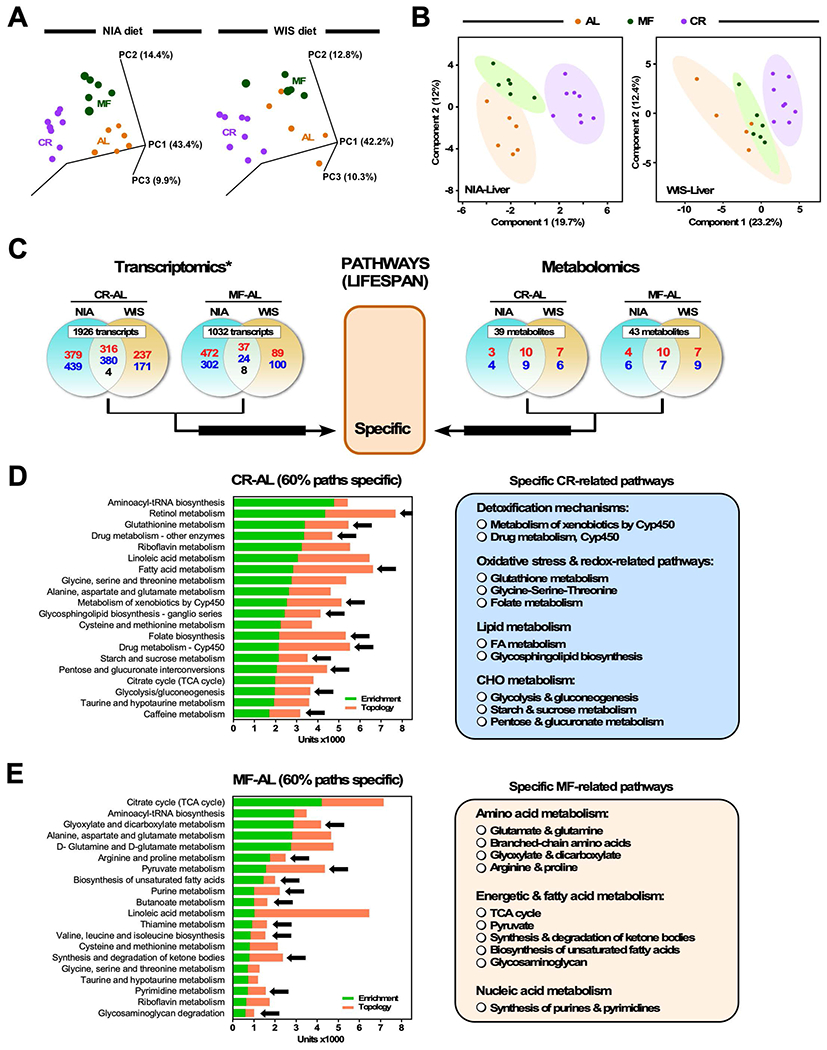
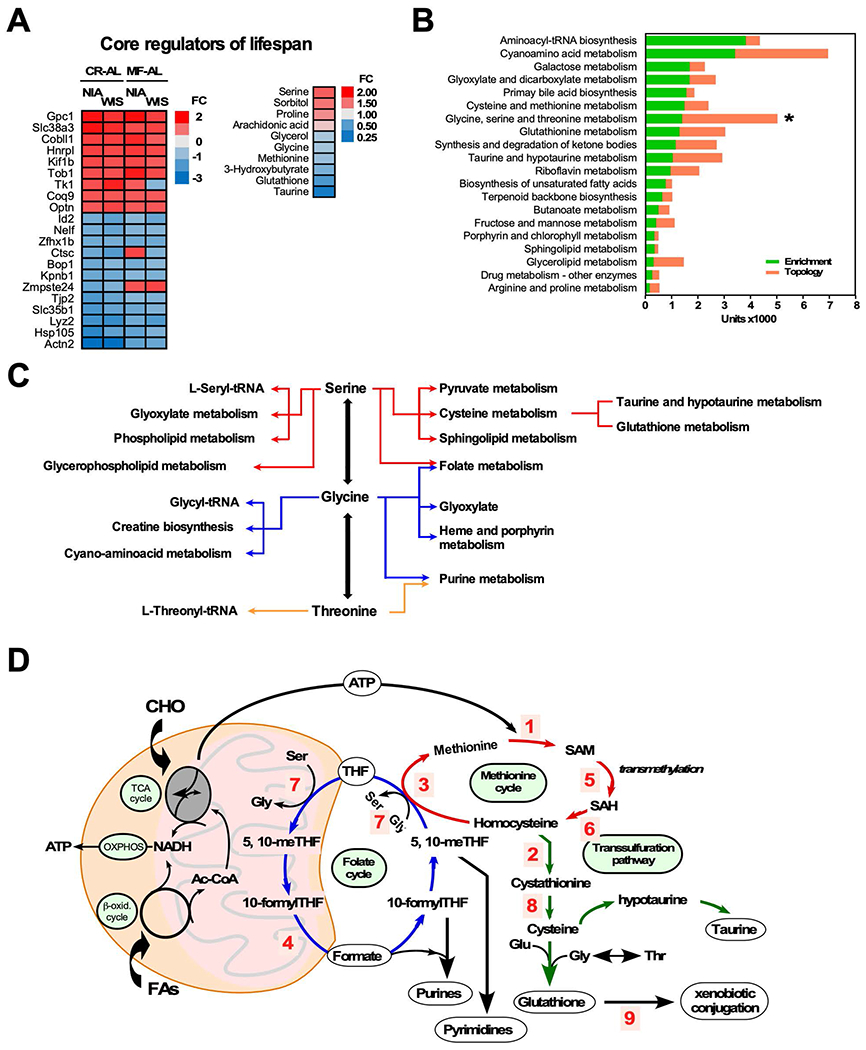
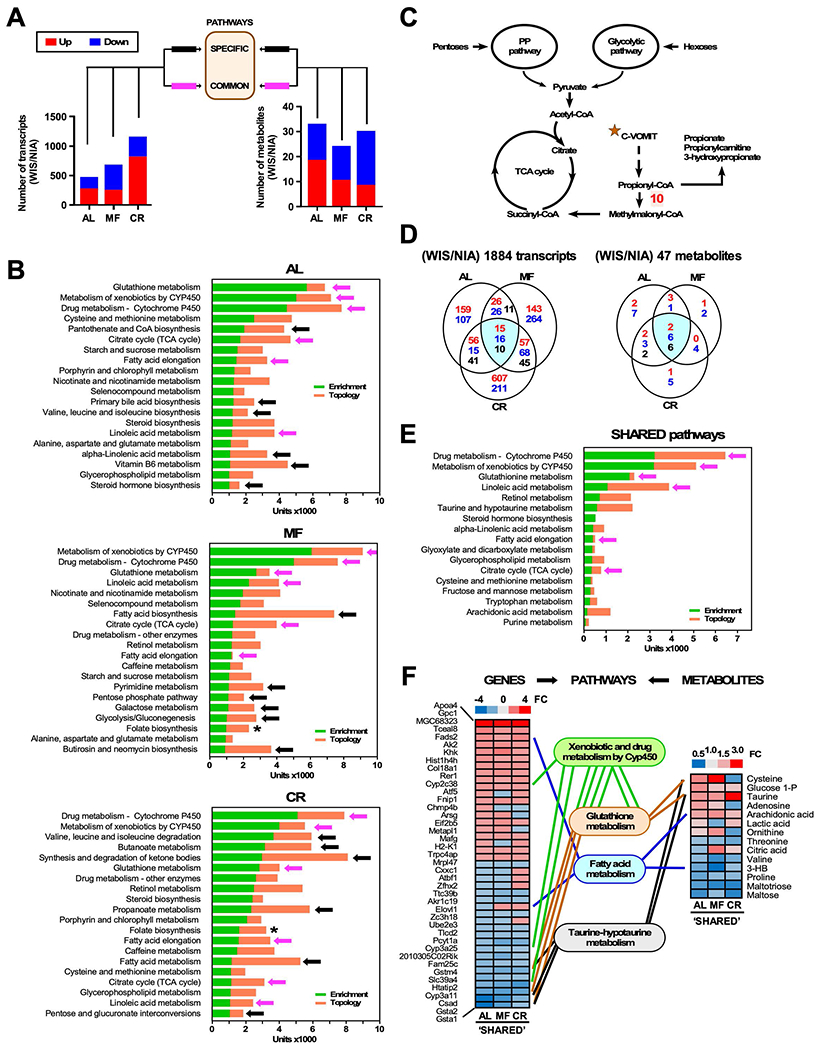
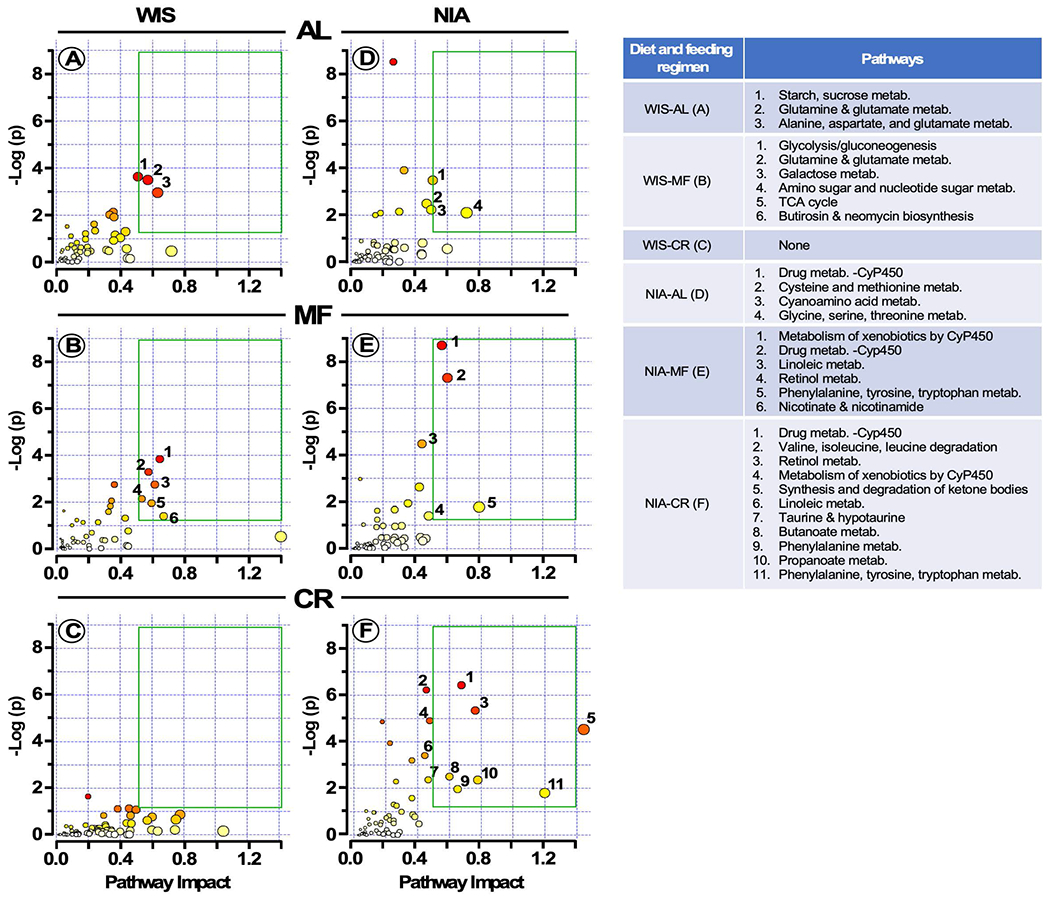
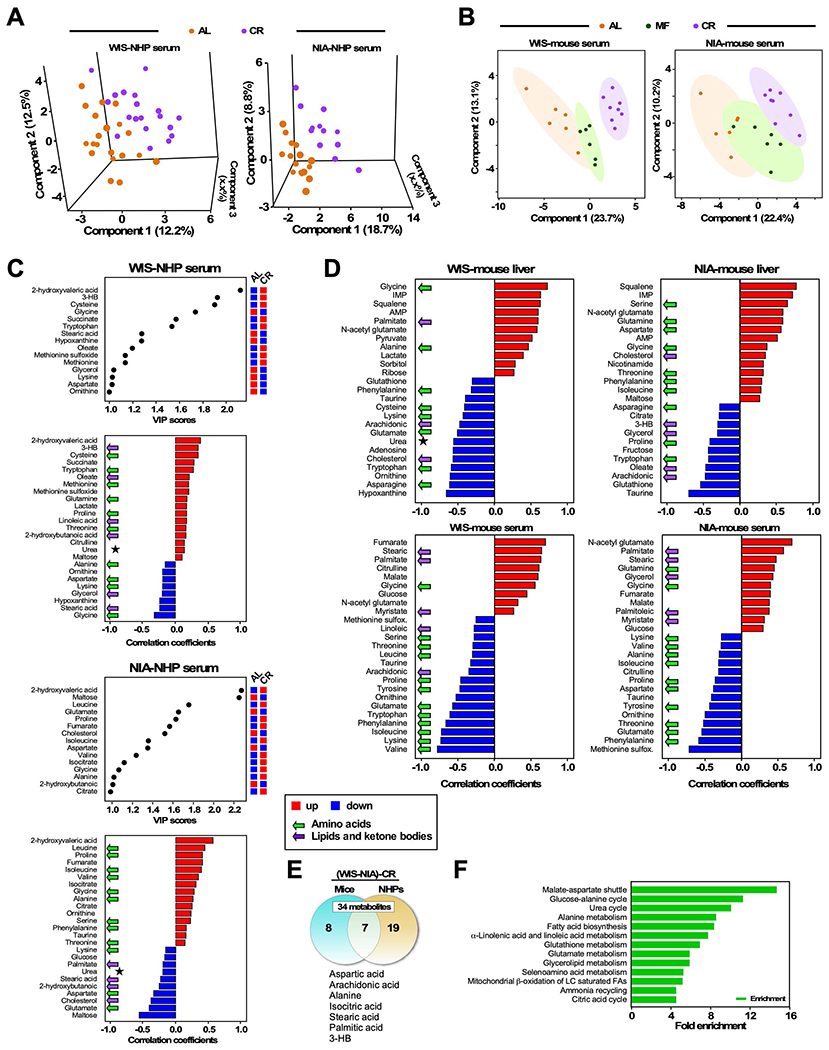
The impact of chronic caloric restriction (CR) on health and survival is complex with poorly understood underlying molecular mechanisms. A recent study in mice addressing the diets used in nonhuman primate CR studies found that while diet composition did not impact longevity, fasting time and total calorie intake were determinant for increased survival. Here, integrated analysis of physiological and multi-omics data from ad libitum, meal-fed, or CR animals was used to gain insight into pathways associated with improved health and survival. We identified a potential involvement of the glycine-serine-threonine metabolic axis in longevity and related molecular mechanisms. Direct comparison of the different feeding strategies unveiled a pattern of shared pathways of improved health that included short-chain fatty acids and essential PUFA metabolism. These findings were recapitulated in the serum metabolome from nonhuman primates. We propose that the pathways identified might be targeted for their potential role in healthy aging.

Keywords: aging; calorie restriction; calories; dietary interventions; dietary restriction; fasting; meal fed; metabolism; metabolomics; time-restricted feeding.


Conflict of interest statement

Declaration of Interests The authors declare no competing interests.

Figures

Figure 1.
Figure 1.. Effects of the feeding paradigm on health preservation in male mice fed NIA or WIS diet.
(A) Timetable for the measure of the indicated parameters during the treatment protocol. (B) Percent fat mass changes over time (5, 9, 17, and 21 months on diet) as measured by nuclear magnetic resonance spectroscopy (upper panels) and lean-to-fat ratio trajectories (lower panels). N=8-20 mice per experimental group. (C) Fasted blood glucose (FBG) levels at various time-points (5, 9, 12, 15, 19, and 22 months on diet). n=8 mice per experimental group. (D) Oral glucose tolerance test (OGTT) performed on 10- and 14-month-old mice (5 and 9 months on diet). n=6-8 mice per group. (E) Ten-month-old mice (5 months on diet) were placed into metabolic cages to measure the respiratory exchange ratio (RER) as detailed in method online, n=5-6 mice per group. *p ≤ 0.05 compared to AL; #p ≤ 0.05 compared to MF. AL, ad libitum; MF, meal-fed; CR, calorie restriction
Figure 2.
Figure 2.. Multi-omics analysis of liver extracts: Specific pathways of lifespan.
(A) Principal component analysis (PCA) of the liver transcriptome was performed in mice on NIA or WIS diet for 19 months. For each diet type, mice were fed ad libitum (AL), meal-fed (MF), or 30% calorie restriction (CR). (B) Liver metabolite profiles from NIA/WIS diets [AL (n=6/6), MF (n=6/6) and CR (n=8/8)] were analyzed by Partial Least Square Discriminant Analysis (PLS-DA). AL (orange symbols), MF (green symbols) and CR (purple symbols). A statistically significant degree of separation is observed between AL and CR groups. The ellipses correspond to 95% confidence intervals for a normal distribution. Each principal component is labeled with the corresponding percent values. (C) Top panels, Venn diagrams depicting the distribution of transcripts (left panels) and metabolites (right panels) in the liver of mice on NIA or WIS diet in response to the indicated pairwise comparisons (CR-AL and MF-AL). Shared elements constitute ‘specific’ attributes associated with lifespan within each pairwise comparison (See also main text for more explanation, section: “Hepatic transcriptomic and metabolomic responses to…”). Upregulation (red font), downregulation (blue font), and reciprocal regulation (black font) of significantly impacted elements (transcripts and metabolites) are depicted. (D, E) Multi-omics analysis using transcriptomics and metabolomics data was performed according to the analytical scheme shown in (C). The Joint Pathway Analysis (JPA) from MetaboAnalyst 3.0 was used to calculate the bar chart which is a combination of enrichment p values (green bars) and topology analysis (orange bars) of the pathways denoted on the y-axis. Black arrows denote biosynthetic and metabolic pathways specifically impacted by CR (D) or MF (E) when compared to AL-fed controls. The number/scale in x-axis is arbitrary and is calculated by scaling enrichment and topology to the same range [0-1], then summed up and multiplied by 1000.
Figure 3.
Figure 3.. Multi-omics analysis of liver extracts: Main pathways of lifespan.
(A) Heatmap visualization of 21 core transcripts (left) and 10 core metabolites (right) shared regardless of diet or feeding regimen. Upregulation (red font), down regulation (blue font). FC, fold change. (B) Top 20 pathways calculated by Joint Pathway Analysis using enrichment (green bars) and topology (red bars) analyses. *Centrality of glycine-serine-threonine metabolism as given by the height of the topology metric (orange bar). (C) Schematic representation of the hub nature of glycine, serine and threonine metabolic network. (D) Integration of the folate, methionine and transsulfuration pathways leading to the biosynthesis of nucleotides, transmethylation reactions and glutathione generation. Enzyme-catalyzed reactions: 1. Methionine adenosyltransferase (MAT, Mat); 2. Cystathionine beta-synthase (CBS, Cbs); 3. Methionine synthase (MS, Mtr); 4. Methylenetetrahydrofolate reductase (MTHFR, Mthfr); 5. S-adenosyl-L-methionine-dependent methyltransferase (MTase, ); 6. S-adenosylhomocysteine hydrolase (SAHH, Sahh); 7. Serine hydroxymethyltransferase (SHMT, Shmt); 8. Cystathionine γ-lyase (CTH, Cth); 9. Glutathione S-transferase (GST, Gst).
Figure 4.
Figure 4.. Multi-omics analysis of liver extracts: Specific and shared pathways of health preservation in response to feeding regimes.
(A) Bar graphs show the number of up- (red) and down-modulated (blue) liver genes and metabolites in WIS over NIA from mice fed AL, MF and CR. The shared genes/metabolites complying with the cut-off threshold (fold change >1.2 or < 0.8) and possessing valid identification (ID) were utilized as input for multi-omics analysis shown in (B). (B) Multi-omics analysis using transcriptomics and metabolomics data was performed according to the analytical scheme shown in (A). JPA analysis from MetaboAnalyst 3.0 was used to calculate composite bars comprising enrichment (green) and topology (orange) of top pathways for each feeding paradigm (AL, MF, CR) (see Figure 2 legend for more explanation). Black arrows denote biosynthetic and metabolic pathways specific for a given feeding regime while magenta arrows indicate pathways that are common between AL, MF and CR. * denotes the relevance of folate biosynthesis in MF and CR groups. (C) Schematic representation of propionic acid metabolism, whereby propionyl-CoA is produced in response to the catabolism of cholesterol, odd chain FAs, and essential amino acids such as valine, methionine, isoleucine and threonine (mnemonic “C-VOMIT”), feeding the TCA cycle after conversion to succinyl-CoA. Enzyme-catalyzed reaction: 10. Propionyl-CoA carboxylase (PCC, Pcc). PCC defect leads to propionic acidemia, hyperammonemia, lethargy, vomiting and sometimes coma and death if not treated (Wongkittichote et al., 2017). (D) Three-way Venn diagram depicting the distribution of common elements regardless of the feeding regimen (CR, MF or AL). Highlighted are shared 41 out of 1884 transcripts and 14 out of 47 metabolites. These shared elements constitute common attributes regardless of diet type and feeding regimen. Upregulation (red font), downregulation (blue font), and reciprocal regulation (black font) of significantly impacted transcripts/metabolites are depicted. (E) Top 17 shared pathways calculated by JPA with similar bar coding described above in the legend to panel B. Magenta arrow denotes common pathways independent of the feeding regime. (F) Heat maps of shared genes (left) and metabolites (right) derived from (panel E) (See Table S3 for quantitative values). Also displayed are the links (genes) between network nodes (metabolites) belonging to the same pathways.
Figure 5.
Figure 5.. Identification of pathways impacted by diet composition and feeding regimens.
Input for the multi-omics JPA consisted of the fold-change derived from the WIS/NIA ratio of transcripts or metabolites gathered in Figure 4A, whereby threshold > 1.2 indicates upregulation by the WIS diet and threshold < 0.8 signifies NIA diet-mediated upregulation. The impact of feeding regimen (AL, MF or CR) within each diet towards pathway enrichment and their network topology is depicted. Y-axis, enrichment significance; X- axis, pathway impact for network topology. Green box highlights pathways significantly impacted as defined by enrichment significance p < 0.05 [−log (p) > 1.3] and pathway impact > 0.5.
Figure 6.
Figure 6.. Experimental validation of longevity pathways in liver
(A) Immunoblots for SIRT1, AMPKα, NAMPT, and SIRT6 proteins from liver homogenates. Ponceau S staining of the membrane is shown and the molecular weight protein standards (kDa) are depicted on the left. (B) Densitometric quantification after normalization with Ponceau S staining. Values are represented as box plots with individual values (n = 4-5 per group). * p < 0.05. (C) Scatterplots showing the relationship between expression of two protein variables. Circles and triangles depict NIA and WIS diet, respectively. (D) Relative level of AMP in mouse liver extract is depicted as boxplots (n = 6-8 per group). * p < 0.05.
Figure 7.
Figure 7.. Untargeted serum metabolomics in NHP and serum/liver in mice
(A) Untargeted metabolomics performed in serum from male NHPs subjected to CR at adult age: 12y average NIA: control (n=19), CR (n=12) or 18y average WIS: control (n=20), CR (n=21). Partial Least Square Discriminant Analysis (PLSDA) of WIS (left panel) and NIA (right panel) cohorts. (B) PLSDA of serum metabolomics from mice subjected to AL, MF or CR feeding under WIS (left panel) or NIA (right panel) diet. (C) Untargeted metabolomics performed in serum from male NHPs subjected to CR at adult age: 12y average NIA: control (n=19), CR (n=12) or 18y average WIS: control (n=20), CR (n=21). Variable in projection (VIP) scores and correlation patterns of positively (red bars) and negatively (blue bars) correlating metabolites are shown as a function of CR. These are responsible for treatments separation between control and CR groups from WIS (left panels) and NIA (right panels) NHPs, respectively. Green arrows indicate amino acids while magenta arrows denote lipids/ketone bodies. * denotes urea, as a biomarker of urea cycle activity. (D) Untargeted metabolomics performed in liver/serum from males C57BL/6J mice subjected to WIS diet: AL (n=5/6), MF (n=6/6), CR (n=8/8) or NIA diet: AL (n=6/6), MF (n=6/6), CR (n=8/8). Correlation patterns of positively and negatively correlating metabolites as a function of CR for liver (top panels) and serum (bottom panels) of mice on WIS (left) or NIA (right) diet. (E) Venn diagram depicting diet-independent, shared metabolites in sera from NHPs and mice under CR. (F) Pathway enrichment by the seven common metabolites shown in (E).

References

    1. Aitken SM, and Kirsch JF, (2005). The enzymology of cystathionine biosynthesis: strategies for the control of substrate and reaction specificity. Arch Biochem Biophys 433, 166–175. - PubMed
    1. Al-Lahham SH, Peppelenbosch MP, Roelofsen H, Vonk RJ, and Venema K, (2010). Biological effects of propionic acid in humans; metabolism, potential applications and underlying mechanisms. Biochim Biophys Acta 1801, 1175–1183. - PubMed
    1. Armstrong VL, Rakoczy S, Rojanathammanee L, and Brown-Borg HM, (2014). Expression of DNA methyltransferases is influenced by growth hormone in the long-living Ames dwarf mouse in vivo and in vitro. J Gerontol A Biol Sci Med Sci 69, 923–933. - PMC - PubMed
    1. Baeza J, Smallegan MJ, and Denu JM, (2016). Mechanisms and Dynamics of Protein Acetylation in Mitochondria. Trends Biochem Sci 41, 231–244. - PMC - PubMed
    1. Baker EJ, Miles EA, Burdge GC, Yaqoob P, and Calder PC, (2016). Metabolism and functional effects of plant-derived omega-3 fatty acids in humans. Prog Lipid Res 64, 30–56. - PubMed

Publication types