

Does lockdown reduce air pollution? Evidence from 44 cities in northern China
- PMID: 32413655
- PMCID: PMC7194561
- DOI: 10.1016/j.scitotenv.2020.139052
Does lockdown reduce air pollution? Evidence from 44 cities in northern China
Abstract
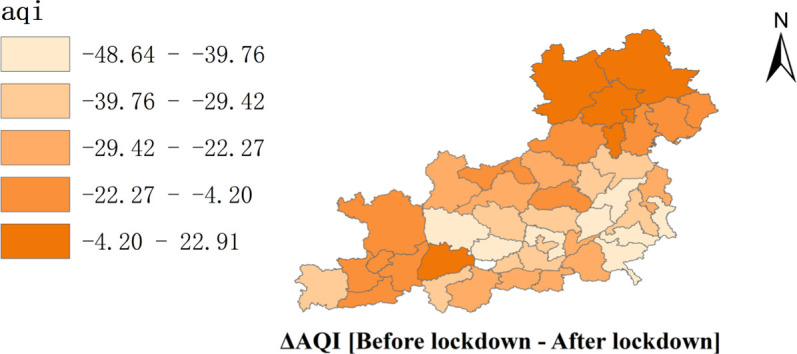
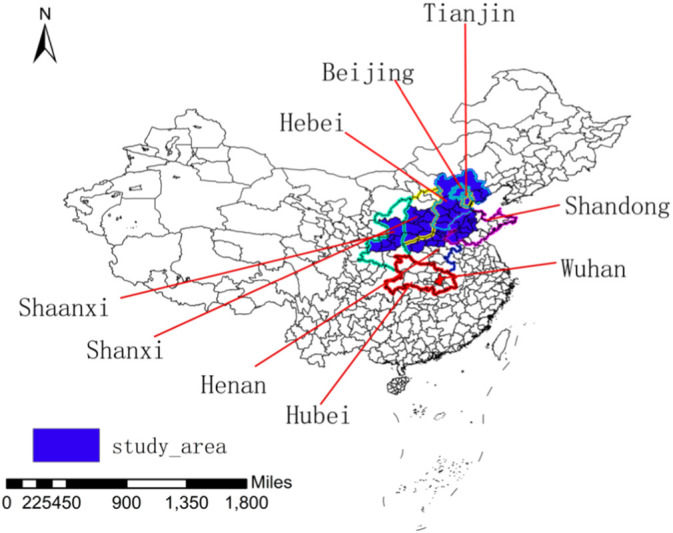
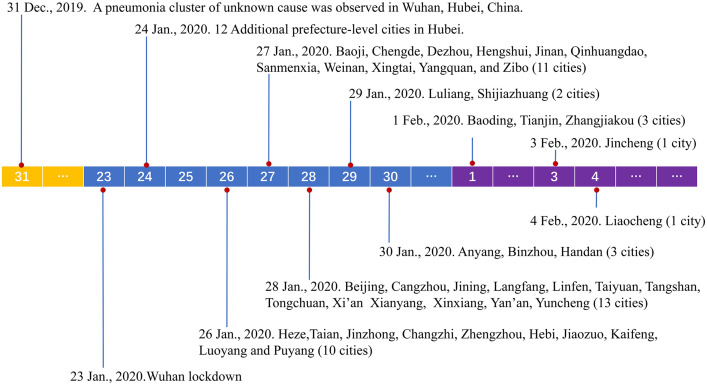
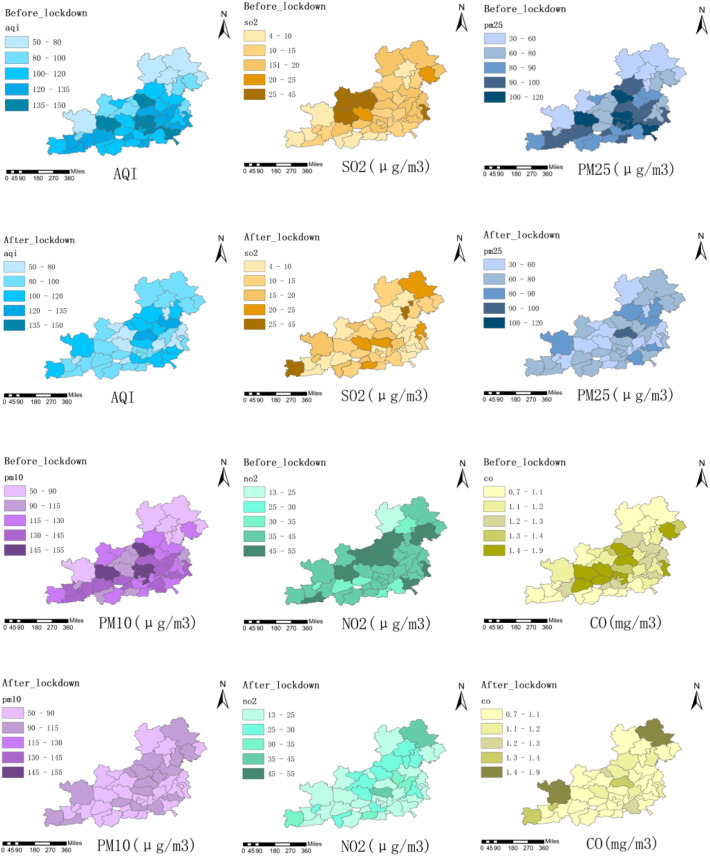
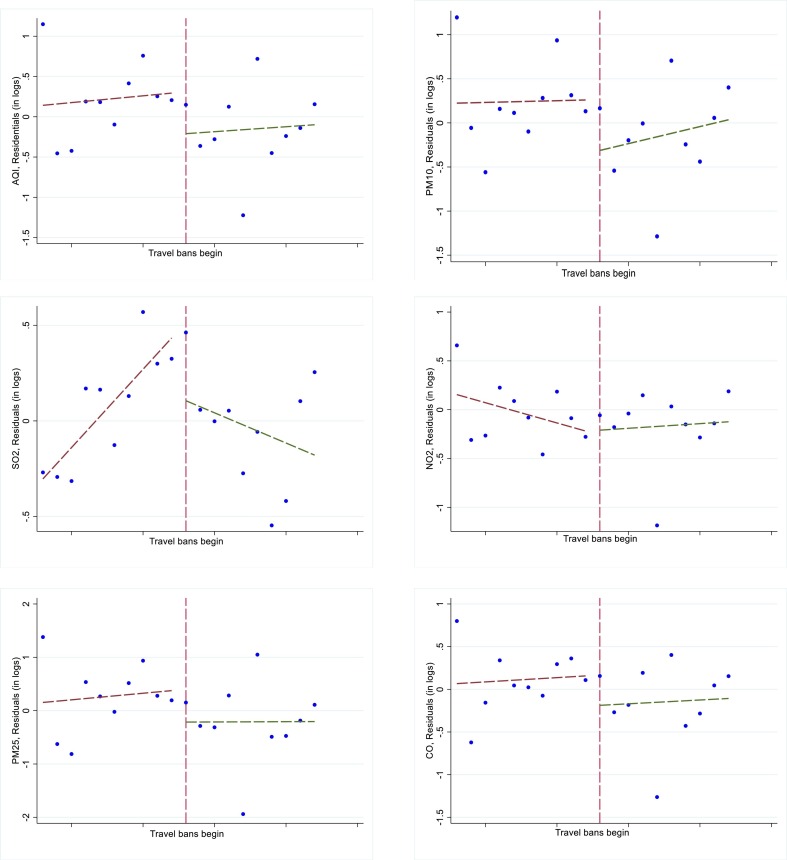
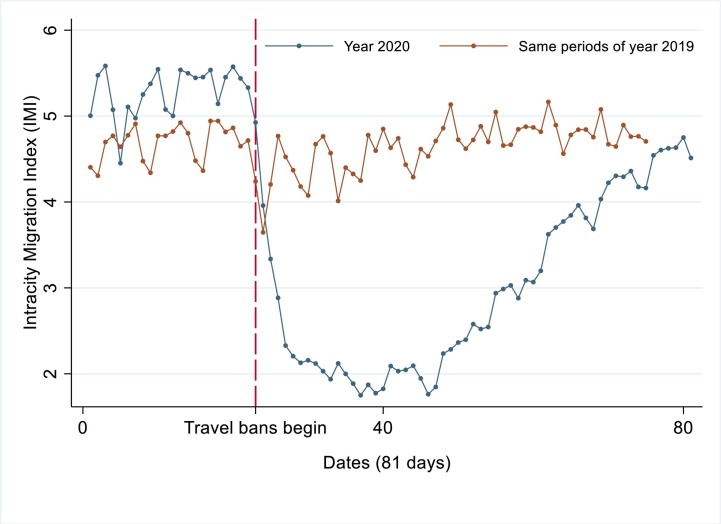
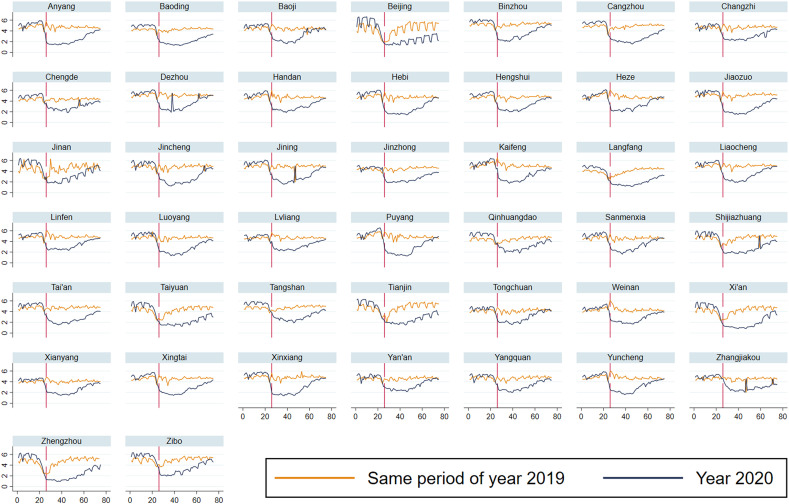
Responding to the ongoing novel coronavirus (agent of COVID-19) outbreak, China implemented "the largest quarantine in human history" in Wuhan on 23 January 2020. Similar quarantine measures were imposed on other Chinese cities within days. Human mobility and relevant production and consumption activities have since decreased significantly. As a likely side effect of this decrease, many regions have recorded significant reductions in air pollution. We employed daily air pollution data and Intracity Migration Index (IMI) data form Baidu between 1 January and 21 March 2020 for 44 cities in northern China to examine whether, how, and to what extent travel restrictions affected air quality. On the basis of this quantitative analysis, we reached the following conclusions: (1) The reduction of air pollution was strongly associated with travel restrictions during this pandemic-on average, the air quality index (AQI) decreased by 7.80%, and five air pollutants (i.e., SO2, PM2.5, PM10, NO2, and CO) decreased by 6.76%, 5.93%, 13.66%, 24.67%, and 4.58%, respectively. (2) Mechanism analysis illustrated that the lockdowns of 44 cities reduced human movements by 69.85%, and a reduction in the AQI, PM2.5, and CO was partially mediated by human mobility, and SO2, PM10, and NO2 were completely mediated. (3) Our findings highlight the importance of understanding the role of green production and consumption.
Keywords: Air pollution; COVID-19; Dynamic panel; Human mobility; Travel restriction.
Copyright © 2020 Elsevier B.V. All rights reserved.
Conflict of interest statement
Declaration of competing interest The authors declare that they have no known competing financial interests or personal relationships that could have appeared to influence the work reported in this paper.
Figures
References
-
- Chinazzi M., Davis J.T., Ajelli M., Gioannini C., Litvinova M., Merler S., Pastore Y Piontti A., Mu K., Rossi L., Sun K., Viboud C., Xiong X., Yu H., Halloran M.E., Longini I.M., Vespignani A. The effect of travel restrictions on the spread of the 2019 novel coronavirus (COVID-19) outbreak. Science. 2020:a9757. doi: 10.1126/science.aba9757. - DOI - PMC - PubMed
-
- Cole M.A., Elliott R.J.R., Shimamoto K. Industrial characteristics, environmental regulations and air pollution: an analysis of the UK manufacturing sector. J. Environ. Econ. Manag. 2005;50:121–143. doi: 10.1016/j.jeem.2004.08.001. - DOI
-
- Fu S., Gu Y. Highway toll and air pollution: evidence from Chinese cities. Journal of Environmental Economics & Management. 2017 doi: 10.1016/j.jeem.2016.11.007. - DOI
MeSH terms
Substances
LinkOut - more resources
Full Text Sources
Medical
Research Materials
