. 2020 Jul 10;369(6500):eabb9789.
doi: 10.1126/science.abb9789. Epub 2020 May 15.

Inferring change points in the spread of COVID-19 reveals the effectiveness of interventions

Affiliations

Inferring change points in the spread of COVID-19 reveals the effectiveness of interventions

Jonas Dehning et al. Science. .

Abstract

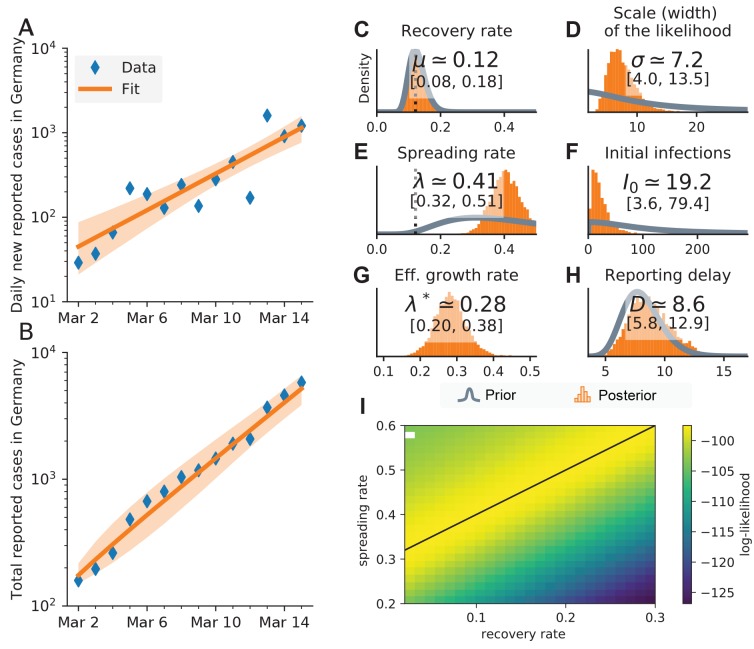
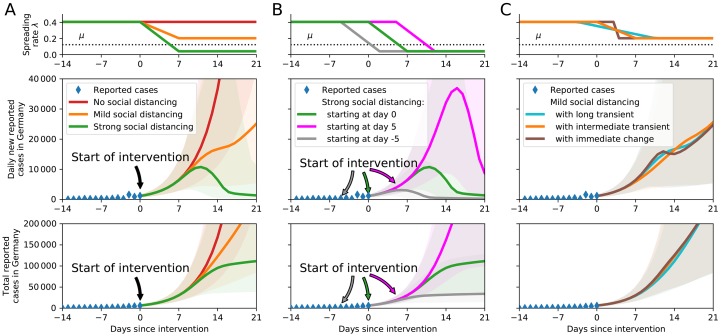
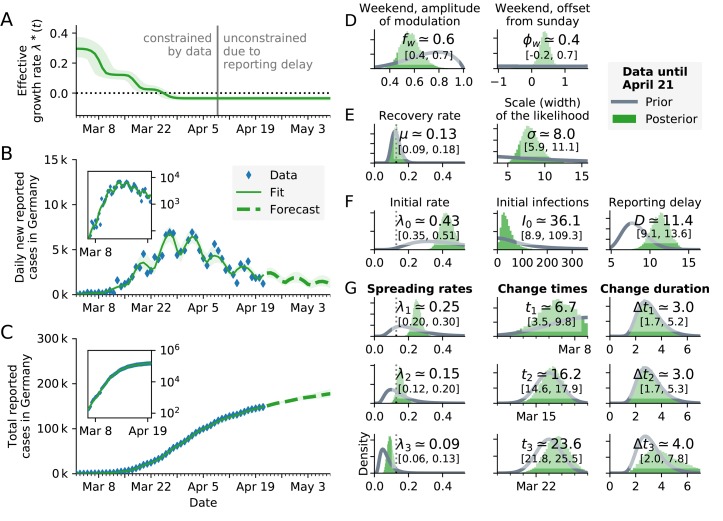
As coronavirus disease 2019 (COVID-19) is rapidly spreading across the globe, short-term modeling forecasts provide time-critical information for decisions on containment and mitigation strategies. A major challenge for short-term forecasts is the assessment of key epidemiological parameters and how they change when first interventions show an effect. By combining an established epidemiological model with Bayesian inference, we analyzed the time dependence of the effective growth rate of new infections. Focusing on COVID-19 spread in Germany, we detected change points in the effective growth rate that correlate well with the times of publicly announced interventions. Thereby, we could quantify the effect of interventions and incorporate the corresponding change points into forecasts of future scenarios and case numbers. Our code is freely available and can be readily adapted to any country or region.


Figures

Fig. 1
Fig. 1. Inference of central epidemiological parameters of the SIR model during the initial onset period, March 2–15.
A: The number of new cases and B: the total (cumulative) number of cases increase exponentially over time. C–H: Prior (gray) and posterior (orange) distributions for all model parameters: estimated spreading rate λ, recovery rate μ, reporting delay D between infection date and reporting date, number of cases I0 at the start of the simulation, scale-factor σ of the width of the likelihood distribution, and the effective growth rate λ*=λμ. I: Log-likelihood distribution for different combinations of λ and μ. A linear combination of λ and μ yields the same maximal likelihood (black line). White dot: Inference did not converge.
Fig. 2
Fig. 2. The timing and effectiveness of interventions strongly impact future COVID-19 cases.
A: We assume three different scenarios for interventions starting on March 16: (I, red) no social distancing, (II, orange) mild social distancing, or (III, green) strict social distancing. B: Delaying the restrictions has a major impact on case numbers: strict restrictions starting on March 16 (green), five days later (magenta) or five days earlier (gray). C: Comparison of the time span over which interventions ramp up to full effect. For all ramps that are centered around the same day, the resulting case numbers are fairly similar. However, a sudden change of the spreading rate can cause a temporary decrease of daily new cases, although λ>μ at all times (brown).
Fig. 3
Fig. 3. Bayesian analysis of the German COVID-19 data (blue diamonds) until April 21 reveals three change points that are consistent with three major governmental interventions.
A: Time-dependent model estimate of the effective spreading rate λ*(t). B: Comparison of daily new reported cases and the model (green solid line for median fit with 95% credible intervals, dashed line for median forecast with 95% CI); inset: same data in log-lin scale. C: Comparison of total reported cases and the model (same representation as in B). D–F: Priors (gray lines) and posteriors (green histograms) of all model parameters; inset values indicate the median and 95% credible intervals of the posteriors. For the same model with one or two change points, please see the corresponding figures in the SI (figs. S1 and S2 and table S2).

References

    1. Enserink M., Kupferschmidt K., With COVID-19, modeling takes on life and death importance. Science 367, 1414–1415 (2020). 10.1126/science.367.6485.1414-b - DOI - PubMed
    1. E. T. Jaynes, Probability Theory: The Logic of Science (Cambridge Univ. Press, 2003).
    1. A. Gelman, J. B. Carlin, H. S. Stern, D. B. Dunson, A. Vehtari, D. B. Rubin, Bayesian Data Analysis (CRC Press, ed. 3, 2013).
    1. Kermack W. O., McKendrick A. G., Walker G. T., A contribution to the mathematical theory of epidemics. Proc. R. Soc. Lond. A 115, 700–721 (1927). 10.1098/rspa.1927.0118 - DOI
    1. Hethcote H., The mathematics of infectious diseases. SIAM Rev. 42, 599–653 (2000). 10.1137/S0036144500371907 - DOI

Publication types