. 2020 May 15;5(47):eaaz6894.
doi: 10.1126/sciimmunol.aaz6894.

Early precursors and molecular determinants of tissue-resident memory CD8+ T lymphocytes revealed by single-cell RNA sequencing

Affiliations

Early precursors and molecular determinants of tissue-resident memory CD8+ T lymphocytes revealed by single-cell RNA sequencing

Nadia S Kurd et al. Sci Immunol. .

Abstract

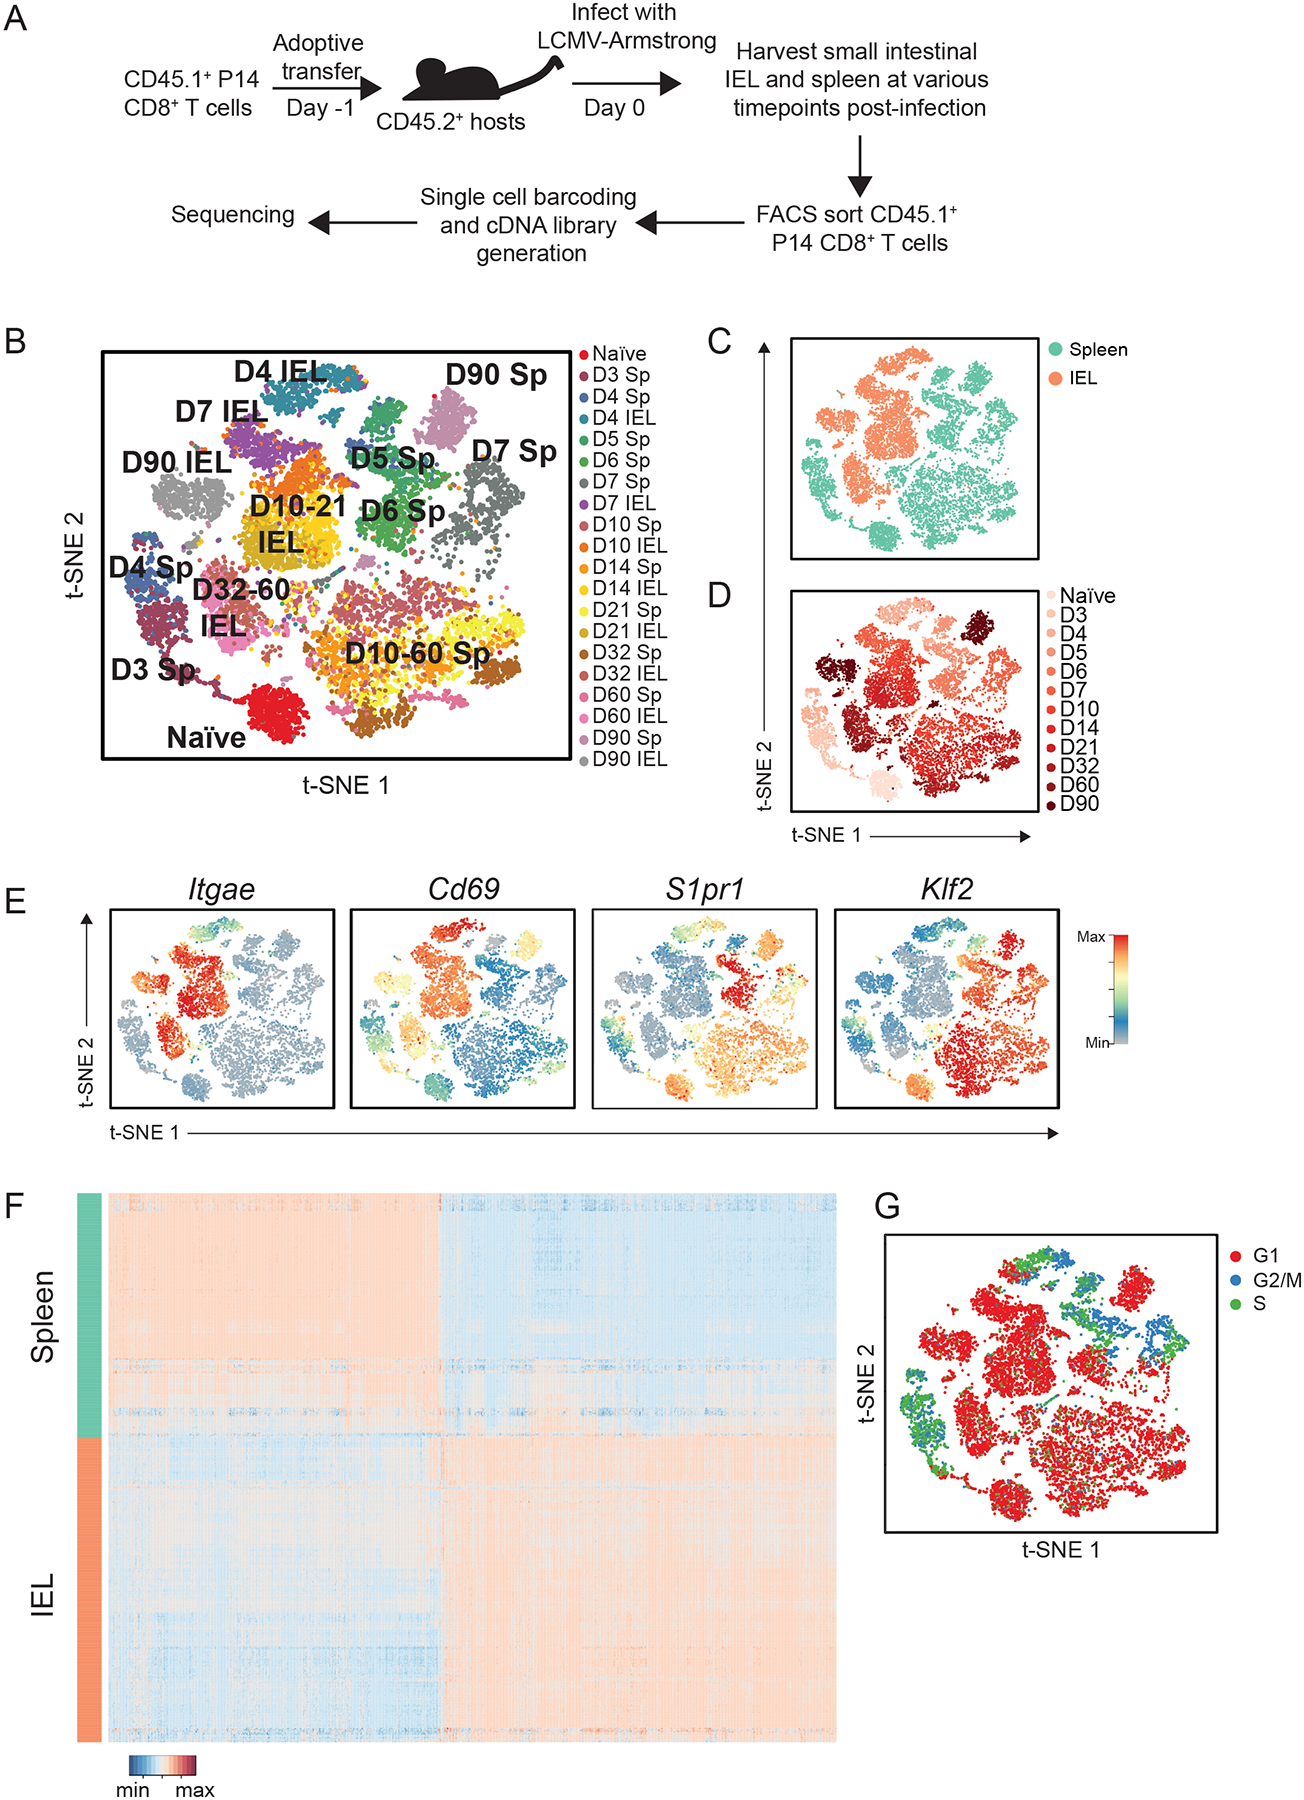
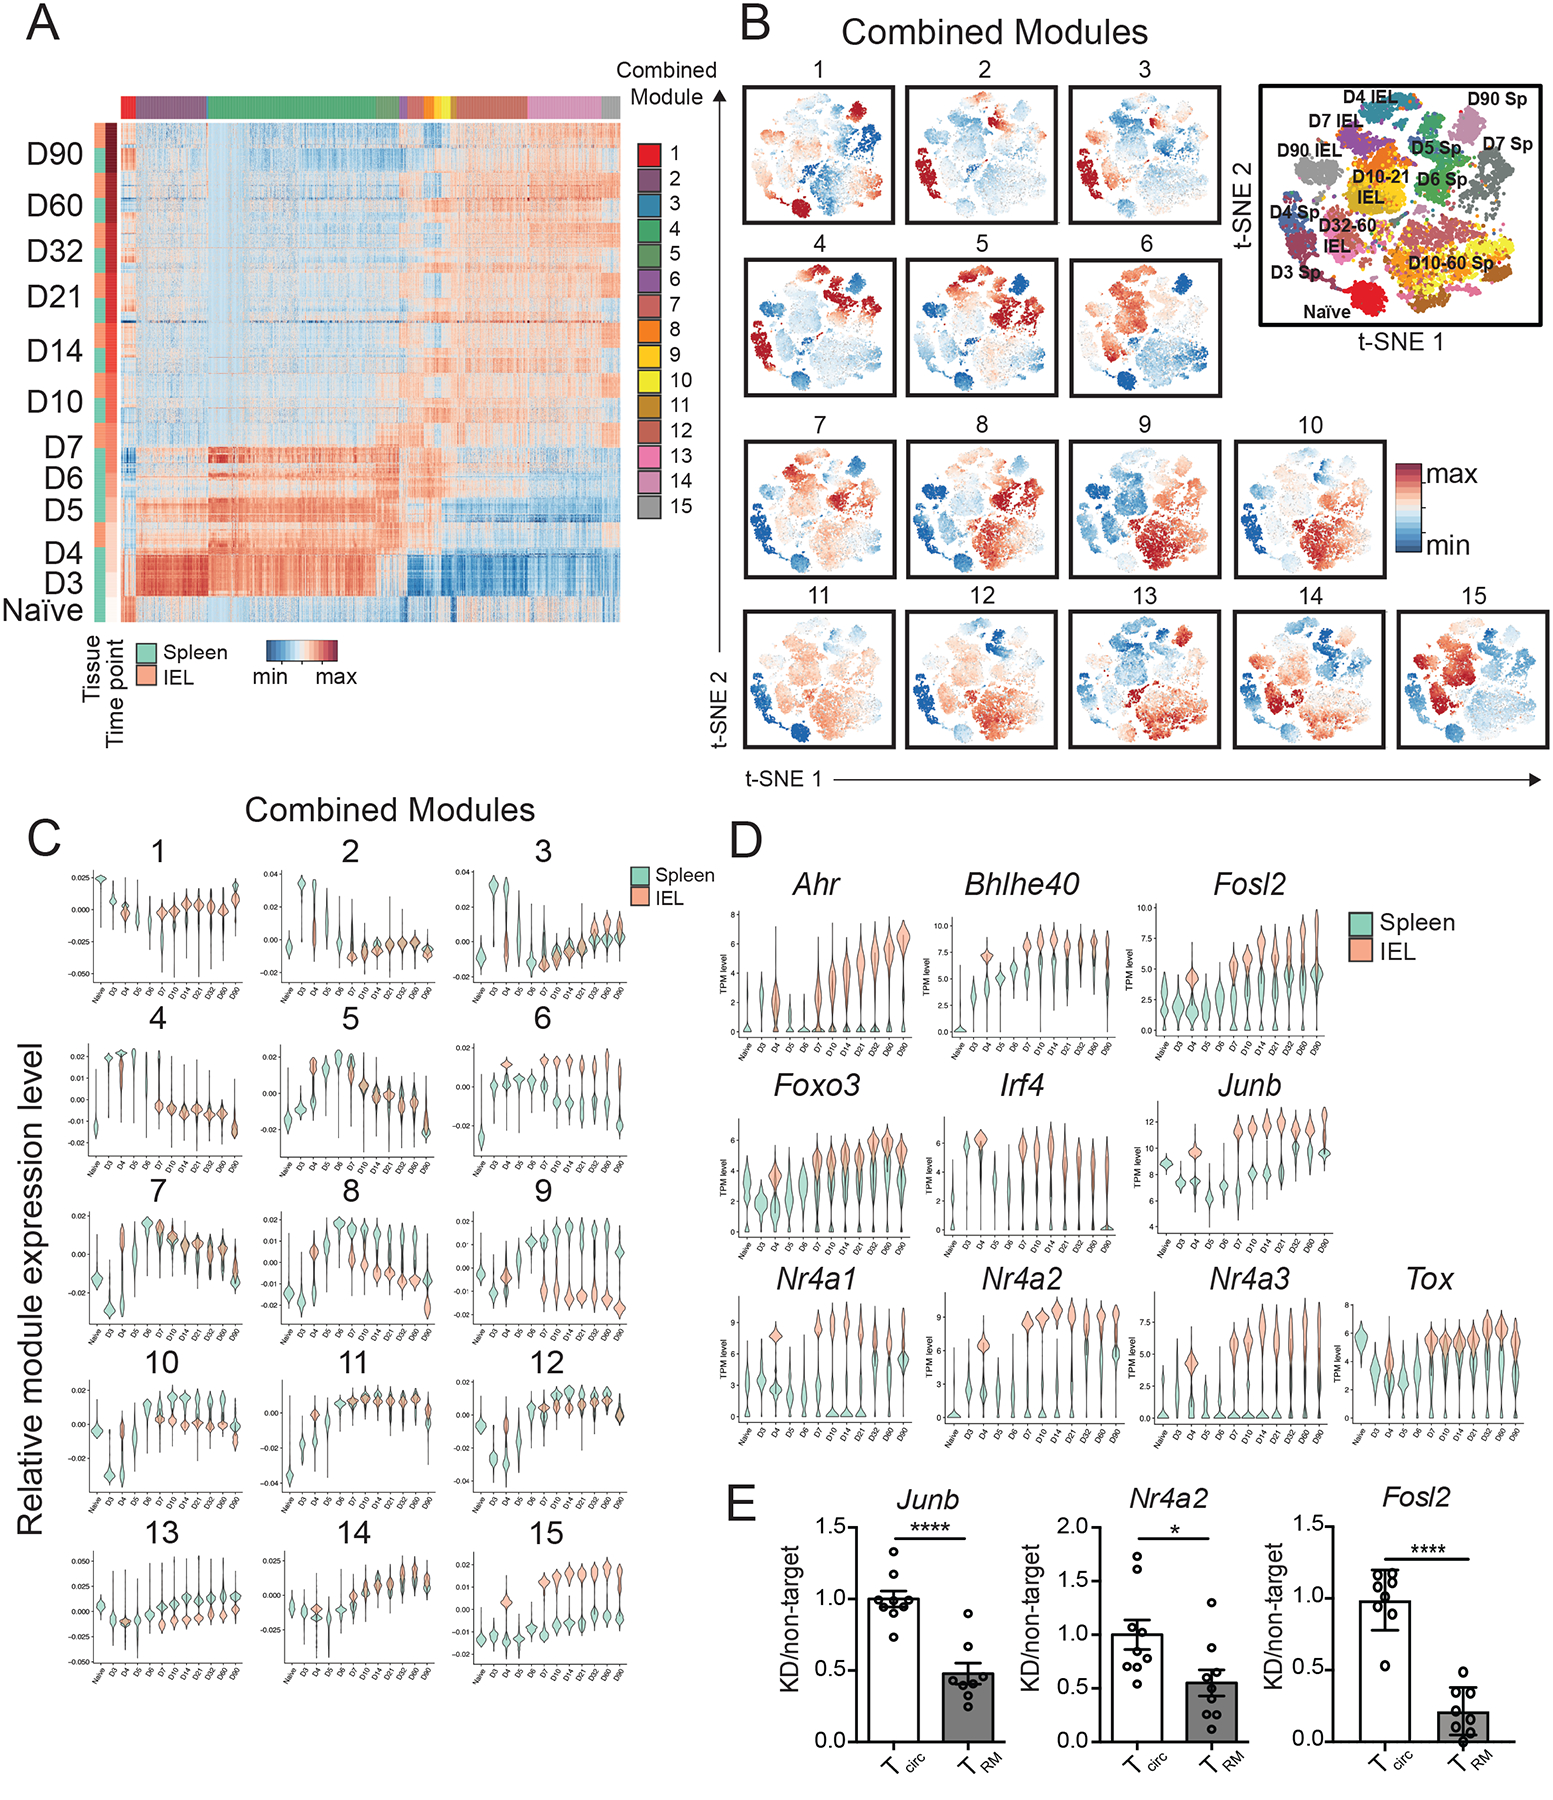
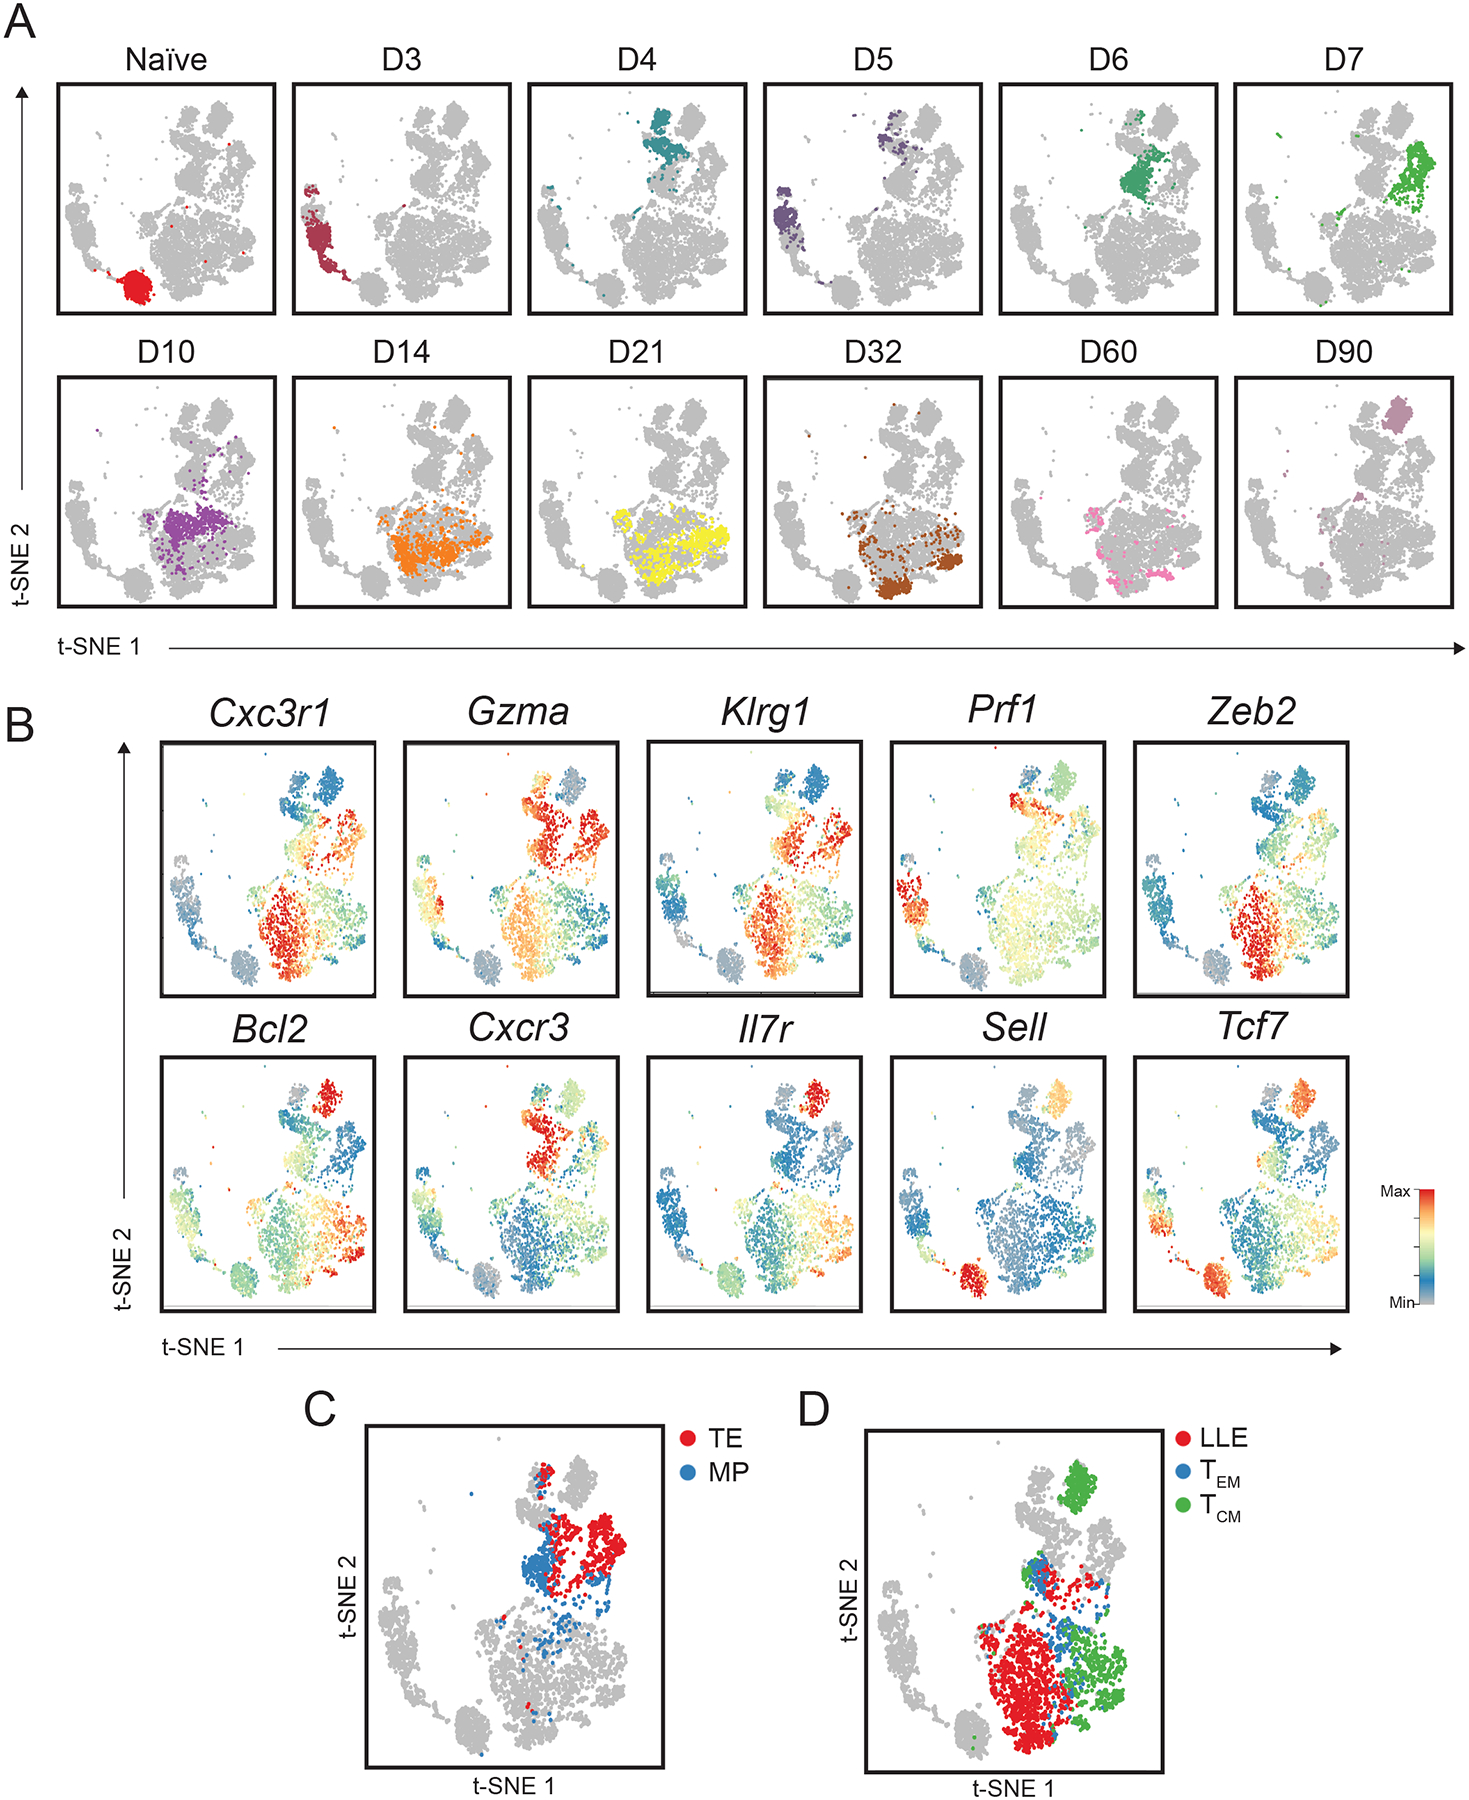
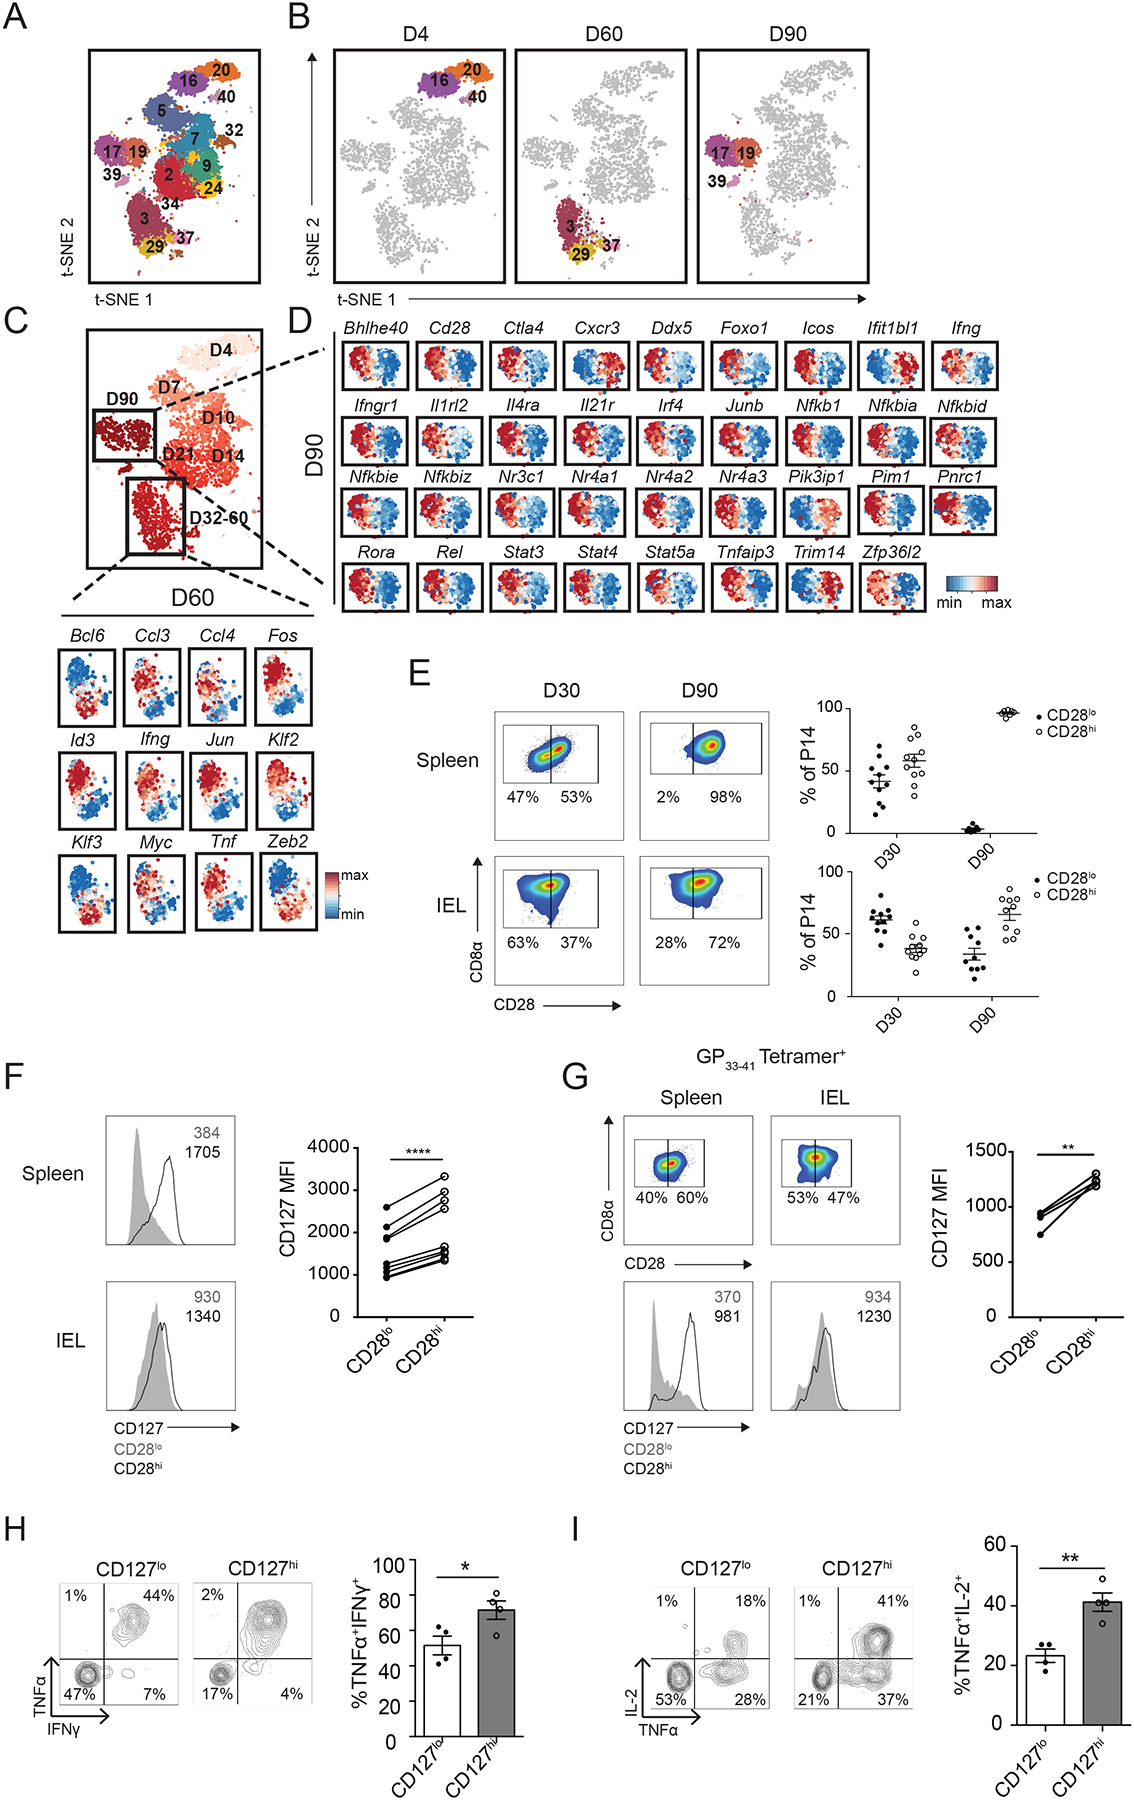
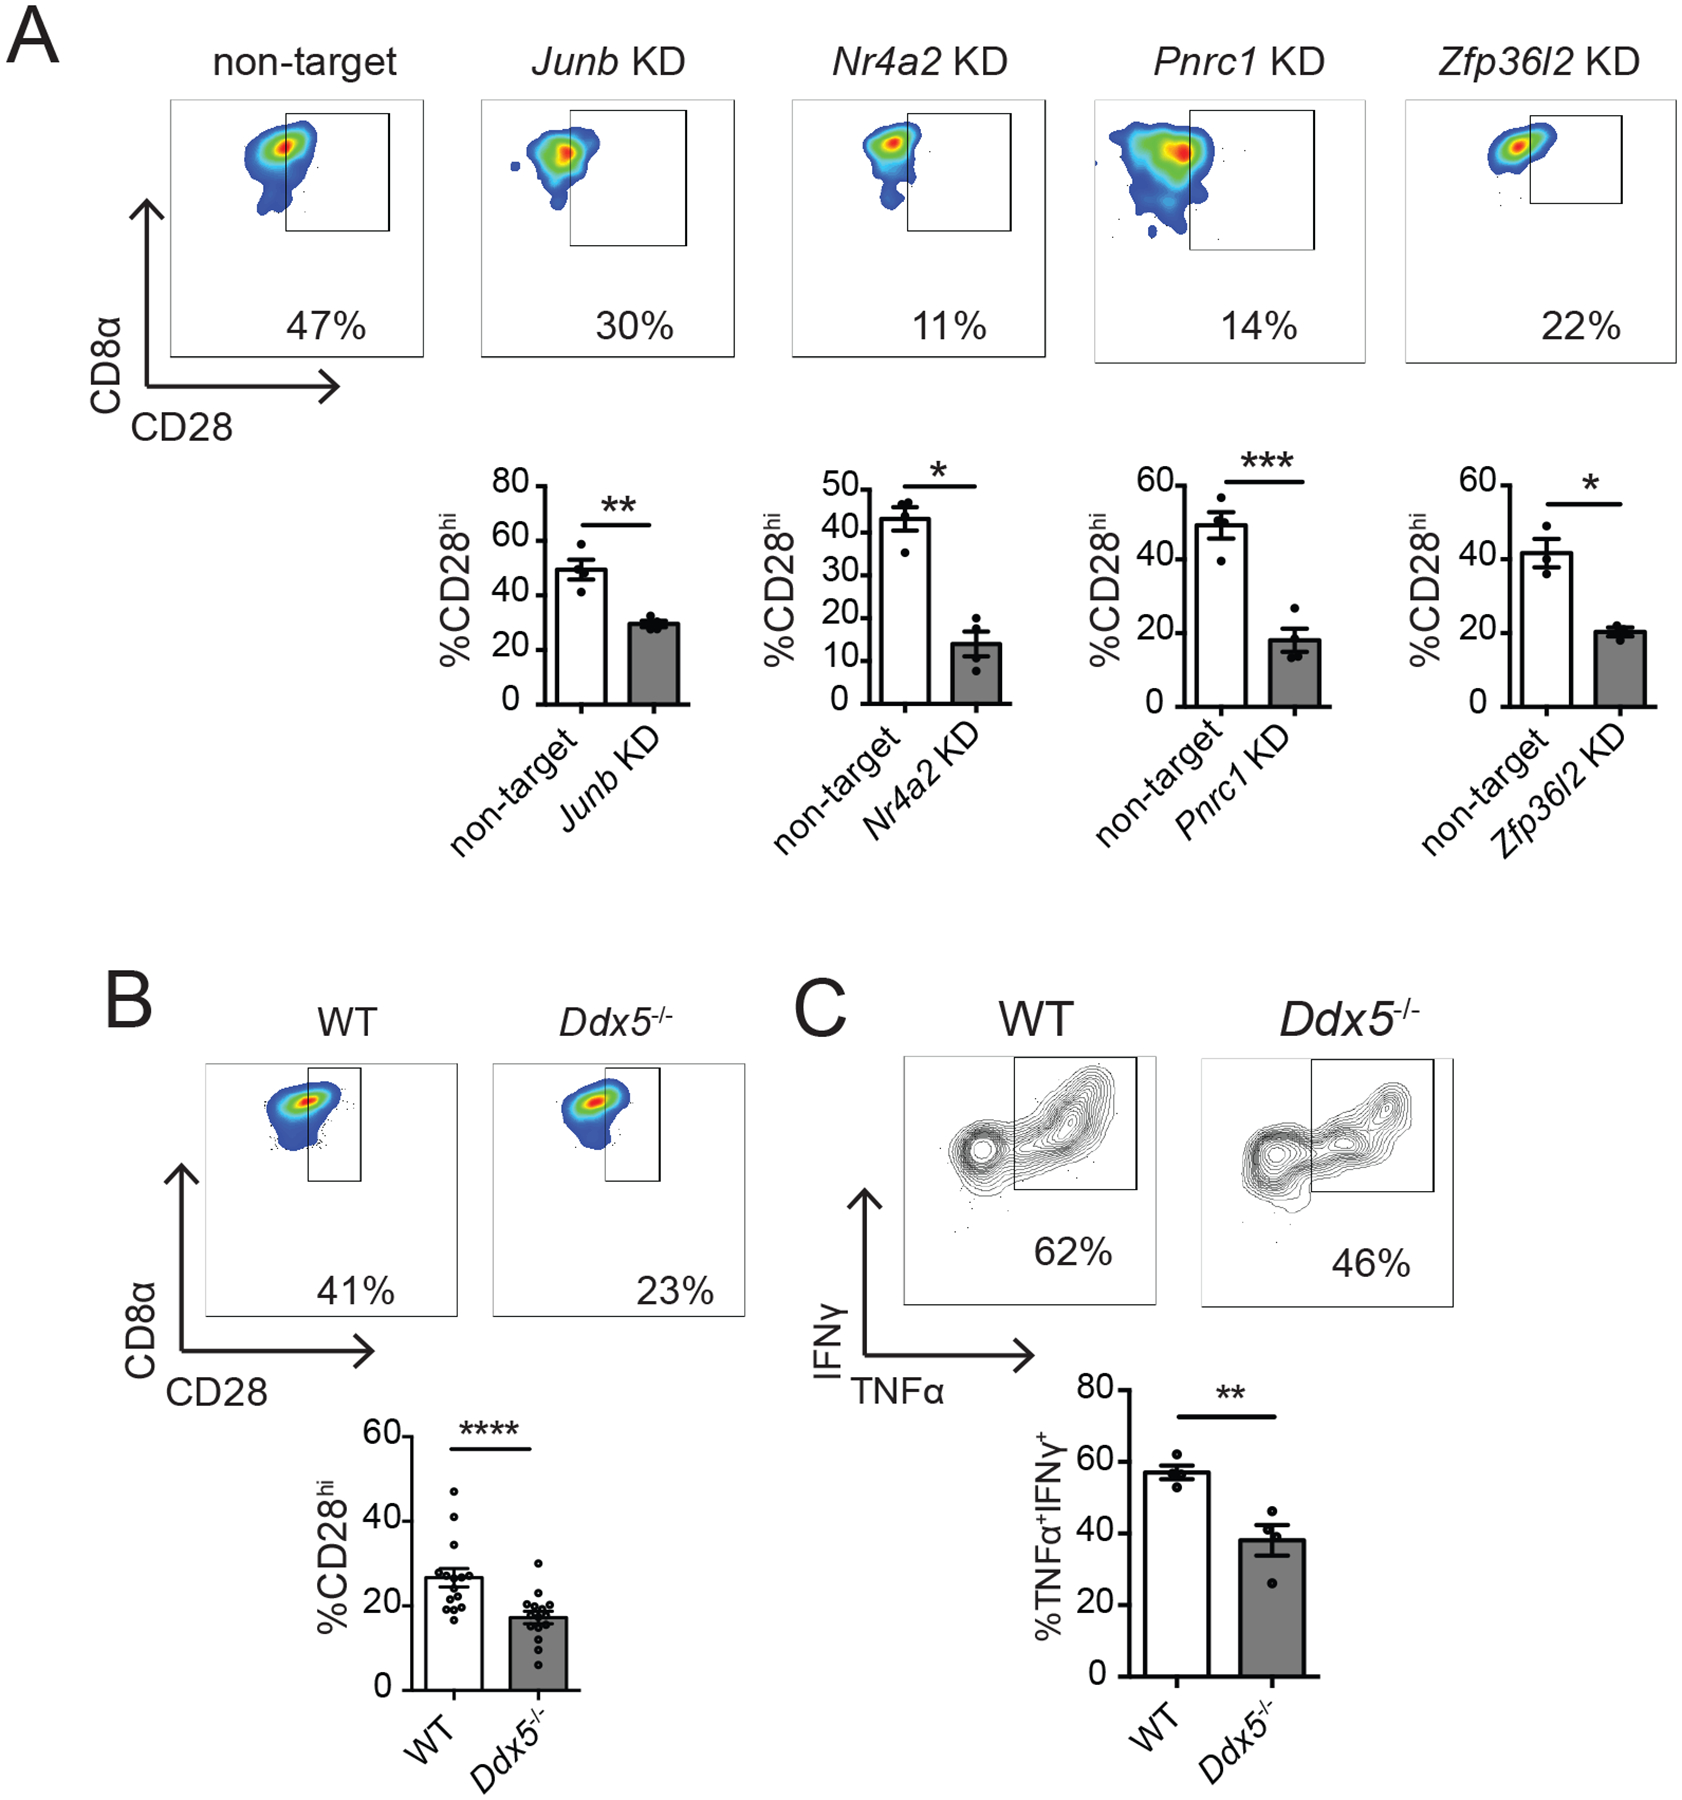
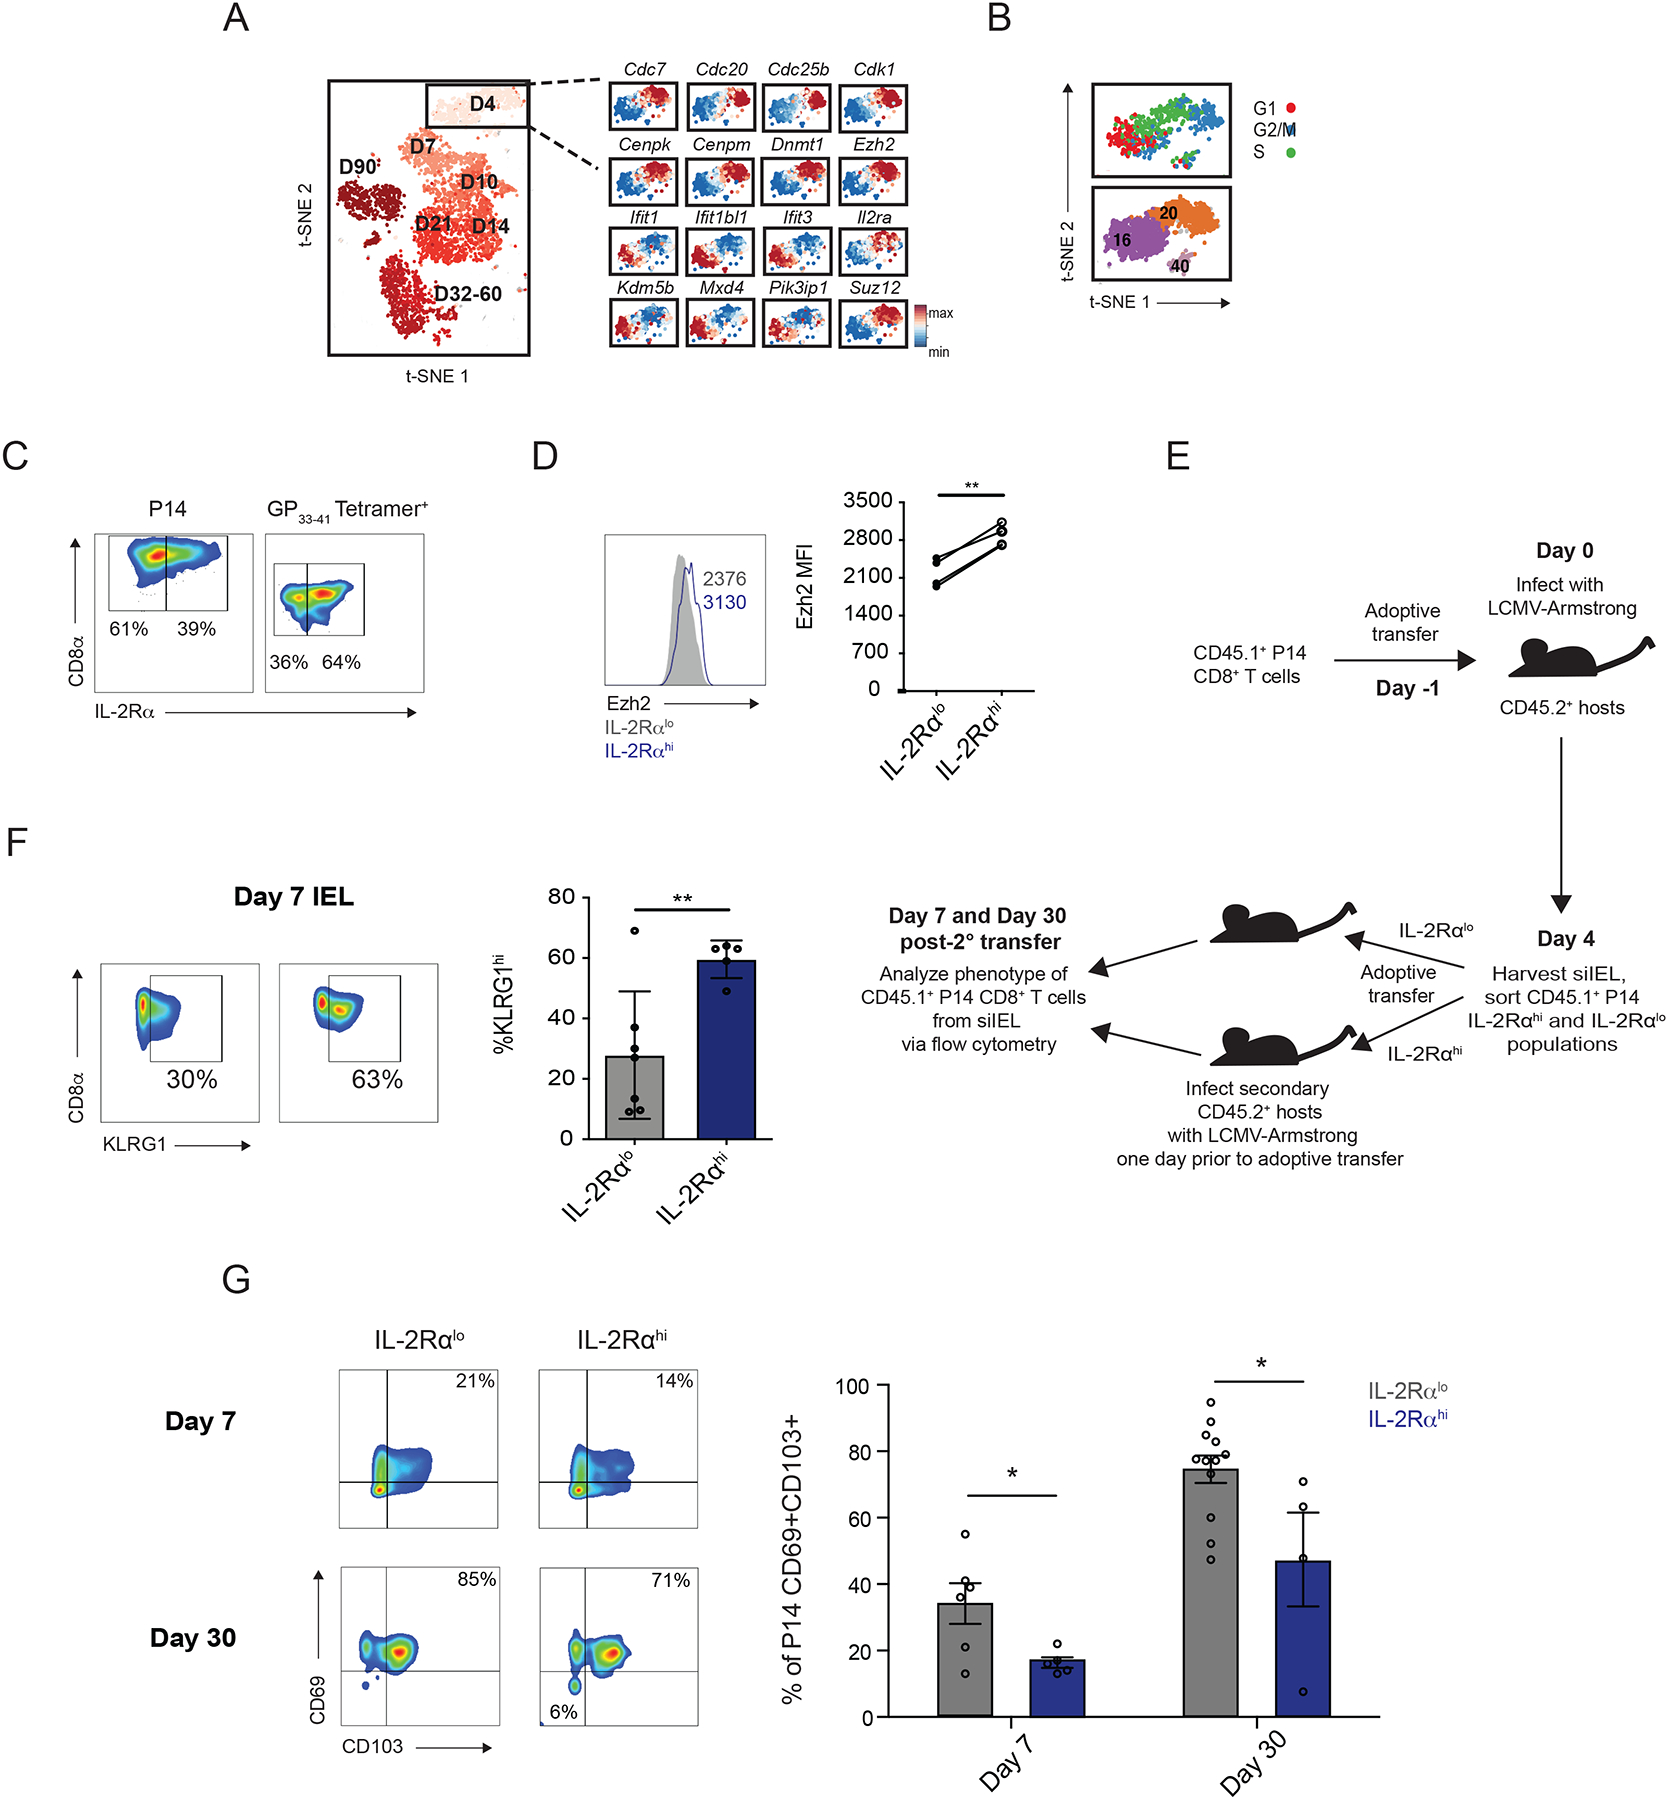
During an immune response to microbial infection, CD8+ T cells give rise to distinct classes of cellular progeny that coordinately mediate clearance of the pathogen and provide long-lasting protection against reinfection, including a subset of noncirculating tissue-resident memory (TRM) cells that mediate potent protection within nonlymphoid tissues. Here, we used single-cell RNA sequencing to examine the gene expression patterns of individual CD8+ T cells in the spleen and small intestine intraepithelial lymphocyte (siIEL) compartment throughout the course of their differentiation in response to viral infection. These analyses revealed previously unknown transcriptional heterogeneity within the siIEL CD8+ T cell population at several stages of differentiation, representing functionally distinct TRM cell subsets and a subset of TRM cell precursors within the tissue early in infection. Together, these findings may inform strategies to optimize CD8+ T cell responses to protect against microbial infection and cancer.


Conflict of interest statement

Competing interests: G.W.Y. is co-founder, member of the Board of Directors, on the Scientific Advisory Board, equity holder, and paid consultant for Locana and Eclipse BioInnovations. G.W.Y. is a visiting professor at the National University of Singapore. G.W.Y. is a paid consultant for the Allen Institute of Immunology. Dr. Yeo’s interests have been reviewed and approved by the University of California, San Diego in accordance with its conflict of interest policies. B.S.B. was a consultant for Abbvie, Prometheus Laboratories, and Pfizer in the past 3 years. The other authors declare that they have no competing interests.

Figures

Fig. 1.
Fig. 1.. Single-cell RNA sequencing analyses of circulating and siIEL CD8+ T cells responding to viral infection.
(A) Experimental setup. P14 CD45.1+CD8+ T cells were adoptively transferred into congenic CD45.2+ hosts one day prior to infection with LCMV-Armstrong. Splenocytes were harvested at 3, 5, and 6 days; splenocytes and siIEL CD8+ T cells were harvested at 4, 7, 10, 14, 21, 32, 60, and 90 days post-infection. Naïve T cells (CD44loCD62Lhi) were harvested from spleens of uninfected P14 TCR transgenic mice. Antigen-experienced P14 CD8+ T cells (CD45.1+Vα2+CD44hi) were sorted and processed for scRNA-seq with the 10X Genomics platform. (B to D) tSNE analysis of all scRNA-seq samples, where each individual sample (B), tissue (C), or time point (D) is represented by a unique color. (E) Relative expression of known regulators of circulating and tissue-resident memory CD8+ T cell differentiation superimposed on individual cells. (F) Differential gene expression in Day 4 splenic (teal) and siIEL (coral) CD8+ T cells, represented as expression relative to the mean expression among all cells; each row represents an individual cell and each column represents an individual gene. Threshold for differentially expressed genes was P < 0.05 *(two-sided Wilcoxon test) and an absolute fold-change > 2. (G) Cell cycle status of individual CD8+ T cells, inferred from transcriptional profiles.
Fig. 2.
Fig. 2.. Identification of a siIEL CD8+ T cell-enriched gene-expression profile.
(A) Gene-expression patterns of single splenic and siIEL CD8+ T cells responding to infection, where each row represents an individual cell, grouped by tissue within each time point, and each column represents an individual gene, grouped by module, represented as expression relative to the mean expression among all cells. Weighted gene co-expression network analyses of splenic and siIEL CD8+ T cells considered together were performed to derive gene modules. (B and C) Representation of each module among single CD8+ T cells in both the spleen and siIEL compartment over time, relative to the mean representation among all cells, depicted as a representation score superimposed on individual cells (B) or as violin plots showing the relative representation of each module in individual splenic (teal) versus siIEL CD8+ T cells (coral) (C). (D) Violin plots depicting gene-expression patterns of known or putative regulators of TRM cell differentiation (represented as transcripts per million, TPM), selected from siIEL CD8+ T cell-enriched modules, among single splenic (teal) or siIEL (coral) CD8+ T cells over time. (E) CD45.1+ P14 T cells were transduced with retrovirus encoding shRNA targeting Nr4a2, Junb, or Fosl2 (knockdown, KD), and mixed with CD45.1.2+ P14 T cells transduced with shRNA encoding control (non-target) shRNA at a 1:1 ratio of KD: non-target cells prior to adoptive transfer into CD45.2+ hosts that were subsequently infected with LCMV. 22–26 days later, splenic and siIEL CD8+ T cells were analyzed by flow cytometry. Ratio of KD: non-target P14 T cells within transduced P14 CD8+ T cells in the spleen (Tcirc) or within CD69+CD103+ siIEL P14 CD8+ T cells (TRM), normalized to the ratio of KD: non-target cells at the time of transfer. Values are normalized to Tcirc. *P<0.05, ****P<0.0001 (Student’s two-tailed t-test). Data were pooled from two independent experiments, with mean and SEM of n=8 mice per gene, where each dot represents an individual mouse.
Fig. 3.
Fig. 3.. Single-cell RNA sequencing analyses highlight heterogeneity among circulating CD8+ T cells.
(A) tSNE analysis of splenic CD8+ T cells; each plot represents an individual time point with each color representing a specific time point, as in Fig. 1B. (B) Relative expression (compared to mean expression among all spleen cells) of known regulators of circulating CD8+ T cell differentiation superimposed on individual spleen cells. (C and D) Similarity of gene-expression programs among single spleen cells to transcriptional signatures (derived from bulk RNA-seq profiles from FACS-sorted cells) of previously defined circulating CD8+ T cell subsets. (C) Similarity of gene-expression programs among single spleen cells to terminal effector (TE) (D7 KLRG1hiIL-7Rαlo, red) or memory-precursor (MP) (D7 KLRG1loIL-7Rαhi, blue) transcriptional signatures. (D) Similarity of gene-expression programs among single spleen cells to LLE (D35 CD62LloIL-7Rαlo, red), TEM (D35 CD62LloIL-7Rαhi, blue), and TCM (D35 CD62LhiIL-7Rαhi, green) cell transcriptional signatures.
Fig. 4.
Fig. 4.. Single-cell RNA sequencing analyses reveal functionally distinct subsets within the siIEL CD8+ T cell pool.
(A and B) Clustering analyses of siIEL CD8+ T cells from all time points (A) or cells at days 4, 60, and 90 post-infection (B); numbers represent different cluster annotations. (C and D) Expression of selected genes within single siIEL CD8+ T cells at day 60 (C) or 90 (D) post-infection, relative to the mean expression among siIEL CD8+ T cells at the indicated time point, demonstrating differential gene expression between Clusters 3 and 29 (C) or between Clusters 17 and 19 (D). (E to I) P14 CD8+ T cells were transferred into congenically distinct recipients 1 day prior to infection with LCMV. Splenic and siIEL CD8+ T cells were harvested at day 30 or 90 post-infection. (E) Representative flow cytometry plots displaying distribution of CD28 expression among total P14 T cells in the spleen (top) or CD69+CD103+ P14 T cells in the siIEL compartment (bottom). Numbers represent the percentage of total P14 T cells in each gate, and graphs to the right demonstrate the quantification of CD28lo (filled dots) and CD28hi (open circles) cells within the indicated population at each time point. Data are representative of (flow cytometry plots, left), or compiled from (graphs, right) 3 independent experiments where n=2–5 mice per experiment (10–11 total mice). (F) Quantification of CD127 (IL-7Rα) expression by CD28lo (gray) or CD28hi (black) subsets within the spleen (top) or siIEL (bottom) at day 30 post-infection, with representative flow cytometry plots shown on the left. Numbers represent Mean Fluorescence Intensity (MFI) of CD127 within the indicated population. Data are representative of (left) or compiled from (graph on right side) n=3 independent experiments with n=7 total mice, where each dot represents an individual mouse. (G) Representative flow cytometry plots displaying (top) distribution of CD28 expression at day 30 post-infection among total H-2Db GP33–41 tetramer+ endogenous CD8+ T cells in the spleen (left) or among H-2Db GP33–41 tetramer+ endogenous CD69+CD103+ CD8+ T cells in the siIEL compartment (right), or displaying (bottom) expression of CD127 by CD28lo (gray) or CD28hi (black) subsets within the indicated compartment. Numbers represent the percentage of H-2Db GP33–41 tetramer+ cells in each gate (top), or MFI of CD127 expression in the indicated population (bottom), quantified in the graph (right), where n=4 individual mice. (H and I) At day 30 post-infection, siIEL P14 T cells were sorted into CD127lo and CD127hi subsets and cultured in the presence of GP33–41 peptide in vitro. Quantification (right) of the proportion of CD127hi or CD127lo P14 siIEL CD8+ T cells producing IFN-γ and TNF-α (H), or IL-2 and TNF-α (I) as shown in representative flow cytometry plots (left). Data are representative of 2 independent experiments, with mean and SEM of n=4 wells of cultured cells per phenotype, derived from two separate pools of sorted cells plated in duplicate. *P<0.05, **P<0.01, ****P<0.0001 (Paired t-test, F and G, or Student’s two-tailed t-test, H and I).
Fig. 5.
Fig. 5.. Single-cell RNA sequencing analyses identify putative regulators of CD8+ TRM cell heterogeneity.
(A) CD45.1+ P14 T cells were transduced with retrovirus encoding shRNA targeting the indicated genes (knockdown, KD), and mixed with CD45.1.2+ P14 T cells transduced with shRNA encoding control (non-target) shRNA at a 1:1 ratio of KD: non-target cells prior to adoptive transfer into CD45.2+ hosts that were subsequently infected with LCMV, as in fig. S6. 22–23 days later, siIEL CD8+ T cells were analyzed by flow cytometry. Quantification of the percent of non-target or KD P14 CD8+ TRM cells (CD69+CD103+) expressing high levels of CD28 (bottom) as shown in representative flow cytometry plots (top). Data are representative of 1–2 experiments, with mean and SEM of n=4 mice per gene, where each dot represents an individual mouse. (B and C) P14 CD8+ T cells from mice with T cell-specific deletion of Ddx5 (Ddx5fl/fl CD4-Cre+: ‘Ddx5−/−’) were co-transferred at a 1:1 ratio with congenically distinct control P14 CD8+ T cells (Ddx5fl/fl CD4-Cre: ‘WT’) into congenically distinct hosts that were infected with LCMV one day later. At day 30 post-infection, spleens and siIEL were harvested for flow cytometric analysis. (B) Quantification of the percent of Ddx5−/− or WT P14 CD8+ TRM cells (CD69+CD103+) expressing high levels of CD28 (bottom) as shown in representative flow cytometry plots (top). (C) Lymphocytes harvested from siIEL compartment were cultured in the presence of GP33–41 peptide in vitro prior to staining for flow cytometric analysis. Cytokine production in Ddx5−/− or WT siIEL P14 CD8+ T cells, shown as quantification of the proportion of cells producing TNF-α and IFN-γ (bottom), as shown in representative flow cytometry plots (top). Data are compiled from (B) or representative of (C) two independent experiments with mean and SEM of n=4–12 mice, where each dot represents an individual mouse. *P<0.05, **P<0.01, ***P<0.001 (Paired t-test).
Fig. 6.
Fig. 6.. TRM precursors identified within the siIEL CD8+ T cell pool early in infection.
(A) Expression of selected genes within single siIEL CD8+ T cells at day 4 post-infection, relative to the mean expression among all cells, demonstrating differential gene expression between cells in Clusters 16 and 20. (B) Cell cycle status of siIEL CD8+ T cells at day 4 post-infection, inferred from transcriptional profiles. (C and D) P14 CD8+ T cells were adoptively transferred into congenic hosts one day prior to infection with LCMV. Splenic and siIEL CD8+ T cells were analyzed by flow cytometry at day 4 post-infection. Data are representative of two independent experiments, with n=2–3 mice per experiment. (C) Representative flow cytometry plots displaying distribution of IL-2Rα expression among total siIEL P14 CD8+ T cells at day 4 post-infection (left), or among total H-2Db GP33–41 tetramer+ endogenous siIEL CD8+ T cells at day 4 post-infection in mice that had not received adoptive transfer of P14 CD8+ T cells (right). (D) Quantification of Ezh2 expression among IL-2Rαlo (gray) and IL-2Rαhi (blue) P14 siIEL CD8+ T cells, as gated in (C), with representative flow cytometry plot (left) and quantification (right). Numbers represent Mean Fluorescence Intensity (MFI) of Ezh2 within the indicated population. Data are representative of (plot to left) or compiled from (graph to right) 2 independent experiments, with n=4 total mice, where each dot represents an individual mouse. (E) Schematic of experimental setup. CD45.1+ P14 CD8+ T cells were adoptively transferred into CD45.2+ congenic hosts one day prior to infection with LCMV. CD45.1+ P14 CD8+ T cells were collected from the siIEL compartment at day 4 post-infection and sorted based on expression of IL-2Rα as shown in (C). IL-2Rαhi and IL-2Rαlo populations were adoptively transferred into secondary hosts that had been infected with LCMV one day prior to transfer. 7 or 30 days later, siIEL P14 CD8+ T cells were analyzed by flow cytometry. (F) Quantification of the proportion of KLRGhi P14 CD8+ T cells present within the siIEL compartment at day 7 post-infection. Data were pooled from 2 independent experiments, with mean and SEM of n=7 (IL-2Rαlo) or 5 (IL-2Rαhi), where each dot represents an individual mouse. (G) Quantification of the percent of siIEL CD45.1+ P14 CD8+ CD69+CD103+ T cells derived from IL-2Rαlo (gray) or IL-2Rαhi (blue) day 4 siIEL cells at day 7 or day 30 post-transfer, with representative flow cytometry plots shown to the left. Day 7 data were pooled from 2 independent experiments, with mean and SEM of n=5 (IL-2Rαhi) or 6 (IL-2Rαlo) hosts, where each dot represents an individual mouse. Day 30 data were pooled from 3 independent experiments, with mean and SEM of n=4 (IL-2Rαhi) or 12 (IL-2Rαlo) hosts, where each dot represents an individual mouse. *P<0.05, **P<0.01 (Paired t-test, D, or Student’s two-tailed t-test, F and G).

References

    1. Chang JT, Wherry EJ, Goldrath AW, Molecular regulation of effector and memory T cell differentiation, Nat Immunol 15, 1104–1115 (2014). - PMC - PubMed
    1. Sallusto F, Lenig D, Forster R, Martin L, Lanzavecchia A, Two subsets of memory T lymphocytes with distinct homing potentials and effector functions, Nature 401, 708–712 (1999). - PubMed
    1. Jameson SC, Masopust D, Understanding Subset Diversity in T Cell Memory, Immunity 48, 214–226 (2018). - PMC - PubMed
    1. Omilusik KD, Nadjsombati MS, Shaw LA, Yu B, Milner JJ, Goldrath AW, Sustained Id2 regulation of E proteins is required for terminal differentiation of effector CD8+ T cells, Journal of Experimental Medicine 215, 773–783 (2018). - PMC - PubMed
    1. Olson JA, McDonald-Hyman C, Jameson SC, Hamilton SE, Effector-like CD8+ T cells in the memory population mediate potent protective immunity, Immunity 38, 1250–1260 (2013). - PMC - PubMed

Publication types