. 2020 Jun 2;117(22):12109-12120.
doi: 10.1073/pnas.1916584117. Epub 2020 May 15.

Contact-ID, a tool for profiling organelle contact sites, reveals regulatory proteins of mitochondrial-associated membrane formation

Affiliations

Contact-ID, a tool for profiling organelle contact sites, reveals regulatory proteins of mitochondrial-associated membrane formation

Chulhwan Kwak et al. Proc Natl Acad Sci U S A. .

Erratum in

Abstract

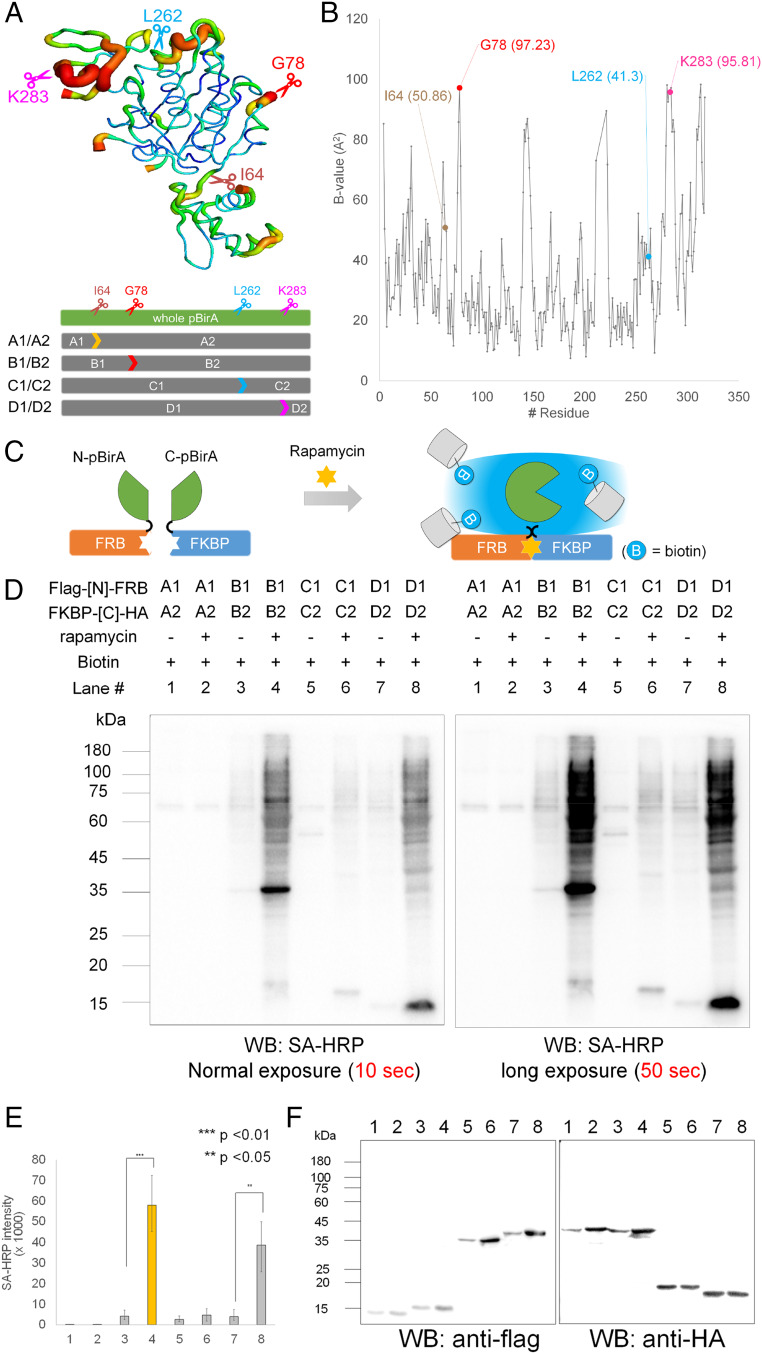
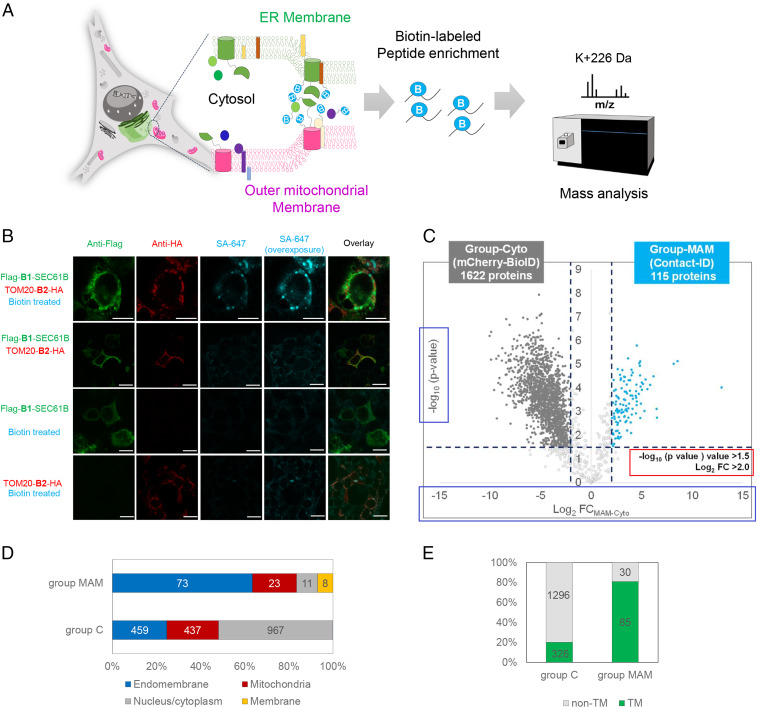
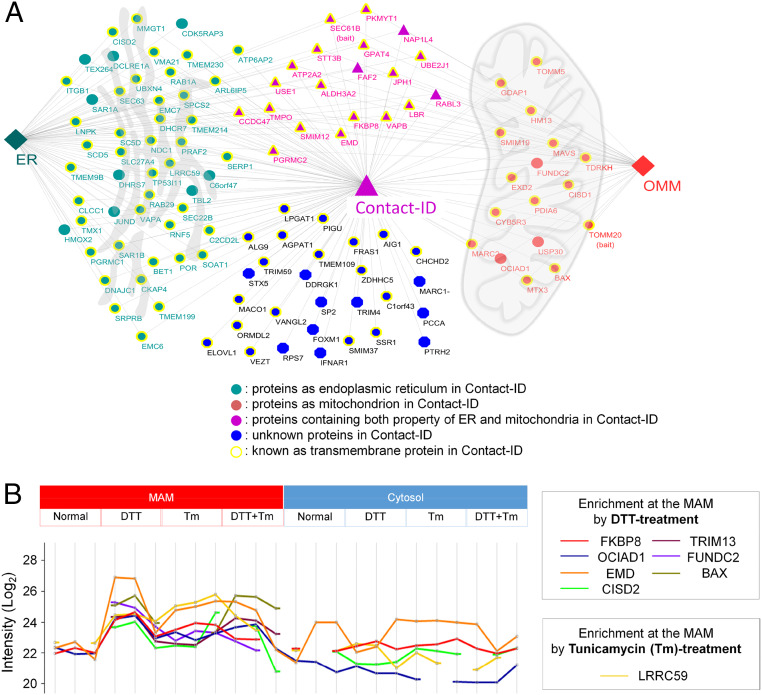
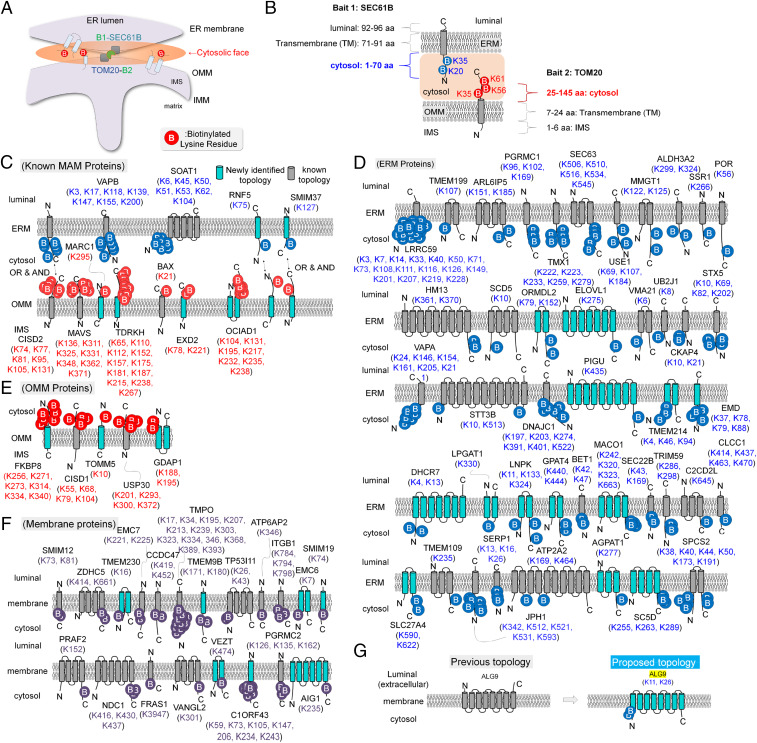
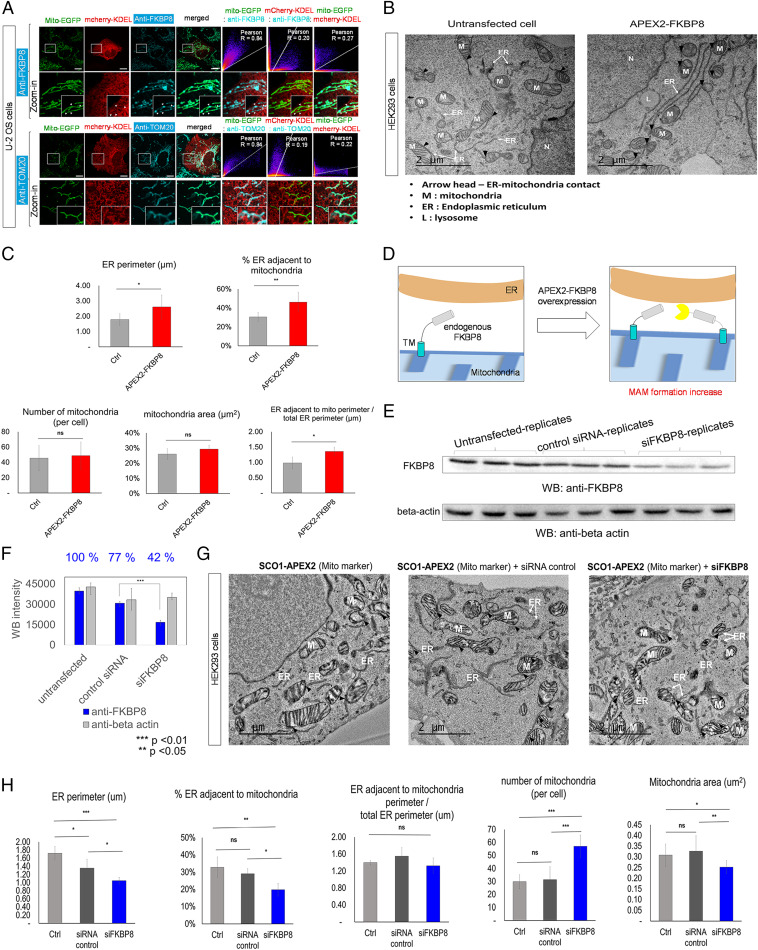
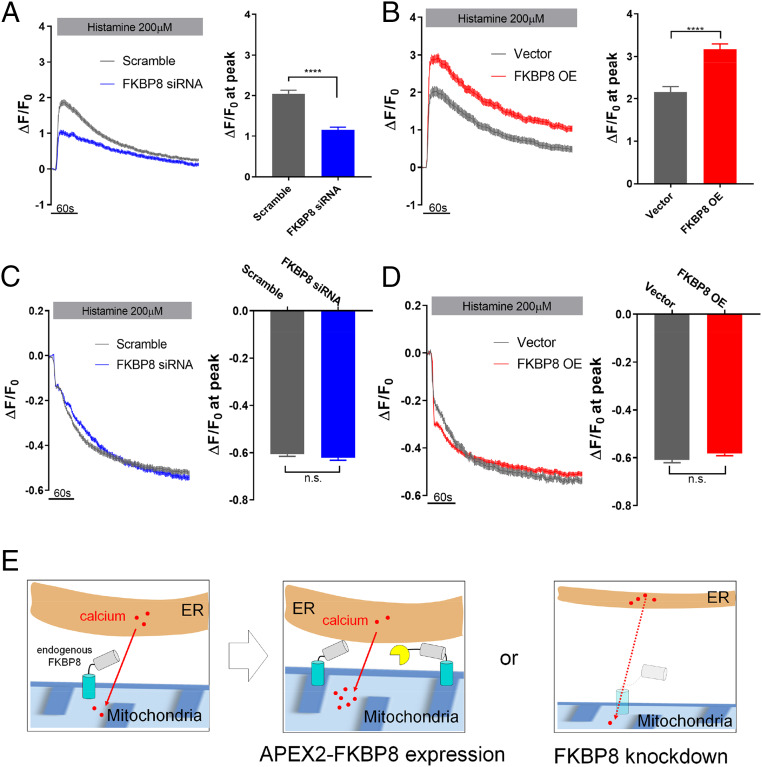
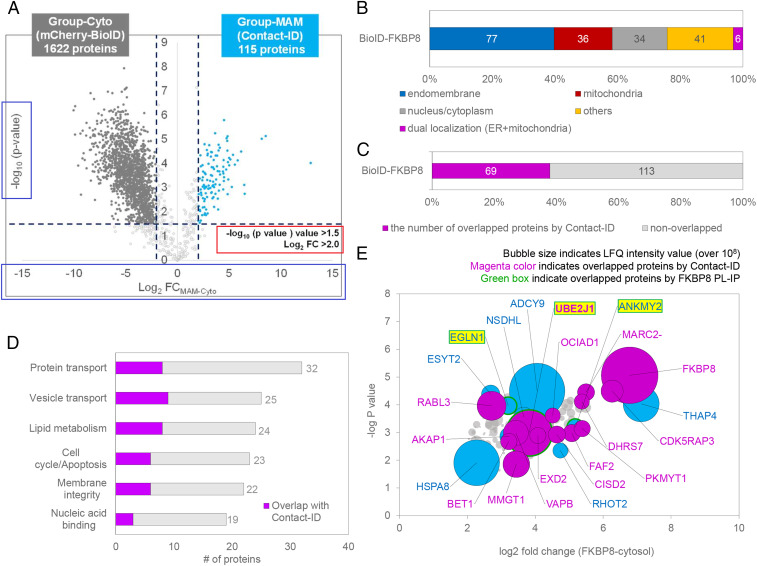
The mitochondria-associated membrane (MAM) has emerged as a cellular signaling hub regulating various cellular processes. However, its molecular components remain unclear owing to lack of reliable methods to purify the intact MAM proteome in a physiological context. Here, we introduce Contact-ID, a split-pair system of BioID with strong activity, for identification of the MAM proteome in live cells. Contact-ID specifically labeled proteins proximal to the contact sites of the endoplasmic reticulum (ER) and mitochondria, and thereby identified 115 MAM-specific proteins. The identified MAM proteins were largely annotated with the outer mitochondrial membrane (OMM) and ER membrane proteins with MAM-related functions: e.g., FKBP8, an OMM protein, facilitated MAM formation and local calcium transport at the MAM. Furthermore, the definitive identification of biotinylation sites revealed membrane topologies of 85 integral membrane proteins. Contact-ID revealed regulatory proteins for MAM formation and could be reliably utilized to profile the proteome at any organelle-membrane contact sites in live cells.

Keywords: FKBP8; membrane contact site; membrane protein topology; mitochondria-associated membrane (MAM); proximity labeling.


Conflict of interest statement

The authors declare no competing interest.

Figures

Fig. 1.
Fig. 1.
Design of Contact-ID based on the structural flexible region of Escherichia coli biotin ligase (BirA). (A) Crystal structure of wild-type E. coli biotin ligase (BirA PDB: 1HXD) and selected four split sites. (B) Plot of B factor (y axis) along the amino acid chain of the biotin ligase (x axis). (C) Schematic view of the restoration of biotinylating activity of split-BioIDs using the FRB–FKBP system in the presence of rapamycin. (D) Streptavidin-horseradish peroxidase (SA-HRP) Western blot result of biotinylated proteins from four split candidate pairs of pBirA in the FRB–FKBP system with or without rapamycin. Biotin (50 µM) was treated for 16 h. (E) SA-HRP signal intensity of triplicate experiments of D; ***P < 0.01, **P < 0.05. (F) Anti-HA and anti-FLAG Western blot results of the same samples of D.
Fig. 2.
Fig. 2.
ER–mitochondrial contact site mapping using Contact-ID. (A) Overview of the MAM proteome mapping workflow by Contact-ID. (B) Confocal microscopy imaging of MAM biotinylation by Contact-ID in HEK293T cells. Flag-B1-SEC61B was visualized by anti-Flag antibody (AF488-conjugated, green fluorescence channel) and TOM20-B2-HA was visualized by anti-HA antibody (AF568-conjguated, red fluorescence channel). Biotinylated proteins were visualized by AF647-conjugated streptavidin (Cy5 fluorescence channel). Control samples (i.e., no biotin treatment, Flag-B1-SEC61B expression only, and TOM20-B2-HA expression only) showed no significant biotinylation. (Scale bars, 20 µm.) (C) Volcano plots showing statistically significant enrichment of biotinylated proteins (group-MAM) by Contact-ID over the cytosolic biotinylated proteins (group C) by EGFP-BioID. Biotin (50 µM) treatment, 16 h. See Dataset S1 for details. (D) Subcellular distribution of proteins in group-MAM and in group-Cyto with prior annotated localization information in Uniprot. See Dataset S1 table for details. (E) Number of transmembrane proteins in group C and group-MAM.
Fig. 3.
Fig. 3.
Clusters of group-MAM proteins. (A) Organellar distribution of group-MAM proteins over the mitochondria, ER, and cytosol. (B) Enriched proteins at the MAM under the normal, DTT, tunicamycin (Tm), and DTT + tunicamycin-treated condition. Y value represents Log value of LFQ mass signal intensity of the biotinylated peptides from each labeled protein by Contact-ID (MAM) or by mCherry-BioID (cytosol) under the different conditions. see Dataset S5 for details.
Fig. 4.
Fig. 4.
Membrane protein topology identification of group-MAM proteins. (A) Overview of the Contact-ID generation of biotinylated sites at the cytosolic faces of organelle membranes. Since all of our MS-detected biotinylated sites by Contact-ID can be considered as sites on the cytosolic domain, we propose the membrane topology of all identified proteins in our current study. See Dataset S3 for details. (B) Representative results of biotin-labeled sites on the cytosolic domain of bait proteins (SEC61B and TOM20) of Contact-ID. (C) Observed membrane topologies of previously characterized MAM proteins in group-MAM. Newly identified membrane topologies in the current study are colored in light blue. (D) Observed membrane topologies of ERM-originated membrane proteins in group-MAM. (E) Observed membrane topologies of OMM-originated membrane proteins in group-MAM. (F) Observed membrane topologies of other endomembrane proteins in group-MAM. (G) Proposed membrane topology of ALG9 by our labeled site results. Previously annotated topologies of these proteins are shown on the Left, and our proposed topologies are shown on the Right.
Fig. 5.
Fig. 5.
Overexpression or knockdown of FKBP8 leads to mitochondrial–ER contact formation or perturbation. (A) Confocal microscopy imaging of endogenous FKBP8 and the outer mitochondrial marker TOM20 in U-2 OS cells. Endogenous FKBP8 and endogenous TOM20 were visualized by AF647-conjugated anti-FKBP8 and anti-TOM20, respectively (Cy5 channel). The green channel was used for imaging the mitochondrial marker (Mito-EGFP), and the red channel was used for imaging the ER marker (mCherry-KDEL). (Scale bars, 10 µm.) Pearson correlation results between fluorescence signals at each channel are shown on the Right. The punctate localizations of FKBP8 at the interfaces of mitochondria and ER tubules are marked by arrows in the digitally magnified (zoom-in) images. (B) TEM imaging of untransfected HEK293 cells (Left) and APEX2-FKBP8 transfected HEK293 cells (Right). APEX2-FKBP8 overexpressed cells showed increased mitochondria–ER contact sites and morphological changes of the mitochondria and ER. M, mitochondria; arrowhead, contact between the mitochondria and ER. (Scale bars, 2 μm.) (C) Statistical comparison of ER perimeter (micrometers), number and area (square micrometers) of mitochondria, number of contacts between the mitochondria and ER, and normalized ER length adjacent to mitochondria by total ER length in each group; *P < 0.01, **P < 0.005; ns, not significant. (D) Scheme of increased MAM formation by FKBP8 overexpression. (E) Inhibition of FKBP8 protein expression in HEK293 cells by siFKBP8 determined by Western blotting using anti-FKBP8 antibody. (F) Statistical analysis of FKBP8 knockdown by siFKBP8 from triplicate experiments; ***P < 0.001. (G) TEM imaging results of ER and mitochondrial morphological changes by FKBP8 knockdown. SCO1-APEX2 stable cell line (HEK293) was used for DAB/OsO4 staining in the mitochondrial cristae region (78). The siFKBP8-treated sample is shown on the Right. Untransfected (Left) and control siRNA-treated (Right) samples are shown as controls. (Scale bars, 2 μm.) M, mitochondria; arrowhead, contact between the mitochondria and ER. The morphometric analyses of the TEM images (total 250 μm2) were conducted from an average of 16 montage images per experimental group (from five different cells per group). (H) Statistical comparison of ER perimeter (micrometers), number and area (square micrometers) of mitochondria, number of contacts between the mitochondria and ER, and normalized ER length adjacent to mitochondria by total ER length in each group. *P < 0.05, **P < 0.005, ***P < 0.001.
Fig. 6.
Fig. 6.
FKBP8 regulates Ca2+ transfer from ER to mitochondria. (A and C) Plasmids for GCaMP6mt and R-CEPIA1er were cotransfected with scramble siRNA (gray), and FKBP8 siRNA (blue), respectively; 200 μM histamine was utilized to stimulate ER Ca2+ release and changes of GCaMP6mt, and R-CEPIA1er fluorescence was recorded simultaneously and normalized to the basal signals (F0). Bar graphs represent the peak amplitude of ΔF/F0 in mitochondria and ER. The data were assembled and analyzed from three independent sets of experiments. (B and D) An equivalent experimental setting used in A and C and applied to FKBP8 overexpression (red) and control (gray). Lines and bars represent mean ± SE n.s., not significant; *P < 0.05; ****P < 0.0001 determined by unpaired t test (cell numbers = 256 for scrambled siRNA, FKBP8 siRNA, FKBP8-OE, and 140 for vector control). (E) Schematic figure of FKBP expression level related to calcium transport between the ER and mitochondria.
Fig. 7.
Fig. 7.
BioID-FKBP8 reveals the FKBP8 interactome. (A) Volcano plots showing statistically significant enrichment of biotinylated proteins (182 proteins) by BioID-FKBP8 over the cytosolic biotinylated proteins by mCherry-BioID. See Dataset S4 for details. (B) Subcellular distribution of proteins in the selective biotinylated proteins (182 proteins) by BioID-FKBP8 with prior annotated localization information in Uniprot. (C) Number of overlapped proteins between group-MAM and BioID-FKBP8 proteins. (D) Functional clustering of BioID-FKBP8 proteins according to the annotated function in Uniprot. See Dataset S4 for details. (E) Representative biotinylated proteins by BioID-FKBP8. The bubble size indicates the mass signal intensity of the biotinylated peptide by BioID-FKBP8. Protein names for biotinylated peptides with a mass signal intensity over 108 au are shown in the volcano plot of A. Group-MAM proteins in this plot are shown in magenta and proteins found in coimmunoprecipitation after proximity-labeling experiment (PL-IP) are outlined in green (“green box”) (see Dataset S4 for details).

References

    1. Murley A., Nunnari J., The emerging network of mitochondria-organelle contacts. Mol. Cell 61, 648–653 (2016). - PMC - PubMed
    1. Elbaz Y., Schuldiner M., Staying in touch: The molecular era of organelle contact sites. Trends Biochem. Sci. 36, 616–623 (2011). - PubMed
    1. Phillips M. J., Voeltz G. K., Structure and function of ER membrane contact sites with other organelles. Nat. Rev. Mol. Cell Biol. 17, 69–82 (2016). - PMC - PubMed
    1. Rizzuto R., et al. , Close contacts with the endoplasmic reticulum as determinants of mitochondrial Ca2+ responses. Science 280, 1763–1766 (1998). - PubMed
    1. Vance J. E., Phospholipid synthesis in a membrane fraction associated with mitochondria. J. Biol. Chem. 265, 7248–7256 (1990). - PubMed

Publication types

LinkOut - more resources