. 2020 Jun 2;117(22):12050-12061.
doi: 10.1073/pnas.1916716117. Epub 2020 May 15.

Liquid-liquid phase separation of type II diabetes-associated IAPP initiates hydrogelation and aggregation

Affiliations

Liquid-liquid phase separation of type II diabetes-associated IAPP initiates hydrogelation and aggregation

Lior Pytowski et al. Proc Natl Acad Sci U S A. .

Abstract

Amyloidoses (misfolded polypeptide accumulation) are among the most debilitating diseases our aging societies face. Amyloidogenesis can be catalyzed by hydrophobic-hydrophilic interfaces (e.g., air-water interface in vitro [AWI]). We recently demonstrated hydrogelation of the amyloidogenic type II diabetes-associated islet amyloid polypeptide (IAPP), a hydrophobic-hydrophilic interface-dependent process with complex kinetics. We demonstrate that human IAPP undergoes AWI-catalyzed liquid-liquid phase separation (LLPS), which initiates hydrogelation and aggregation. Insulin modulates these processes but does not prevent them. Using nonamyloidogenic rat IAPP, we show that, whereas LLPS does not require the amyloidogenic sequence, hydrogelation and aggregation do. Interestingly, both insulin and rat sequence delayed IAPP LLPS, which may reflect physiology. By developing an experimental setup and analysis tools, we show that, within the whole system (beyond the droplet stage), macroscopic interconnected aggregate clusters form, grow, fuse, and evolve via internal rearrangement, leading to overall hydrogelation. As the AWI-adsorbed gelled layer matures, its microviscosity increases. LLPS-driven aggregation may be a common amyloid feature and integral to pathology.

Keywords: IAPP; aggregation; hydrogelation; insulin; liquid–liquid phase separation.


Conflict of interest statement

The authors declare no competing interest.

Figures

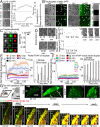
Fig. 1.
Fig. 1.
bIAPP, an assembly reporter. (A) bIAPP delays fibrillization. A total of 4 μM hIAPP, or 3.6 μM hIAPP-0.4 μM bIAPP, was incubated with 0.08 μM avidin D TR and 32 μM ThT. ThT fluorescence changes were monitored with lag phase, elongation rate, and plateau height depicted. *P < 0.03 when compared to hIAPP alone. a.u., arbitrary units. n = 3, error bars ± SEM. (B) bIAPP incorporates into mixed bIAPP-hIAPP fibrils. Plateaued reactions were adsorbed onto grids, labeled with streptavidin 10 nm gold particles, and negatively stained. (Scale bars, 200 nm.) Arrowheads show gold particles associated with peptide material. (Insets) Gold particle zoom up.
Fig. 2.
Fig. 2.
hIAPP undergoes LLPS, with droplets transitioning between a liquid and gel-like state, and further maturing into an amyloid aggregated state. (A) Droplet accumulation and size increase over time (Left, Movie S1). Timing of droplet appearance (LLPS onset) and size increase (droplet fusion) (plots: representative of three independent replicates; bar graph: n = 3). (B) Phase-separated droplets contain hIAPP as they label with ThS or bIAPP-avidin fluorescein. Insets: droplet zoom up. No LLPS was observed for ThS or avidin fluorescein (avi. fl.) alone. (C) hIAPP droplets are spherical. DIC, ThS labeled and rendered droplet surface (Left). Droplet sphericity (∼0.97) (Right). (D) Droplets fuse (white arrowheads) and relax into larger droplets (black arrowhead) (Movie S2), also indicated by droplet size growth (plots). (E) hIAPP molecule rearrangement within droplets at different times after LLPS onset. ThS-hIAPP fluorescence intensity recovery within a droplet bleached region, and fraction of mobile/immobile molecules. n = droplet number analyzed from at least three independent replicates. (F) hIAPP molecule exchange between droplets and bulk at different times after LLPS onset. ThS-hIAPP fluorescence intensity recovery within whole bleached droplets, and fraction of mobile/immobile molecules. n = droplet number analyzed from at least three independent replicates. (G) The AWI catalyses LLPS and aggregate size increases over time. (Left Top) A hIAPP reaction drop was pipetted on a MatTek dish, z stacks collected over time, and 3D reconstruction shows a side view of the AWI with bulk beneath. Three-dimensional projection of a hIAPP reaction with ThS (Middle Top), bIAPP-avidin fluorescein (Right Top), and ThS/bIAPP-avidin TR (Bottom). All images from one experiment have identical display settings.
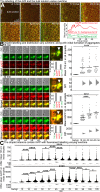
Fig. 3.
Fig. 3.
The labeling distribution varies over time. (A) AWI and bulk labeling variation (Movie S3). Merged images of ThS/bIAPP-avidin-TR labeling over time. Mean intensity of ThS or bIAPP-avidin-TR within droplets (Bottom Right). Background fluorescence (horizontal lines): bulk fluorescence at t0. (B) Droplet labeling variation and initial aggregation. Consecutive z slices from a reaction at 18, 30, and 45 min (Left). z4 zoom up: 2 droplets in a similar focal plane (Top Middle). All images have identical display settings. White arrowhead: small aggregate. Overlap percentage between the two fluorophores within z4 (Bottom Middle). Mean intensity (int.) of ThS or bIAPP-avidin-TR within droplets (Top Right). Background fluorescence (backgr.): bulk fluorescence at 10 min. ****P < 0.007. Difference (Diff.) between mean values, i.e., “effect size,” was determined relative to background fluorescence (Bottom Right). Circle: mean, black line: 95% confidence interval around the difference, derived from the mean bootstrap distribution. (C) Droplet interiors contain hIAPP, with labeling initially increasing before plateauing and decreasing. Mean intensity of ThS or bIAPP-avidin-TR within droplets, and difference between mean values quantified over time from Fig. 2G double-labeled z stacks. *P < 0.05, **P < 0.03, ****P < 0.007.
Fig. 4.
Fig. 4.
Fibrils and aggregates grow from the droplet surface and create an interconnected fibrillar network. (A) Aggregation. Consecutive z slices from reactions at 60, 70, and 80 min (Left). z5 zoom up: aggregate being the most in focus (Top Right). All images have identical display settings, identical to Fig. 3B for comparison. Overlap percentage between the two fluorophores within z5 (Bottom Right). (B) Fibrils (Top) and fibrillar aggregates (Bottom) develop on the droplet surface. Consecutive z slices from a 60-min reaction. All images have identical display settings. (C) At 150 min, hIAPP form fibrillar aggregates, growing from the droplet surface and interconnecting with one another. Maximum intensity projection (max. int. proj.), with a rendered surface of fibrillar aggregates (Left, Airyscan mode). ThS labels fibrillar aggregates on the droplet surface and the droplet interior, indicating amyloid cross-β nature (z slices, Right). (D) TEM of negatively stained hIAPP LLPS reactions at 90 and 180 min confirming the fibrillar nature of the species observed by confocal microscope. Arrowheads: black, fibril within droplets; black-white, fibrils growing from the droplet surface; white, fibrils extending from within the droplet to outside. Insets: zoom up. Arrow: droplet.
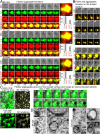
Fig. 5.
Fig. 5.
rIAPP undergoes LLPS, with the droplets in a liquid-like state and not aggregating. (A) rIAPP droplet accumulation and size increase over time (Movie S4). (B) Timing of droplet appearance and size increase (plots: representative of three independent replicate; bar graph: n = 3, ***P < 0.0004). (C) rIAPP droplets fuse (white arrowheads) and relax into larger droplets (black arrowhead). (D) Droplet internal rearrangement of rIAPP molecules at different times after LLPS onset. brIAPP fluorescence intensity recovery within a droplet bleached region, and fraction of mobile/immobile molecules. n = droplet number analyzed from at least three independent replicates. (E) rIAPP molecule exchange between droplets and bulk at different times after LLPS onset. brIAPP fluorescence intensity recovery within whole bleached droplets, and fraction of mobile/immobile molecules. n = droplet number analyzed from at least three independent replicates. (F) brIAPP labeling increased over time at the AWI, within and around droplets, but without aggregate formation. (G) Summary of the timings for LLPS and associated processes for hIAPP and rIAPP. Drop.: droplet.
Fig. 6.
Fig. 6.
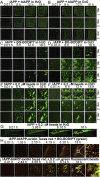
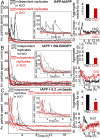
Insulin modulates hIAPP. (A) Insulin delays hIAPP LLPS (Movie S5). A total of 129 μM hIAPP-12.89 μM bIAPP-1.28 μM avidin-TR-100 μM ThS was incubated with 42.3 μM insulin. (B) Insulin effect is concentration dependent but not linear. Quantification of the timing of droplet appearance and size increase (plots: representative of three independent replicates; bar graph: n = 3, **P < 0.02 when compared to hIAPP alone). (C) Mean intensity of ThS or bIAPP-avidin-TR within droplet interiors of a hIAPP-42.3 μM insulin reaction. Background fluorescence (horizontal lines) was measured from bulk fluorescence at t0. (D) hIAPP-42.3 μM insulin droplets fuse (white arrowheads) and relax into larger droplets (black arrowhead). (E) Droplets internal rearrangement of hIAPP molecules in presence of 42.3 μM insulin at different times after LLPS onset. bIAPP-avidin-TR fluorescence intensity recovery within a droplet bleached region, and fraction of mobile/immobile molecules. n = droplet number analyzed from at least three independent replicates. Norm.: normalized. (F) hIAPP molecular exchange between droplets and bulk in presence of 42.3 μM insulin, at different times after LLPS onset. bIAPP-avidin-TR fluorescence intensity recovery within whole bleached droplets, and fraction of mobile/immobile molecules. n = droplet number analyzed from at least three independent replicates. Norm.: normalized. (G) 42.3 μM insulin delays hIAPP aggregation on the droplet surface (Top) and droplet interconnection by aggregates (Bottom). Consecutive z slices (Airyscan mode). (H) 42.3 μM insulin delays formation of interconnected aggregate meshworks. Consecutive z slices (Airyscan mode). (I) Overlap percentage between ThS and avidin-TR labeling over time for hIAPP-42.3 μM insulin. (J) Summary of the timings (in minutes unless otherwise stated) for LLPS and associated processes for hIAPP alone and in presence of insulin. Immob: immobility.
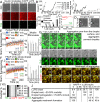
Fig. 7.
Fig. 7.
In the whole system, hIAPP aggregation at the AWI forms clusters. (AF) hIAPP aggregates accumulate at the AWI, forming “clusters” that become immobile. The 3.6 μM hIAPP-0.4 μM bIAPP-0.08 μM avidin D fluorescein in H2O (A) or D2O (B), 4 μM hIAPP-5.56 μM BG-BODIPY (green) in H2O (C) or D2O (D), 4 μM hIAPP-9.5 ± 0.4 × 10⁵ 0.2 μm green fluorescent beads in H2O (E) or D2O (F). Three-dimensional projections of z stacks (AWI facing the experimentalist and bulk behind) at relevant time points (n = 3 for each condition) (Movies S6–S11). (G) hIAPP aggregation spreads into the bulk (Movie S12). Four μM hIAPP-0.2 μm beads in H2O. Three-dimensional projections with the AWI viewed from the side and bulk above. BG-BODIPY (H) or 0.2 μm beads (I) colocalize with hIAPP. The 3.6 μM hIAPP-0.4 μM bIAPP-0.08 μM avidin D-TR in H2O was incubated with 5.56 μM BG-BODIPY (green) or 0.2 μm green fluorescent beads. Three-dimensional projections of z stacks (AWI facing the experimentalist and bulk behind) at relevant time points. Right: dashed box zoom up.
Fig. 8.
Fig. 8.
At the AWI, hIAPP aggregates move less and stop moving more quickly in D2O than in H2O, with the system being more homogeneous in D2O. AWI aggregates of Fig. 7 were tracked, and aggregate speed was calculated, along with that of mean flow. Average (Av.) particles (part.) speed with that of mean flow subtracted over time for 3.6 μM hIAPP-0.4 μM bIAPP (A), 4 μM hIAPP-5.56 μM BG-BODIPY (B), 4 μM hIAPP-9.5 ± 0.4 × 10⁵ 0.2 μm beads (C), in H2O or D2O. Insets: early time point zoom up. Aggregate mobility duration was calculated from the Left panels (Top Right). Variation coefficient (SD over mean) over time (Bottom Right). Error bars ± SEM *P < 0.05.
Fig. 9.
Fig. 9.
At the AWI, connected hIAPP aggregates move coordinately in local flow fields, form individual clusters that grow and fuse together. Four μM hIAPP-5.56 μM BG-BODIPY (green) in D2O. From aggregate tracking (Fig. 8), movement vectors and aggregate connectivity were determined. (A) Maximum intensity projections of an 18-h time course (Top), aggregate connectivity (red line: aggregates moving in the same direction, connectedness; black line: aggregates moving in opposite direction, nonconnectedness) (Middle), and movement vectors (Bottom). Dashed boxes: areas further examined in B and C. (B and C) Examples of aggregate connectivity (Top) and corresponding 3D projections (Bottom). Numbers indicate individual clusters of connected aggregates that evolve over time. White lines: connected aggregate clusters (projection and connectedness were superimposed and lines drawn around connected aggregates).
Fig. 10.
Fig. 10.
The viscosity of the AWI-adsorbed hIAPP layer increases over time, with D2O promoting higher and more homogeneous viscosities. (A) BG-BODIPY is viscosity sensitive. FLIM performed on BG-BODIPY-glycerol solutions of increased viscosities (28 to 630 cp), and fluorescence decay lifetime was determined. Linear relationship between the log of BG-BODIPY decay lifetime and the log of glycerol viscosity, with a very good fit. (B) FLIM images of the AWI region of 4 μM hIAPP-5.56 μM BG-BODIPY reactions, in H2O or D2O, at 5 or 21 h (n = 3 per condition). Insets: zoom up of representative AWI regions containing several fluorescence lifetime values (with brightness being increased). Lookup table: colors assigned for each fluorescence lifetime value, from red (short lifetime) to blue (long lifetime). (C) Fluorescence lifetime distribution. For each condition, fluorescence lifetimes and pixel frequencies for each peak were assigned from the histograms of fluorescence lifetime distribution (SI Appendix, Fig. S9). n = 3+ with multiple fields of view analyzed per replicate. Error bars ± SEM. *: lifetime peaks seen in fewer than three analyzed images. (D) Viscosity corresponding to fluorescence lifetime was assigned using the calibration curve from A. Dotted lines: lifetime segregation into five groups. Bar graphs: lifetime proportion for each condition within each group.

References

    1. Stefani M., Dobson C. M., Protein aggregation and aggregate toxicity: New insights into protein folding, misfolding diseases and biological evolution. J. Mol. Med. (Berl.) 81, 678–699 (2003). - PubMed
    1. Westermark P., Andersson A., Westermark G. T., Islet amyloid polypeptide, islet amyloid, and diabetes mellitus. Physiol. Rev. 91, 795–826 (2011). - PubMed
    1. Lomakin A., Teplow D. B., Kirschner D. A., Benedek G. B., Kinetic theory of fibrillogenesis of amyloid beta-protein. Proc. Natl. Acad. Sci. U.S.A. 94, 7942–7947 (1997). - PMC - PubMed
    1. Jean L., Lee C. F., Lee C., Shaw M., Vaux D. J., Competing discrete interfacial effects are critical for amyloidogenesis. FASEB J. 24, 309–317 (2010). - PubMed
    1. Chi E. Y., et al. , Amyloid-beta fibrillogenesis seeded by interface-induced peptide misfolding and self-assembly. Biophys. J. 98, 2299–2308 (2010). - PMC - PubMed

Publication types