. 2020 May 15;11(1):2417.
doi: 10.1038/s41467-020-15922-5.

A role for actin flexibility in thin filament-mediated contractile regulation and myopathy

Affiliations

A role for actin flexibility in thin filament-mediated contractile regulation and myopathy

Meera C Viswanathan et al. Nat Commun. .

Abstract

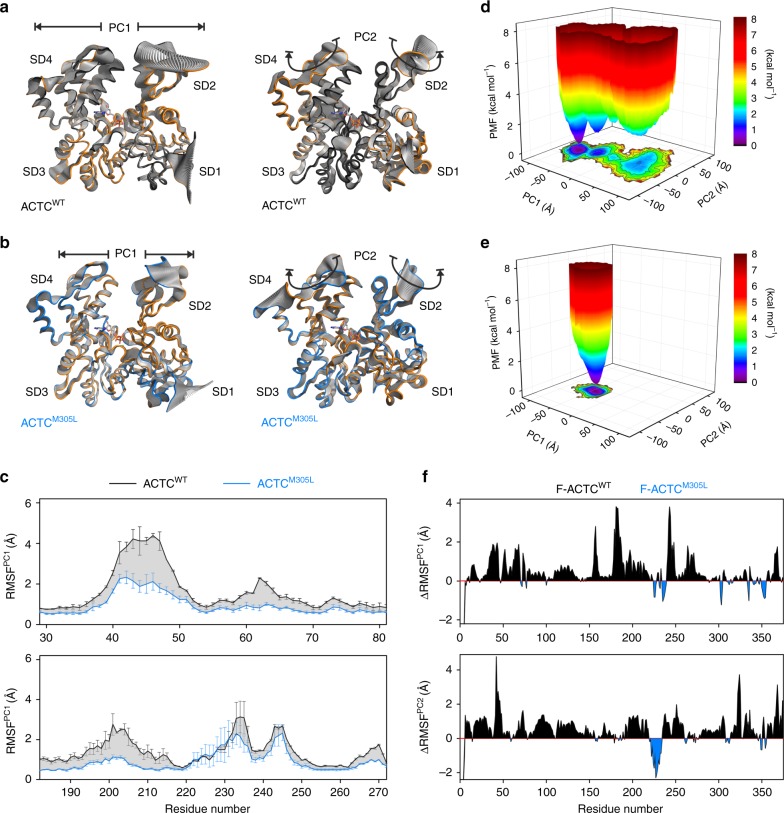
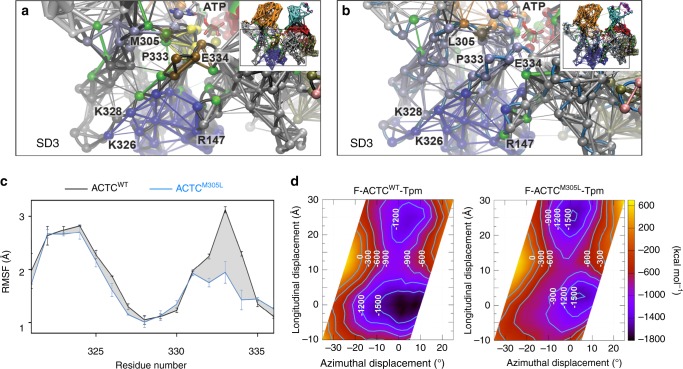
Striated muscle contraction is regulated by the translocation of troponin-tropomyosin strands over the thin filament surface. Relaxation relies partly on highly-favorable, conformation-dependent electrostatic contacts between actin and tropomyosin, which position tropomyosin such that it impedes actomyosin associations. Impaired relaxation and hypercontractile properties are hallmarks of various muscle disorders. The α-cardiac actin M305L hypertrophic cardiomyopathy-causing mutation lies near residues that help confine tropomyosin to an inhibitory position along thin filaments. Here, we investigate M305L actin in vivo, in vitro, and in silico to resolve emergent pathological properties and disease mechanisms. Our data suggest the mutation reduces actin flexibility and distorts the actin-tropomyosin electrostatic energy landscape that, in muscle, result in aberrant contractile inhibition and excessive force. Thus, actin flexibility may be required to establish and maintain interfacial contacts with tropomyosin as well as facilitate its movement over distinct actin surface features and is, therefore, likely necessary for proper regulation of contraction.


Conflict of interest statement

The authors declare no competing interests.

Figures

Fig. 1
Fig. 1. M305L actin incorporates evenly along Drosophila cardiac thin filaments.
a Composite confocal image of a full-length Hand > Act57BGFP.WT adult Drosophila heart tube. Four micrographs were acquired at ×40 magnification and computationally stitched together. Scale bar = 100 µm. b Fluorescent signals from Act57BGFP.WT and Act57BGFP.M305L actin, within fly cardiomyocytes, acquired at ×100 magnification. The GFP signals co-localized repetitively with TRITC-phalloidin (TRITC-Ph) signals. TRITC-Ph labels both transgenic and endogenous cardiac actin. Scale bar = 5 µm. c Fluorescent intensity line scans of sarcomeres in (b) reveal overlapping and congruent TRITC-ph (red) and GFP (green) signals, indicating that Act57BGFP.M305L mutant actin copolymerized with endogenous cardiac actin along the length of the thin filaments, similar to control Act57BGFP.WT transgenic actin.
Fig. 2
Fig. 2. M305L actin triggers restrictive cardiac physiology and impairs relaxation.
a M-mode kymograms generated from high-speed videos of beating, three-week-old Hand > Act57BWT and Hand > Act57BM305L hearts. These traces illustrate cardiac cycle dynamics and heart wall motion over time. Blue arrowheads demarcate the edges of the heart wall during diastole. Note the restricted diastolic diameter across the mutant cardiac tube. a′ Individual systolic intervals taken from the traces shown in (a). Relative to Hand > Act57BWT, Act57BM305L-expressing cardiac tubes exhibited prolonged periods of tension generation, diminished shortening, and slower relaxation rates. bf Heart-restricted expression of Act57BM305L mutant actin significantly altered several indices of cardiac function, irrespective of genetic background, relative to the expression of Act57BWT. Hand > , 4XHand > , and TinC > Act57BM305L Drosophila displayed decreased cardiac output, diastolic diameters, fractional shortening, and relaxation rates in addition to extended systolic periods relative to controls. SI/HP is the systolic interval over the time required for a complete cardiac cycle (i.e. diastolic plus systolic intervals). Significant differences between genotypes were determined using unpaired two-tailed t-tests (n = 31–45). *P ≤ 0.05, **P ≤ 0.01 and #P ≤ 0.0001. g Significant, incremental increases in cardiac diameters were observed in Hand > Act57BWT and Hand > Act57BM305L Drosophila following extra- and intracellular Ca2+ chelation and, again, upon blebbistatin exposure. Increases in cardiac dimensions due to EGTA-EGTA,AM and to blebbistatin were evaluated using repeated measures ANOVAs followed by Tukey’s multiple comparison tests of the matched groups (n = 30–31). #P ≤ 0.0001. h The change in cardiac diameter in response to EGTA-EGTA,AM was similar between Hand > Act57BWT and Hand > Act57BM305L flies as determined by two-tailed unpaired t-tests (n = 30–31). i Blebbistatin treatment resulted in a significantly greater degree of heart wall relaxation in Hand > Act57BM305L hearts relative to Hand > Act57BWT hearts. Two-tailed unpaired t-tests were used to distinguish significant differences in cardiac diameter changes between genotypes (n = 30-31). #P ≤ 0.0001. All data are presented as mean ± SEM. Source data are provided as a Source Data file.
Fig. 3
Fig. 3. M305L actin causes IFM hypercontraction and enhances Ca2+ sensitivity.
a Fluorescent micrographs of dorsal longitudinal IFMs (DLMs) of two-day-old Act88FWT and Act88FM305L Drosophila. Act88FWT/+, Act88FM305L/+, Act88FWT/Act88FWT;+, Act88FM305L/Act88FM305L;+ heterozygotes, and Act88FWT/Act88FWT homozygotes displayed normal DLM morphology with the six fibers spanning the length of the thorax. Act88FM305L/Act88FM305L homozygotes, however, demonstrated hypercontracted and torn DLMs. Scale bar = 250 µm. b Confocal images of consecutive sarcomeres along a single IFM myofibril from transgenic flies. Red, TRITC-phalloidin-labeled actin; Cyan, immunolabeled α-actinin. WT/+ = Act88FWT/+, 305/+ = Act88FM305L/+, WT/WT;+ = Act88FWT/Act88FWT;+, 305/305;+ = Act88FM305L/Act88FM305L;+, WT/WT = Act88FWT/Act88FWT, and 305/305 = Act88FM305L/Act88FM305L. IFM thin filament lengths did not significantly differ among the genotypes (Supplementary Fig. 5B) as determined by a Kruskal-Wallis one-way ANOVA with Dunn’s post hoc test (n = 200–211). Scale bar = 2.5 µm. c The power-pCa relationship of Act88FM305L/+ IFM fibers revealed a significant leftward shift in Ca2+ sensitivity (see Table 2), indicating less Ca2+ is required for activation. Significance was assessed via an unpaired two-tailed t-test (n = 10). Data points are mean ± SEM and were fit by the Hill equation. Source data are provided as a Source Data file.
Fig. 4
Fig. 4. High dose overexpression of M305L cardiac actin disrupts the IFM in a myosin-dependent fashion.
a Quantitative western blot analysis of Act57BGFP.WT and endogenous actin was performed on IFMs from the progeny of Act88F x yw (control) and Act88F > Act57BGFP.WT Drosophila raised at 25 °C and 29 °C, two days after eclosion. Representative western blot, probed with antibodies that targeted GFP, actin, and GAPDH, showing expression of Act57BGFP.WT actin in Act88F > Act57BGFP.WT flies and an absence of GFP-actin in control IFMs. The GFP-actin intensities (normalized to GAPDH) were significantly higher in flies raised at 29 °C. Actin intensities (normalized to GAPDH) revealed that Act88F > Act57BGFP.WT Drosophila raised at 29 °C had a significant reduction in non-tagged, endogenous IFM actin. Quantification was performed on six independent biological replicates with three technical replicates each. Significance was assessed via one-way ANOVA with Tukey’s multiple comparison test. *P ≤ 0.05, **P ≤ 0.01; §P ≤ 0.01 relative to Act88F x yw at 25 °C or 29 °C. All data are presented as mean ± SEM. Source data are provided as a Source Data file. b Fluorescent micrographs of dorsal longitudinal IFMs (DLMs) of two-day-old Act88F > Act57BWT and Act88F > Act57BM305L Drosophila. Act88F > Act57BM305L flies raised at 25 °C displayed similar IFM morphology to Act88F > Act57BWT flies. Conversely, Act88F > Act57BM305L flies raised at 29 °C, with elevated mutant actin, showed hypercontracted IFMs, with the middle fibers pulling away from anterior attachment sites. A reduction in IFM myosin content, due to the presence of a single copy of the Mhc10 (IFM-specific MHC null) allele, had no effect on the gross DLM morphology of Act88F > Act57BWT;Mhc10/+ Drosophila (raised at 29 °C). Act88F > Act57BM305L;Mhc10/+ Drosophila (raised at 29 °C) displayed a complete rescue of the hypercontracted phenotype. Scale bar = 250 µm.
Fig. 5
Fig. 5. The M305L mutation decreases actin flexibility in MD simulations.
a Projections of the largest structural fluctuations according to the first principal component (PC) (left panel) and the second PC (right panel) of a representative cMD simulation of an ACTCWT monomer. The projections indicate major positional deviations of SD2 and SD4, which follow hinge domain (PC1) as well as rotational movements (PC2). b Projections of PC1 and PC2 of a representative ACTCM305L monomer cMD simulation illustrate decreased protein motions compared to wildtype. c Root mean square fluctuations along PC1 of SD2 (upper panel) and SD4 (lower panel) calculated from monomer cMD simulations. Both SD2 and SD4 show markedly higher fluctuations in ACTCWT vs. ACTCM305L. Data are represented as mean ± SEM (n = 3). d The free energy landscape of ACTCWT, calculated as the potential of mean force (PMF) according to the largest structural motions in the protein, as derived from PCA of two combined 500 ns enhanced sampling MD simulations. The color bar represents the PMF value in kcal mol−1. e The free energy landscape of ACTCM305L shows a much narrower energy basin as compared to ACTCWT, indicating a highly populated state with reduced flexibility. Data were obtained from two combined 500 ns enhanced sampling MD simulations. The color bar represents the PMF value in kcal mol−1. f Root mean square fluctuations obtained from F-actin cMD simulations, given as the difference of ACTCWT−ACTCM305L, along PC1 (upper panel) and PC2 (lower panel) confirm that the major protomer structural fluctuations persist in the filamentous actin form, and they are decreased in mutant actin. Source data are provided as a Source Data file.
Fig. 6
Fig. 6. ACTCM305L exhibits altered communication pathways and coupled motions and distorts F-actin–Tpm electrostatic energy landscapes.
a Dynamical network analysis of cMD simulations of an ACTCWT Tpm-interacting subregion revealed a high degree of coupled motions, represented by the thickness of the connections and weighted according to the correlation data obtained from PCA. Clustered network communities were identified using the Girvan–Newman algorithm and colored individually, indicating regions of concerted movements. Critical residues and connections between two network communities are presented in green. P333 and E334 formed a separate community (brown) that maintained some flexibility and moved independently with respect to K326 and K328. Inset: dynamical network analysis of an entire ACTCWT protomer (see Supplementary Fig. 10A) demarcating the enlarged region discussed above. b Dynamical network analysis of cMD simulations of ACTCM305L showed that the coupled motions of the Tpm-interacting subregion around P333 and E334 differed from those of ACTCWT and moved in concert with K326 and K328 and the community surrounding L305 (light blue). Inset: dynamical network analysis of an ACTCM305L protomer (see Supplementary Fig. 10B) demarcating the enlarged region discussed above. c Root mean square fluctuations (RMSF) of Cα atoms along a stretch of actin residues that forms stable interactions with and facilitates inhibitory positioning of Tpm, measured over the course of enhanced sampling MD simulations. Data are represented as mean ± SEM (n = 2). d Average electrostatic energy landscapes for wildtype (left) and M305L F-actin–Tpm (right). The origin is set at 0,0, which represents the previously determined energy minimum of the inhibitory, A/B configuration for wildtype F-actin–Tpm, where Tpm is located in a position that would impede myosin binding. The plot is contoured with isolines between −1500 and 0 kcal mol−1 in increments of 300 kcal mol−1. Note, the broad well around the origin in the wildtype plot is shallower and narrower in the mutant F-actin–Tpm plot. Additionally, a second equivalent energy well is located distal to the A/B site along the mutant filament, which might be predicted to bias Tpm to a non-inhibitory location. Source data are provided as a Source Data file.

References

    1. Maron BJ, Maron MS, Semsarian C. Genetics of hypertrophic cardiomyopathy after 20 years: clinical perspectives. J. Am. Coll. Cardiol. 2012;60:705–715. doi: 10.1016/j.jacc.2012.02.068. - DOI - PubMed
    1. Semsarian C, Ingles J, Maron MS, Maron BJ. New perspectives on the prevalence of hypertrophic cardiomyopathy. J. Am. Coll. Cardiol. 2015;65:1249–1254. doi: 10.1016/j.jacc.2015.01.019. - DOI - PubMed
    1. Green EM, et al. A small-molecule inhibitor of sarcomere contractility suppresses hypertrophic cardiomyopathy in mice. Science. 2016;351:617–621. doi: 10.1126/science.aad3456. - DOI - PMC - PubMed
    1. Tardiff JC. Thin filament mutations: developing an integrative approach to a complex disorder. Circ. Res. 2011;108:765–782. doi: 10.1161/CIRCRESAHA.110.224170. - DOI - PMC - PubMed
    1. Marston SB. How do mutations in contractile proteins cause the primary familial cardiomyopathies? J. Cardiovasc Transl. Res. 2011;4:245–255. doi: 10.1007/s12265-011-9266-2. - DOI - PubMed

Publication types

MeSH terms

LinkOut - more resources