Observational Study
. 2020 May 15;11(1):2448.
doi: 10.1038/s41467-020-16222-8.

HIV-associated gut dysbiosis is independent of sexual practice and correlates with noncommunicable diseases

Affiliations
Observational Study

HIV-associated gut dysbiosis is independent of sexual practice and correlates with noncommunicable diseases

I Vujkovic-Cvijin et al. Nat Commun. .

Abstract

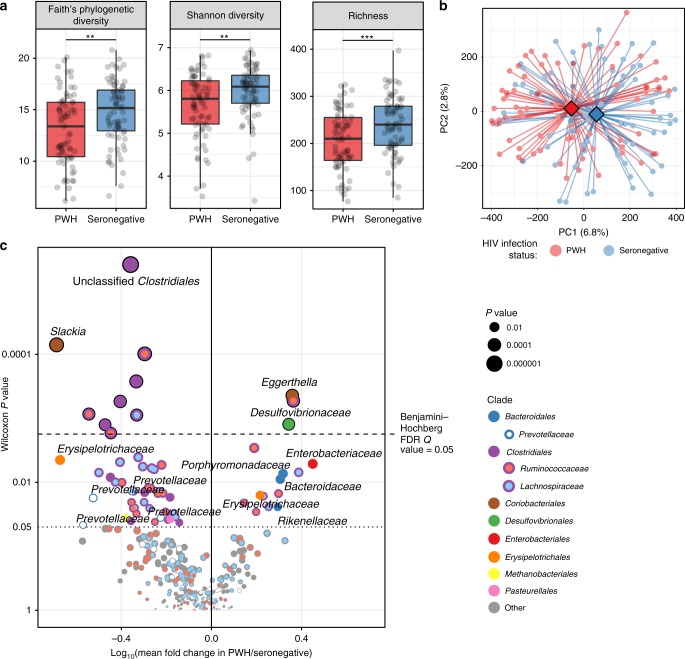
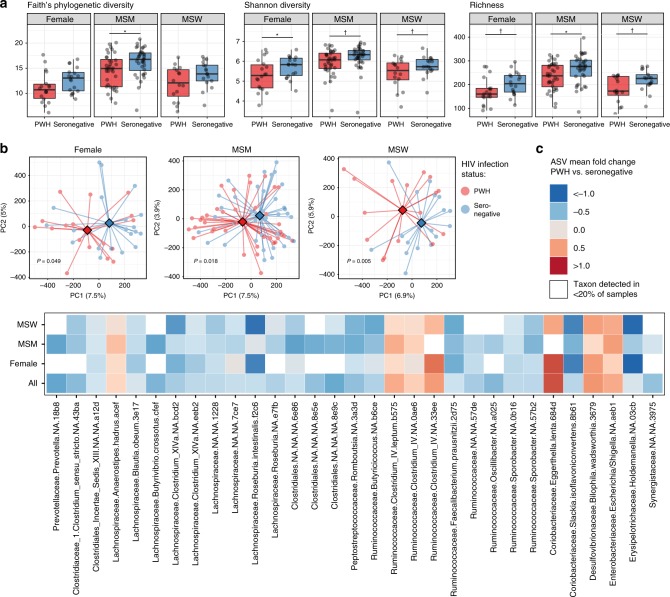
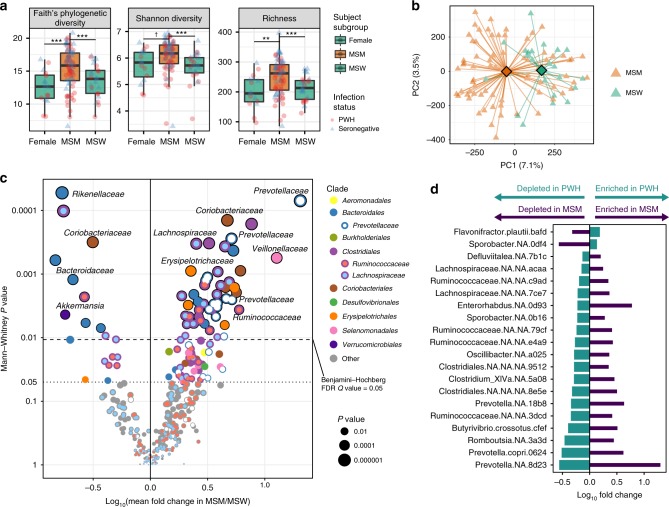
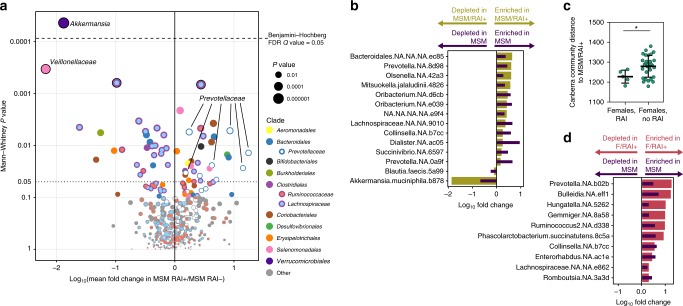
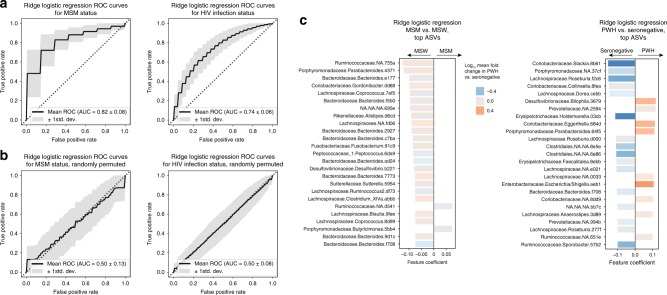
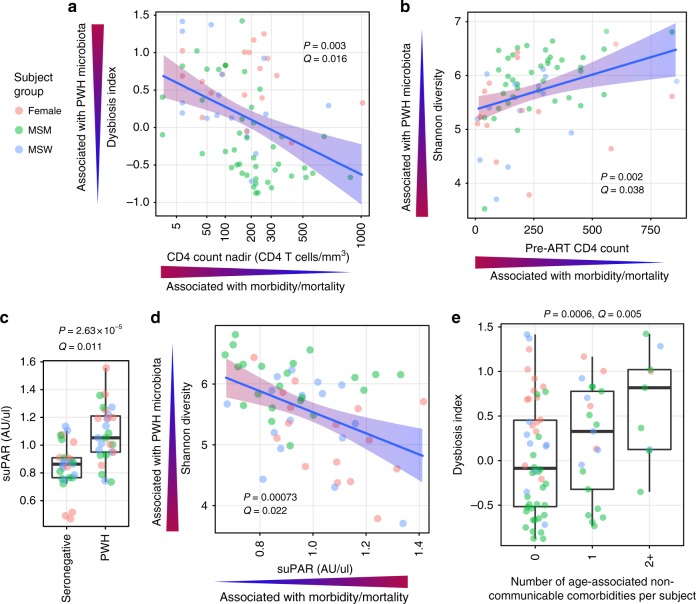
Loss of gut mucosal integrity and an aberrant gut microbiota are proposed mechanisms contributing to chronic inflammation and increased morbidity and mortality during antiretroviral-treated HIV disease. Sexual practice has recently been uncovered as a major source of microbiota variation, potentially confounding prior observations of gut microbiota alterations among persons with HIV (PWH). To overcome this and other confounding factors, we examine a well-powered subset of AGEhIV Cohort participants comprising antiretroviral-treated PWH and seronegative controls matched for age, body-mass index, sex, and sexual practice. We report significant gut microbiota differences in PWH regardless of sex and sexual practice including Gammaproteobacteria enrichment, Lachnospiraceae and Ruminococcaceae depletion, and decreased alpha diversity. Men who have sex with men (MSM) exhibit a distinct microbiota signature characterized by Prevotella enrichment and increased alpha diversity, which is linked with receptive anal intercourse in both males and females. Finally, the HIV-associated microbiota signature correlates with inflammatory markers including suPAR, nadir CD4 count, and prevalence of age-associated noncommunicable comorbidities.


Conflict of interest statement

PR reports independent scientific grant support from Gilead Sciences, Merck & Co, and ViiV Healthcare through his institution; scientific advisory board participation for Gilead Sciences, ViiV Healthcare, Merck & Co., and Teva Pharmaceutical Industries Ltd., for which his institution has received remuneration. The remaining authors declare no competing interests.

Figures

Fig. 1
Fig. 1. Gut microbiota composition differs between PWH and uninfected controls.
a Alpha diversity measures are shown for all participants, grouped as PWH and seronegative controls (n = 142, two-tailed paired t-test P = 0.0012, P = 0.0012, P = 0.0004, respectively). Boxes denote inter-quartile range, bar denotes median, and whiskers denote range. b Principal coordinates analysis (PCoA) plot based on the Canberra beta diversity metric with centroids depicted as diamonds for PWH and seronegative controls. Community differences were verified by PERMANOVA, P = 0.001. c Volcano plot depicting ASVs (operational taxonomic units, referring to dada2 sequence variants) in differential abundance between PWH and seronegative controls using the paired non-parametric Wilcoxon signed-rank test, with pairs of PWH and controls matched for sex, sexual practice, age, BMI, and birth country. Benjamini–Hochberg false discovery rate Q-value cutoff of 0.05 is shown. ASVs are colored by either their family (for Lachnospiraceae, Ruminococcaceae, and Prevotellacaeae) or order (all else), and families of selected taxa are denoted by text. *P < 0.05, **P < 0.005, ***P < 0.001.
Fig. 2
Fig. 2. Gut microbiota composition differences are evident within subgroups.
a Alpha diversity measures are shown for the three sex/sexual practice subgroups (n = 36 females, n = 72 MSM; men who have sex with men, n = 34 MSW; men who have sex with women), split by PWH and seronegative controls. Paired two-tailed t-tests were used to test significance of differences between groups (P = 0.022, P = 0.048, P = 0.064, P = 0.061, P = 0.080, P = 0.022, P = 0.056, respectively, for those denoted with bar). Boxes denote inter-quartile range, bar denotes median, and whiskers denote range. b PCoA plot based on Canberra beta diversity metric with centroids depicted as diamonds for PWH and seronegative controls. Community differences were verified by PERMANOVA (Female P = 0.04998; MSM P = 0.005; MSW P = 0.018). c Tile plot showing mean fold change of ASVs among all PWH vs. seronegative participants, with representations of log mean fold change depicted per subgroup for significant ASVs. ASVs with Wilcoxon signed-rank significance P < 0.0125 in the comparison of PWH vs. seronegative among all paired participants together (including all three subgroups) are shown. White squares denote ASV being present in fewer than 20% of samples within the given subgroup. P < 0.10, *P < 0.05.
Fig. 3
Fig. 3. Sexual practice exerts major impact on gut microbiota composition.
a Alpha diversity measures are shown for the three sex/sexual practice subgroups (n = 16 female, n = 72 MSM, n = 25 MSW), with participants matched for birth country (Netherlands). Faith’s phylogenetic diversity P = 3 × 10−7, Shannon Diversity P = 2.3 × 10−6, Richness P = 3.2 × 10−7 by Kruskal–Wallis tests. P < 0.10, *P < 0.05, **P < 0.005, ***P < 0.001 by Mann–Whitney U-tests. Boxes denote inter-quartile range, bar denotes median, and whiskers denote range. b Principal coordinates analysis (PCoA) plot based on Canberra beta diversity metric with centroids depicted as diamonds for MSM and MSW. Shown are participants matched for birth country (Netherlands) and infection status between the comparator groups of MSM and MSW (n = 72 MSM [36 PWH and 36 seronegative] vs. n = 22 MSW [11 PWH and 11 seronegative]). Community differences were verified by PERMANOVA, P = 0.001. c Volcano plot depicting ASVs in differential abundance between MSM and MSW matched for infection status and birth country, using the unpaired non-parametric Mann–Whitney U test. ASVs are colored by either their order or family, and families of selected taxa are denoted by text. d A comparison of abundance trends among ASVs significantly differing in both the comparison of MSM vs. MSW and PWH vs. uninfected controls. ASVs were selected by P-value < 0.05 in both comparisons (paired Wilcoxon for PWH vs. uninfected, unpaired Mann–Whitney for MSM vs. MSW). Directionality of ASV abundances are in opposition to each other and refute the expectation that having MSM status enriches for the same taxa as does HIV infection (Fisher’s exact test P < 0.001).
Fig. 4
Fig. 4. Recent sexual practice and lifetime sexual practice impacts gut microbiota composition regardless of sex.
a Volcano plot depicting ASVs in differential abundance between MSM/RAI+ (men who have sex with men that experienced receptive anal intercourse within the last 6 months prior to sampling, n = 44) and MSM/RAI− (men who have sex with men that did not experience receptive anal intercourse within the last 6 months prior to sampling, n = 28), matched for infection status. b Overlap in abundance trends among the top 100 taxa in differential fold abundance among MSM vs. MSW (n = 72 MSM, n = 22 MSW) and MSM/RAI+ vs. MSM/RAI− (n = 44 MSM/RAI+, n = 28 MSM/RAI−). Mann–Whitney tests were performed on each ASV for both comparisons, and shown are taxa that reached P < 0.05 on both lists. c Average Canberra community distances to MSM/RAI+ were calculated for each female participant sample that reported receptive anal intercourse within 6 months prior to sampling (F/RAI+, n = 5) and female participants that reported no such activity (F/RAI−, n = 28). F/RAI+ gut communities were significantly more similar to MSM/RAI+ than were those for F/RAI−. Unpaired two-tailed t-test P = 0.0496. Middle bar denotes average and error bars represent SD. d Overlap in abundance trends among the taxa that reached P < 0.05 in both comparisons of MSM vs. MSW and F/RAI+ vs. F/RAI− (Fisher’s exact test P = 0.077), as performed in b.
Fig. 5
Fig. 5. Gut microbiota profiles robustly segregate samples by HIV infection status and sexual preference.
a The ridge logistic regression application of machine learning was used to test robustness of differences between MSM vs. MSW (n = 72 MSM, n = 22 MSW), and PWH vs. uninfected (n = 71 PWH, n = 71 seronegative). Both MSM status and HIV infection status exhibited robust signatures by which ridge logistic regression could predict the classification status of unseen samples with high accuracy (AUROC = 0.84 for MSM vs. MSW with P = 0.015, AUROC = 0.73 for PWH vs. seronegative with P = 0.017). b Sample classifications (e.g. MSM, MSW, PWH, seronegative) were randomly permuted to introduce noise into the dataset and quantify capacity for machine learning to classify persons based on spurious data. Random class label permutation demonstrated no classification accuracy to spurious data (AUROC = 0.5 for both MSM vs. MSW and PWH vs. uninfected). c Top ASV features that informed models for ridge logistic regression predictions of MSM vs. MSW and PWH vs. seronegative. Feature coefficients represent extent to which each ASV was weighted to represent the given class (positive for MSM vs. MSW indicated ASV was indicative of MSM; positive for PWH vs. seronegative was indicative of PWH). Bars are color-coded by log mean fold change in PWH vs. seronegative, and show a lack of correlation between ASVs informative for predicting MSM status and those altered in abundance in PWH.
Fig. 6
Fig. 6. HIV-associated gut microbiota features correlate with markers of HIV disease progression, immune activation, as well as comorbidity prevalence.
Linear mixed effects (LME) models were used to control for subgroup (F, MSM, MSW) as random effects for all analyses depicted. Linear regression lines denoted in blue with 95% confidence intervals depicted as a gradient with red representing directions for both independent and dependent variables that are associated with the PWH state (e.g. high dysbiosis index, low nadir CD4 count) and blue representing the seronegative state. a ‘Dysbiosis Index’ (DI) correlates with nadir CD4 (count/mm3), LME P = 0.003, Benjamini–Hochberg Q = 0.017, among PWH subjects (n = 80). b Shannon alpha diversity correlates with pre-ART CD4 count, LME P = 0.002, Q = 0.038. c suPAR concentrations in plasma are strongly elevated in PWH (n = 27) compared to matched seronegative controls (n = 27) by paired Wilcoxon signed-rank test. Benjamini–Hochberg Q-values calculated with consideration of all 1305 plasma markers quantitated by aptamer-based SomaScan assay. Boxes denote inter-quartile range, bar denotes median, and whiskers denote range. d Shannon alpha diversity correlates with plasma suPAR levels, LME P = 0.00073, Q = 0.022, n = 54 PWH. e Number of comorbidities experienced by PWH participants (n = 80) by time of sampling correlates with DI, LME P = 0.0006, Q = 0.005.

References

    1. Schouten J, et al. Cross-sectional comparison of the prevalence of age-associated comorbidities and their risk factors between HIV-infected and uninfected individuals: the AGEhIV cohort study. Clin. Infect. Dis. 2014;59:1787–1797. doi: 10.1093/cid/ciu701. - DOI - PubMed
    1. Wilson EM, Sereti I. Immune restoration after antiretroviral therapy: the pitfalls of hasty or incomplete repairs. Immunol. Rev. 2013;254:343–354. doi: 10.1111/imr.12064. - DOI - PMC - PubMed
    1. Pickard JM, Zeng MY, Caruso R, Nunez G. Gut microbiota: role in pathogen colonization, immune responses, and inflammatory disease. Immunol. Rev. 2017;279:70–89. doi: 10.1111/imr.12567. - DOI - PMC - PubMed
    1. Hofer U. Microbiome: a mucus colonizer manages host metabolism. Nat. Rev. Microbiol. 2013;11:430–431. - PMC - PubMed
    1. Pereira LMS, Gomes STM, Ishak R, Vallinoto ACR. Regulatory T cell and Forkhead Box Protein 3 as modulators of immune homeostasis. Front. Immunol. 2017;8:605. doi: 10.3389/fimmu.2017.00605. - DOI - PMC - PubMed

Publication types