. 2020 May 15;11(1):2432.
doi: 10.1038/s41467-020-16336-z.

Black indium oxide a photothermal CO2 hydrogenation catalyst

Affiliations

Black indium oxide a photothermal CO2 hydrogenation catalyst

Lu Wang et al. Nat Commun. .

Abstract

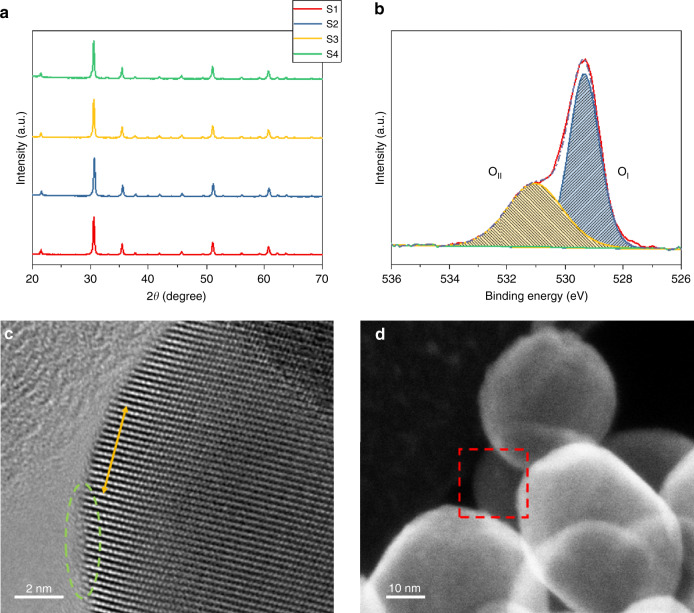
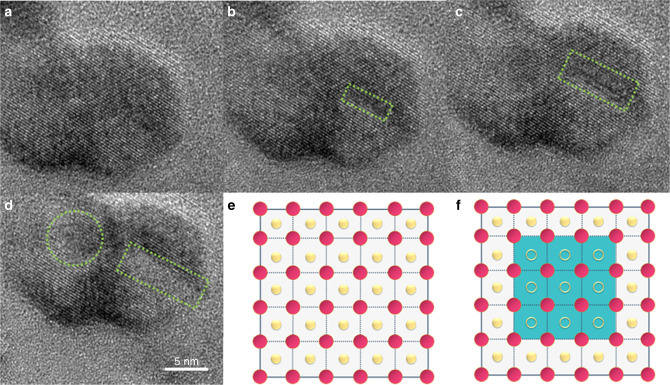
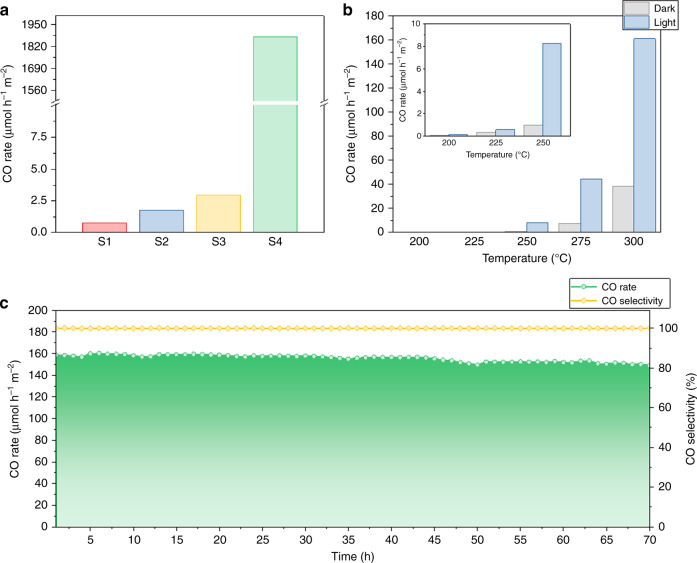
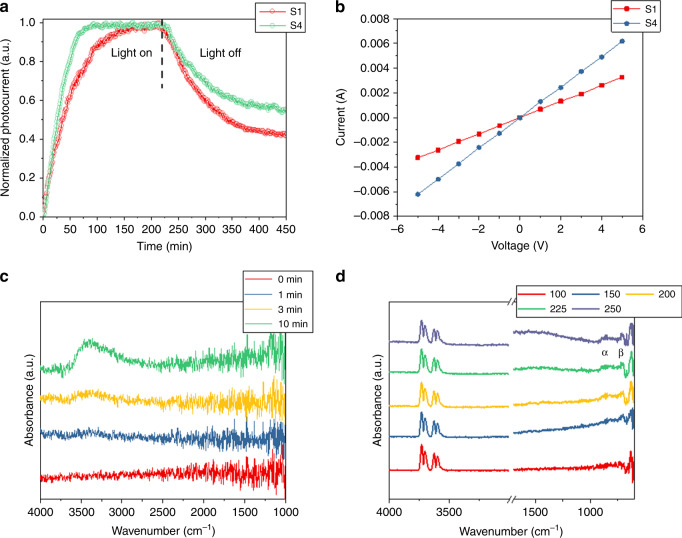
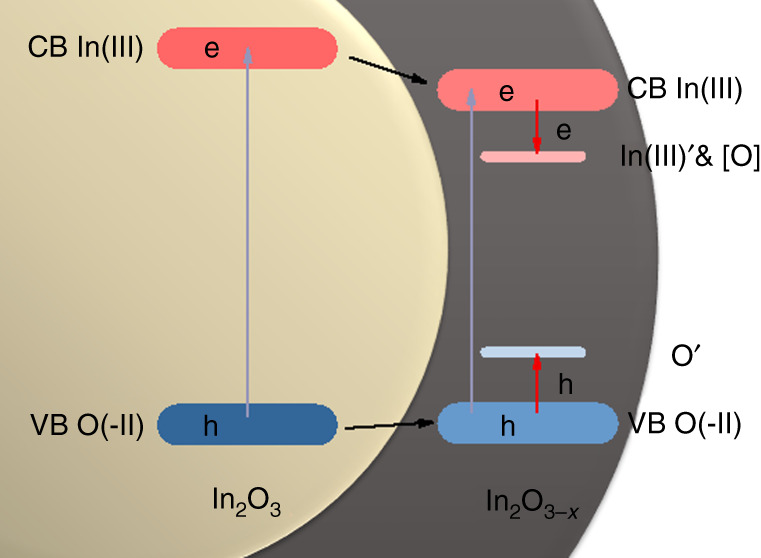
Nanostructured forms of stoichiometric In2O3 are proving to be efficacious catalysts for the gas-phase hydrogenation of CO2. These conversions can be facilitated using either heat or light; however, until now, the limited optical absorption intensity evidenced by the pale-yellow color of In2O3 has prevented the use of both together. To take advantage of the heat and light content of solar energy, it would be advantageous to make indium oxide black. Herein, we present a synthetic route to tune the color of In2O3 to pitch black by controlling its degree of non-stoichiometry. Black indium oxide comprises amorphous non-stoichiometric domains of In2O3-x on a core of crystalline stoichiometric In2O3, and has 100% selectivity towards the hydrogenation of CO2 to CO with a turnover frequency of 2.44 s-1.


Conflict of interest statement

The authors declare no competing interests.

Figures

Fig. 1
Fig. 1. Structural and morphological information for In2O3−x/In2O3 materials S1, S2, S3, S4.
a PXRD patterns of S1−S4. b High-resolution O1s core level XPS spectrum of S4. c, d HRTEM and STEM images of S4 at different magnifications. A dashed green circle indicates an amorphous phase, yellow arrow indicates the measured lattice spacing and the red square indicates the imaged position.
Fig. 2
Fig. 2. In situ high-resolution environmental transmission electron microscopy (HRETEM) observations of the In2O3 + xH2 → In2O3−x + xH2O process.
High-resolution images of a stoichiometric In2O3 nanocrystal (S1) at 400 °C a under an N2 atmosphere and then switched to an H2 atmosphere for the following times: b 5 min, c 10 min and d 20 min. Scale bars are the same for all images, green squares indicate the formation of an amorphous phase. Graphical representation of the e original and f treated In2O3, wherein blue region, pink dots, yellow dots and yellow circles represent amorphous phase, In atoms, O atoms and [O], respectively.
Fig. 3
Fig. 3. Photocatalytic evaluation of black indium oxide.
a Photocatalytic CO2 hydrogenation in a batch reactor. Conditions: H2/CO2 ratio = 1:1, light intensity = ~20 suns, no external heating and measurement time = 30 min. b Catalytic performance for S4 in a flow reactor at different temperatures, both with and without light irradiation; inset is the enlarged view of the catalytic performance for 200, 225 and 250 °C. c Stability test for S4 in a flow reactor at 300 °C with light irradiation for 70 h. Conditions for flow measurement: atmospheric pressure, H2/CO2 ratio = 1:1 with a flow rate of 1 mL min−1 and light intensity of ~8 suns.
Fig. 4
Fig. 4. Characterization of electronic properties and surface H2 and H2-CO2 chemistry of the samples S1 and S4.
a Photocurrent saturation and decay plot acquired at ~200 °C with a 1:1 ratio of CO2/H2 and under a 100 W LED white lamp. b Corresponding in situ IV plot. In situ DRIFTS spectra of S4 obtained c under H2 at room temperature and d under both H2 and CO2 (1:1) with increased temperatures. The collected DRIFTS spectra are subtracted by the background signal of S4 obtained under He.
Fig. 5
Fig. 5. Illustration of the electronic band structure.
The In2O3−x/In2O3 heterostructure showing the In(III)′, [O] electron-trapping and O′ hole-trapping mid-gap energy states near the CB and VB edges, respectively. Included also in the diagram is the outcome of photoexcitation and relaxation of electrons and holes involving valence, conduction and mid-gap energy states.

References

    1. Li YG, et al. Selective light absorber-assisted single nickel atom catalysts for ambient sunlight-driven CO2 methanation. Nat. Commun. 2019;10:2359. doi: 10.1038/s41467-019-10304-y. - DOI - PMC - PubMed
    1. Ren J, et al. Targeting activation of CO2 and H-2 over Ru-loaded ultrathin layered double hydroxides to achieve efficient photothermal CO2 methanation in flow-type system. Adv. Energy Mater. 2017;7:1601657. doi: 10.1002/aenm.201601657. - DOI
    1. Zhao YF, et al. Reductive transformation of layered-double-hydroxide nanosheets to Fe-based heterostructures for efficient visible-light photocatalytic hydrogenation of CO. Adv. Mater. 2018;30:1803127. doi: 10.1002/adma.201803127. - DOI - PubMed
    1. Chen GB, et al. Alumina-supported CoFe alloy catalysts derived from layered-double-hydroxide nanosheets for efficient photothermal CO2 hydrogenation to hydrocarbons. Adv. Mater. 2018;30:1704663. doi: 10.1002/adma.201704663. - DOI - PubMed
    1. Jia J, et al. Visible and near-infrared photothermal catalyzed hydrogenation of gaseous CO2 over nanostructured Pd@Nb2O5. Adv. Sci. 2016;3:1600189. doi: 10.1002/advs.201600189. - DOI - PMC - PubMed