. 2020 May 15;11(1):2420.
doi: 10.1038/s41467-020-16214-8.

Unique properties of a subset of human pluripotent stem cells with high capacity for self-renewal

Affiliations

Unique properties of a subset of human pluripotent stem cells with high capacity for self-renewal

Kevin X Lau et al. Nat Commun. .

Abstract

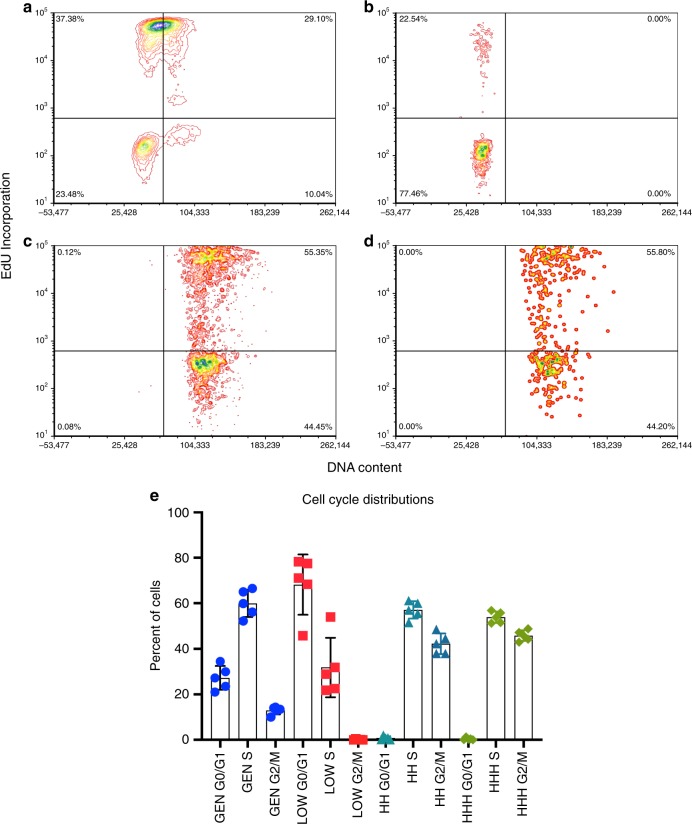
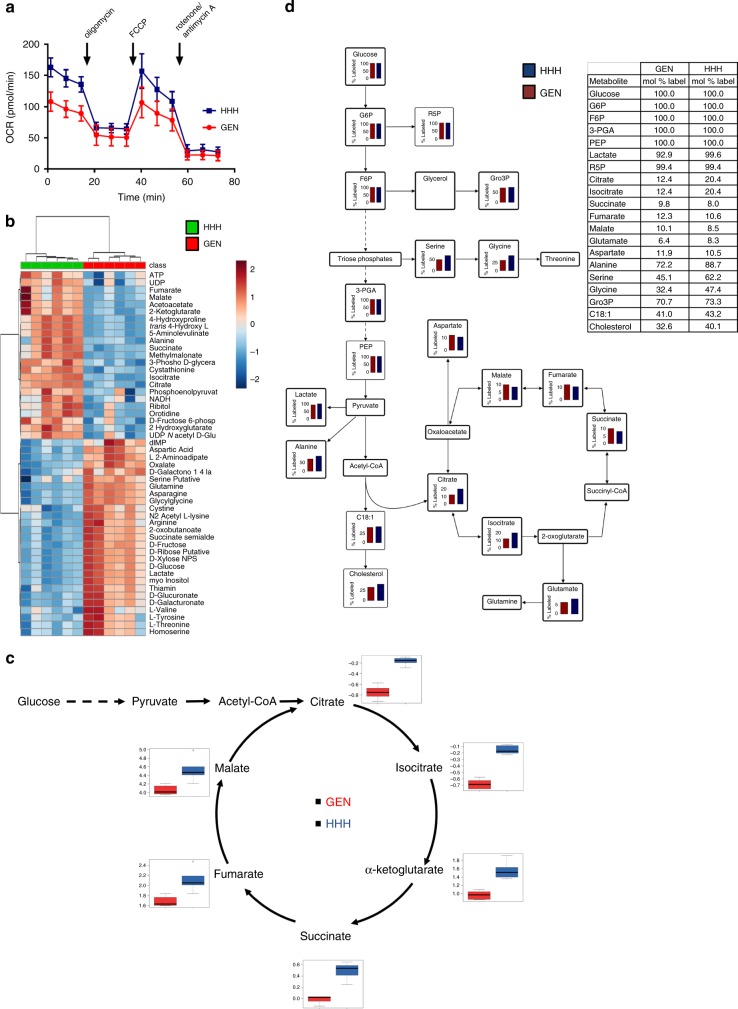
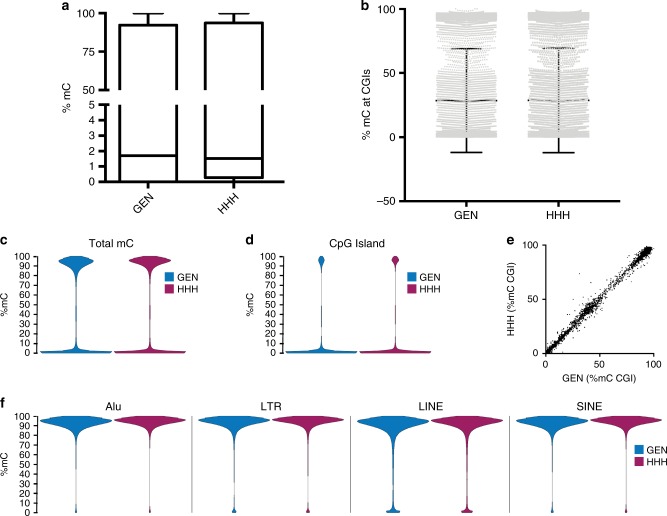
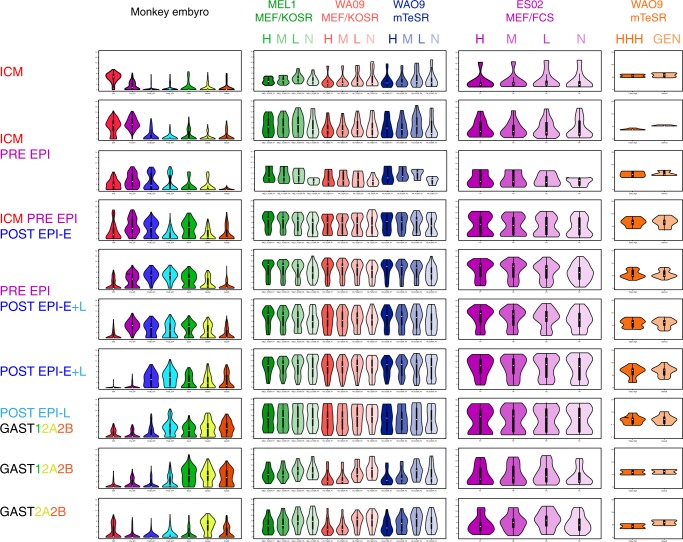
Archetypal human pluripotent stem cells (hPSC) are widely considered to be equivalent in developmental status to mouse epiblast stem cells, which correspond to pluripotent cells at a late post-implantation stage of embryogenesis. Heterogeneity within hPSC cultures complicates this interspecies comparison. Here we show that a subpopulation of archetypal hPSC enriched for high self-renewal capacity (ESR) has distinct properties relative to the bulk of the population, including a cell cycle with a very low G1 fraction and a metabolomic profile that reflects a combination of oxidative phosphorylation and glycolysis. ESR cells are pluripotent and capable of differentiation into primordial germ cell-like cells. Global DNA methylation levels in the ESR subpopulation are lower than those in mouse epiblast stem cells. Chromatin accessibility analysis revealed a unique set of open chromatin sites in ESR cells. RNA-seq at the subpopulation and single cell levels shows that, unlike mouse epiblast stem cells, the ESR subset of hPSC displays no lineage priming, and that it can be clearly distinguished from gastrulating and extraembryonic cell populations in the primate embryo. ESR hPSC correspond to an earlier stage of post-implantation development than mouse epiblast stem cells.


Conflict of interest statement

The authors declare no competing interests.

Figures

Fig. 1
Fig. 1. Assay of self-renewal of subpopulations of hPSC under conditions that maintain cell–cell contacts.
a Isolation of aggregates of subsets of hPSC by flow cytometry. Left panel, side and forward scatter; middle panel, separation of single cells using GCTM-2 and anti-CD9; right panel, separation of cell aggregates using GCTM-2 and anti-CD9. b Phase contrast image of aggregates and single cells 1 and 24 h after plating. At 1 h, both populations of aggregates (GCTM-2highCD9high, HIGH and GCTM-2midCD9mid, MID) have attached and spread onto the substrate. Scale bar = 100 micron. c Flow cytometry analysis of cell surface antigen expression in aggregate cultures prepared as in a 72 h after plating. d Microcolony formation after 4 days by single cells (200, 1000, or 2000) or aggregates (100, 500, or 1000) of GCTM-2highCD9high (HS, HA) and GCTM-2midCD9mid (MS, MA) subpopulations. e Numbers of microcolonies formed at 4 days by GCTM-2highCD9high or GCTM-2midCD9mid single cells or aggregates (AGG). Values represent the mean ± standard deviation from eight wells from one experiment; see Supplementary Table 5 for biological replicates of this assay. f Immunostaining with stem cell surface marker antibody GCTM-2 of colonies formed by aggregates of GCTM-2midCD9mid and GCTM-2highCD9high subpopulations. Scale bar = 100 micron. Results in b, d, and f display representative outcomes from three experiments.
Fig. 2
Fig. 2. Differentiation potential of GCTM-2highCD9highEPCAMhigh and GCTM-2midCD9mid subpopulations.
a Flow cytometry assay showing differentiation of GCTM-2highCD9highEPCAMhigh subpopulation into PGC-like cells. Panels show flow cytometry analysis for expression of EPCAM and ITGA6 in starting population (Day 0), post induction of incipient mesoderm-like cell with ACV and CHIR99021 (Day2), and PGC induction (addition of BMP4, LIF, KITLG, and EGF) versus controls without these factors (Days 4 + and − factors). b Staining of aggregates of PGC-like cells for PRDM1 or NANOS3 on Day 4. Aggregates incubated with cytokines showed strong nuclear staining; those incubated in the absence of factors did not. DNA staining to right of each image. Scale bar PRDM1 panels 50 μM; NANOS3 and 2nd antibody only, 100 μM. Staining with secondary antibody alone in bottom panel. c Table showing percentage yield of EPCAM+ITG6A+ cells on Day 4 in two cell lines for GCTM-2highCD9highEPCAMhigh and GCTM-2midCD9mid subpopulations. d Directed differentiation of the GCTM-2highCD9high fraction and the remaining population of WA09 and WA01 cells in adherent culture. Panels show staining for PAX6, T, and SOX17 after induction of differentiation for 5 days. Numbers on each panel represent the proportion of cells positive for the indicated marker ± 95% confidence interval. Scale bar = 100 μM, same magnification in all panels. Results in b and d display representative outcomes from two experiments on two cell lines.
Fig. 3
Fig. 3. Cell cycle analysis of hPSC subpopulations by flow cytometry of EdU labeled cultures.
Cells were pulsed labeled with EdU, sorted into three subpopulations using cell surface markers GCTM-2 and CD9 with or without EPCAM, and analyzed by flow cytometry. ad Flow cytometry profiles from one experiment. a Unsorted population; b GCTM-2lowCD9low; c GCTM-2highCD9high; d GCTM-2highCD9highEPCAMhigh; e summary showing results from seven experiments. Mean values are shown and error bars represent standard error of seven biological replicates; General is unsorted population, low is GCTM-2lowCD9low, HH is GCTM-2highCD9high, and HHH is GCTM-2highCD9highEPCAMhigh. See Supplementary Table 6 for biological replicate data points.
Fig. 4
Fig. 4. Mitochondrial activity in subpopulations of hPSC.
a Double label staining of live cells with TMRM and stem cell surface marker CD9. Cells at the edges of colonies stain most strongly with antibody and dye. Scale bar = 100 micron. b Flow cytometry analysis of TMRM staining in GCTM-2highCD9highEPCAMhigh (HHH), GCTM-2lowCD9low (LOW), and unsorted (GEN) population. c Flow cytometry analysis of green (left panel) and red (right panel) JC-1 dye emission in GCTM-2highCD9highEPCAMhigh (HHH), GCTM-2lowCD9low (LOW), and unsorted (GEN) population. GCTM-2highCD9highEPCAMhigh cells display highest ratio of green to red emission, indicative of high mitochondrial membrane potential. Results in a display representative outcomes from three experiments.
Fig. 5
Fig. 5. Analysis of the metabolism of GCTM-2highCD9highEPCAMhigh cells.
a Seahorse XF analysis of oxygen consumption rate (OCR) in the GCTM-2highCD9highEPCAMhigh (HHH) and unsorted (GEN) cell populations. Data represent means ± standard error. Differences in the measurements of basal respiration and respiration after oligomycin, FCCP, and rotenone/antimycin between the HHH and general cell population were compared in a two-talied t-test; the p-values was 0.0000031, 0.0025, 0.0032, and 0.005, respectively, for six biological replicates per condition with three measurements each. b Metabolomic analysis of GEN and HHH cells. Unsupervised hierarchical cluster analysis of metabolite levels determined by LC–MS differing between the two samples (t-test with Benjamini–Hochberg FDR = 0.05) in replicate samples leads to clear separation of the two populations. The metabolite abundance values are normalized by scaling to zero mean and unit variance by compound. Cells colored red denote higher abundance, while blue denotes lower abundance. c Levels of TCA cycle intermediates are elevated in GCTM-2highCD9high cells. Polar metabolites from unfractionated hPSC and GCTM-2highCD9high cells were analyzed by GC–MS and relative abundance of TCA cycle intermediates after medium normalization shown as box plots. Values are means ± standard error of three biological replicates. For each boxplot, the bisecting line of each box represents the median. The top and bottom ends of each box are the 75th and 25th percentiles, respectively. The top and bottom horizontal lines extending out of each box are the minimum and maximum values, respectively. d HHH and GEN cells were metabolically labeled with 13C glucose for 2 h and 13C-enrichment (expressed as mol%) in select intermediates measured by GC–MS.
Fig. 6
Fig. 6. Reduced representation bisulfite sequencing analysis of DNA methylation in unsorted (GEN) and GCTM-2highCD9highEPCAMhigh (HHH) subpopulations.
a, b Box plots of overall DNA methylation (a) and methylation at CpG islands (b). In a, line indicates median, box shows 25th to 75th percentile, and bars show maxima and minima. In b, line shows the mean and error bars show standard deviation. c, d Bean plots showing the distribution of DNA methylation (%mC) of individual CpGs, both genome wide (c) and at CpG islands (d). e Scatter plot showing the %mC at all CpG islands comparing the GEN and HHH populations. f Bean plots showing the %mC of individual CpGs at the repetitive elements of type Alu, LTR, LINE, and SINE. All data shown is the average for GEN (n = 2) and HHH (n = 3).
Fig. 7
Fig. 7. Landscape of accessible chromatin differentiates stem cell populations.
a Volcano plot showing significant differences in DNA accessibility as measured using ATAC-seq between GCTM-2highCD9highEPCAMhigh (yellow) and GCTM-2midCD9mid (blue) populations (FDR < 0.01). Vertical lines indicate twofold difference. b Distribution of significantly different open chromatin regions plotted as distance from TSS. c Bar chart of the top 150-log odds ratios for overlap of differentially open chromatin regions in the GCTM-2midCD9mid (left) and GCTM-2highCD9highEPCAMhigh (right) populations compared with all ChIP-seq data for all cell types in the ENCODE TF dataset. Orange indicates ChIP data from the human ESC cell line H1. d Similar to c showing to 15 highest log odds ratios for overlap. Names of each TF antibody used for ChIP are indicated on the left.
Fig. 8
Fig. 8. Global gene expression analysis of hPSC subpopulations by RNA-seq.
a Volcano plot illustrating differentially expressed genes in GCTM-2highCD9highEPCAMhigh versus general (unsorted) populations. b Principal component analysis of single-cell RNA-seq data on GCTM-2highCD9highEPCAMhigh, GCTM-2highCD9high, GCTM-2midCD9mid, and GCTM-2lowCD9low subpopulations. c Joint species principal component analysis of single-cell RNA-seq data on GCTM-2highCD9highEPCAMhigh (HHH), GCTM-2highCD9high (HH), GCTM-2midCD9mid (MID), and GCTM-2lowCD9low (LOW) subpopulations alongside cynomolgus embryo data from ref. ; single embryo cells classified according to Houghton et al.. Top left: screeplot demonstrating the amount of variability in the data accounted for by each component; top right: graph displaying data distribution along first and second components; bottom left: graph displaying data distribution along the second and third components. Color and shape of point indicate sample phenotype, each point representing a single cell.
Fig. 9
Fig. 9. String section plot comparison of expression of embryonic stage-specific genes by scRNA-seq in cynomolgus embryo with expression in subpopulations of hPSC.
The violin plots in the left hand column show expression from single-cell RNA-seq data in ref. , with classification of cells as described therein; embryonic stages in which particular gene sets (Supplementary Table 4, each row in the figure displays violin plots for one gene set) are expressed are listed to the left of the plots. The second column shows microarray data from ref. for the same sets of genes in GCTM-2highCD9high (H), GCTM-2midCD9mid (M), GCTM-2lowCD9low (L), and GCTM-2negCD9neg (N) subpopulations of MEL1 cells grown in the presence of medium containing Knockout Serum Replacer on mouse embryo fibroblast feeder cell layers (MEF/KSOR), or WA09 cells grown in MEF/KSOR or mTeSR defined medium. The third column shows microarray data from ref. for the same sets of genes on GCTM-2highCD9high (H), GCTM-2midCD9mid (M), GCTM-2lowCD9low (L), and GCTM-2negCD9neg (N) subpopulations of ES02 cells grown in serum-containing medium on mouse embryo fibroblast feeder cell layers (MEF/FCS). The last column shows RNA-seq bulk data on the same sets of genes from the current study for GCTM-2highCD9highEPCAMhigh (HHH) and unsorted (GEN) cells. Colors of violins correspond to embryonic stages or cell subpopulations identified in labels at left or top of figure (last three columns), respectively.

References

    1. Ramos-Ibeas P, Nichols J, Alberio R. States and origins of mammalian embryonic pluripotency in vivo and in a dish. Curr. Top. Dev. Biol. 2018;128:151–179. doi: 10.1016/bs.ctdb.2017.11.002. - DOI - PubMed
    1. Ying QL, et al. The ground state of embryonic stem cell self-renewal. Nature. 2008;453:519–523. doi: 10.1038/nature06968. - DOI - PMC - PubMed
    1. Brons IG, et al. Derivation of pluripotent epiblast stem cells from mammalian embryos. Nature. 2007;448:191–195. doi: 10.1038/nature05950. - DOI - PubMed
    1. Tesar PJ, et al. New cell lines from mouse epiblast share defining features with human embryonic stem cells. Nature. 2007;448:196–199. doi: 10.1038/nature05972. - DOI - PubMed
    1. Kojima Y, et al. The transcriptional and functional properties of mouse epiblast stem cells resemble the anterior primitive streak. Cell Stem Cell. 2014;14:107–120. doi: 10.1016/j.stem.2013.09.014. - DOI - PubMed

Publication types

MeSH terms