. 2020 May 15;11(1):2438.
doi: 10.1038/s41467-020-16293-7.

Germline variant burden in cancer genes correlates with age at diagnosis and somatic mutation burden

Affiliations

Germline variant burden in cancer genes correlates with age at diagnosis and somatic mutation burden

Tao Qing et al. Nat Commun. .

Abstract

Cancers harbor many somatic mutations and germline variants, we hypothesized that the combined effect of germline variants that alter the structure, expression, or function of protein-coding regions of cancer-biology related genes (gHFI) determines which and how many somatic mutations (sM) must occur for malignant transformation. We show that gHFI and sM affect overlapping genes and the average number of gHFI in cancer hallmark genes is higher in patients who develop cancer at a younger age (r = -0.77, P = 0.0051), while the average number of sM increases in increasing age groups (r = 0.92, P = 0.000073). A strong negative correlation exists between average gHFI and average sM burden in increasing age groups (r = -0.70, P = 0.017). In early-onset cancers, the larger gHFI burden in cancer genes suggests a greater contribution of germline alterations to the transformation process while late-onset cancers are more driven by somatic mutations.


Conflict of interest statement

L.P. has received honoraria from Astra Zeneca, Merck, Novartis, Bristol-Myers Squibb Genentech, Eisai, Pieris, Immunomedics, Seattle Genetics, Clovis, Syndax, H3Bio, and Daiichi. The remaining authors have no conflict of interests to declare.

Figures

Fig. 1
Fig. 1. Distribution of gHFI variants and somatic mutations in protein-coding genes in the TCGA.
a The number of high-functional impact germline variants and somatic mutations from 7468 patients with 31 different cancer types. b Venn diagram of loci affected by germline variants and somatic mutations. c Venn diagram of cancer hallmark genes (n = 1558) affected by germline variants and somatic mutations in the TCGA population.
Fig. 2
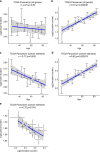
Fig. 2. Correlations between the average gHFI variant burden and somatic mutation burden and age in the TCGA (n = 7468 cases).
a Variant burden in all human genes (n = 19,581 genes) versus age intervals. b Mutation burden in all human genes versus age intervals. c Variant burden in cancer hallmark genes (n = 1558 genes) versus age intervals. d Mutation burden in cancer hallmark genes versus by age intervals. e Correlation between variant burden and mutation burden in cancer hallmark genes across age. Tags a–k indicate age intervals corresponding to ages ≤30 (n = 307), 31–40 (n = 545), 41–45 (n = 405), 46–50 (n = 568), 51–55 (n = 820), 56–60 (n = 1014), 61–65 (n = 1080), 66–70 (n = 958), 71–75 (n = 820), 76–80 (n = 572), and ≥81 (n = 379) years. The y-axes correspond to log2 transformed variant/mutation burden. Error bars represent standard error.  The r represents Pearson correlation coefficient. Spearman’s Rho test (two-sided) was used to generate the p value to measure the strength of correlation coefficient.
Fig. 3
Fig. 3. Correlation between gHFI variant burden in cancer genes in the PCWAG and UKBB.
a Variant burden for 11 age intervals in the PCAWG (n = 1487 cases, the tags a–k correspond to ages ≤30, 31–40, 41–45, 46–50, 51–55, 56–60, 61–65, 66–70, 71–75, 76–80, and ≥81). b Variant burden in eight age intervals in the UKBB (n = 7198 cases, the tags a–h correspond to ages ≤40, 41–45, 46–50, 51–55, 56–60, 61–65, 66–70, and ≥71). The y-axes show the log2 transformed variant/mutation burden. Error bars represent standard error. The r represents Pearson correlation coefficient. Spearman’s Rho test (two-sided) was used to generate the p-value to measure the strength of correlation coefficient.
Fig. 4
Fig. 4. Contribution of germline variants and somatic mutations to alterations in cancer pathways.
a Violin plots show the average fraction and distribution of member genes affected by either germline variants or somatic mutations in 21 pathways. Red lines indicate the average fraction of affected genes. b Average percent of the contribution of germline variant versus somatic mutation to all the affected genes in each pathway across all TCGA samples. c Correlation between average germline variant burden and somatic mutation burden across the cancer hallmark pathways. Error bars show the standard error. Vertical error bars (for the germline HFI burden/MB) are too small to be discernable.

References

    1. Sasieni PD, Shelton J, Ormiston-Smith N, Thomson CS, Silcocks PB. What is the lifetime risk of developing cancer?: The effect of adjusting for multiple primaries. Br. J. Cancer. 2011;105:460–465. doi: 10.1038/bjc.2011.250. - DOI - PMC - PubMed
    1. Howlader, N. et al. SEER Cancer Statistics Review (CSR) 1975-2016, https://seer.cancer.gov/csr/1975_2016/ (2018).
    1. Hanahan D, Weinberg RA. Hallmarks of cancer: the next generation. Cell. 2011;144:646–674. doi: 10.1016/j.cell.2011.02.013. - DOI - PubMed
    1. White MC, et al. Age and cancer risk: a potentially modifiable relationship. Am. J. Prev. Med. 2014;46:S7–S15. doi: 10.1016/j.amepre.2013.10.029. - DOI - PMC - PubMed
    1. Murff HJ, Spigel DR, Syngal S. Does this patient have a family history of cancer? An evidence-based analysis of the accuracy of family cancer history. JAMA. 2004;292:1480–1489. doi: 10.1001/jama.292.12.1480. - DOI - PubMed

Publication types