. 2020 May 15;11(1):2416.
doi: 10.1038/s41467-020-16199-4.

Targeting lysyl oxidase (LOX) overcomes chemotherapy resistance in triple negative breast cancer

Affiliations

Targeting lysyl oxidase (LOX) overcomes chemotherapy resistance in triple negative breast cancer

Ozge Saatci et al. Nat Commun. .

Abstract

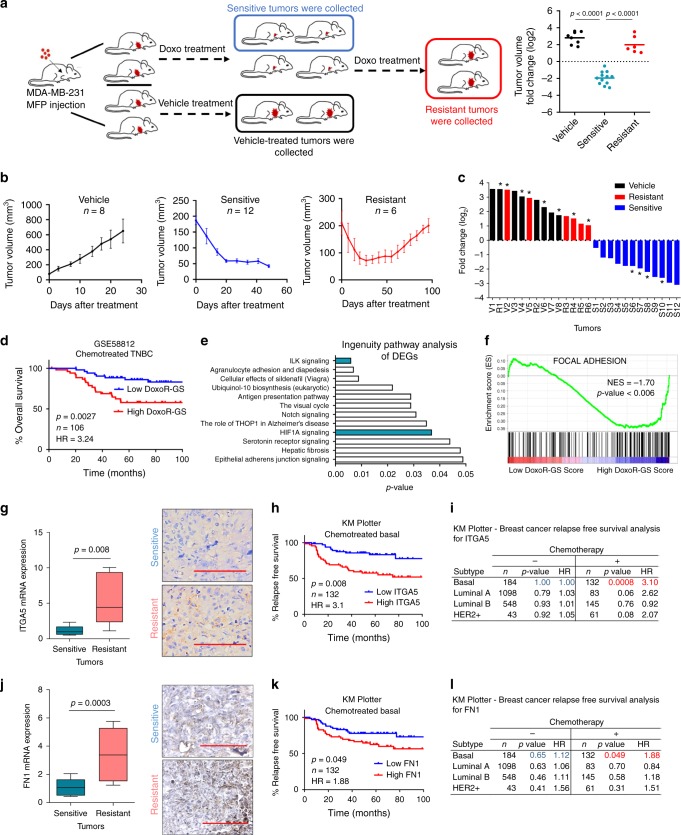
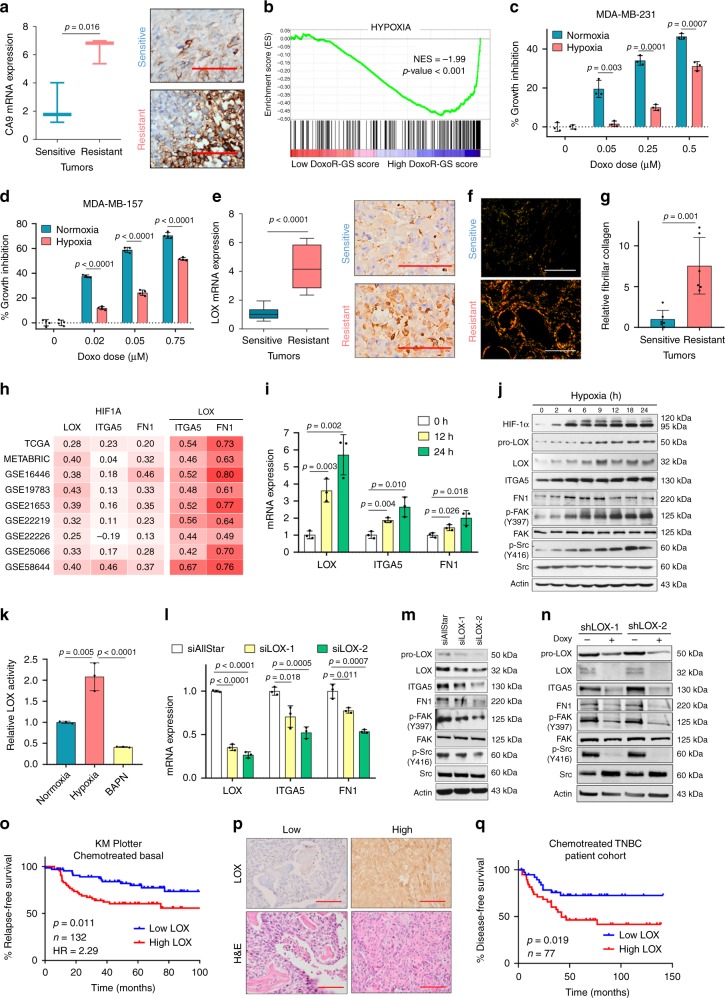
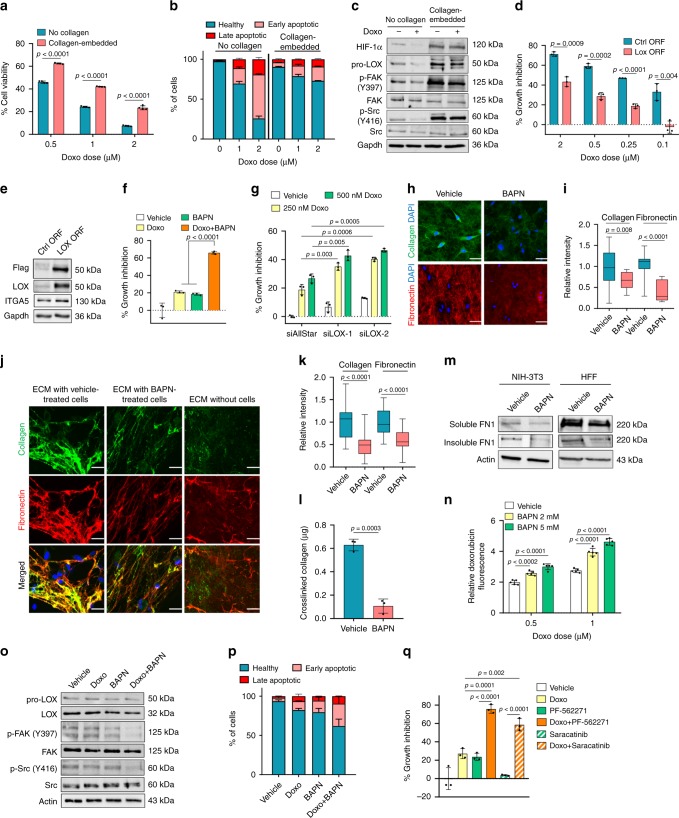
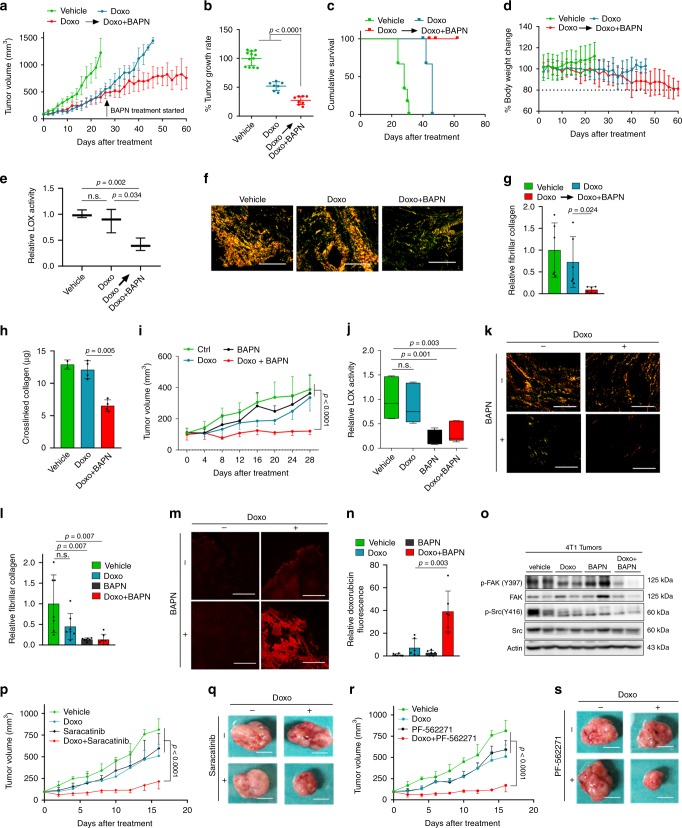
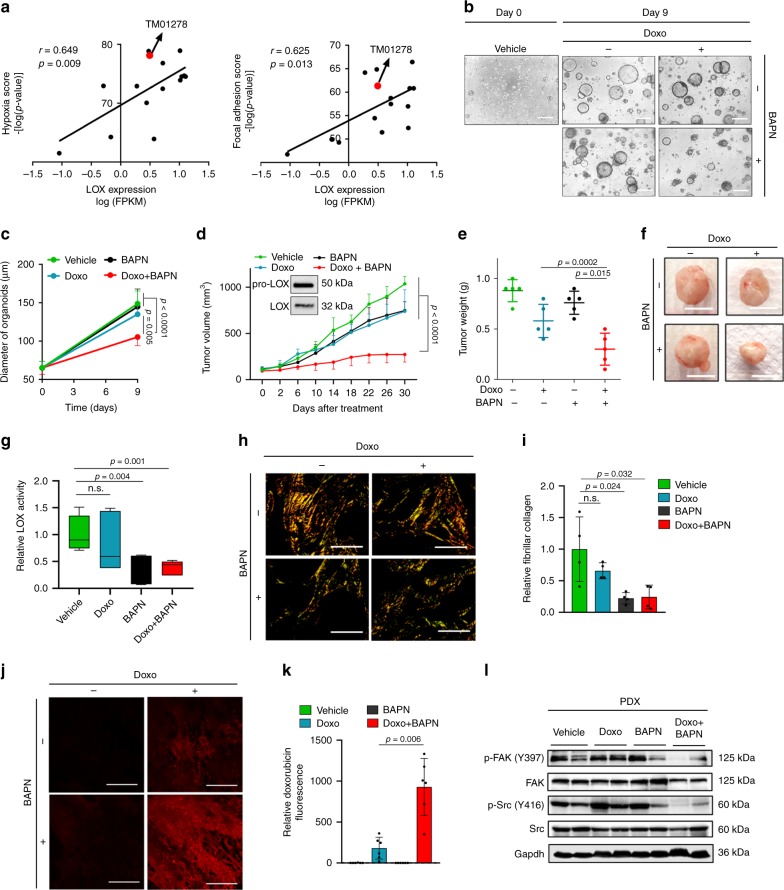
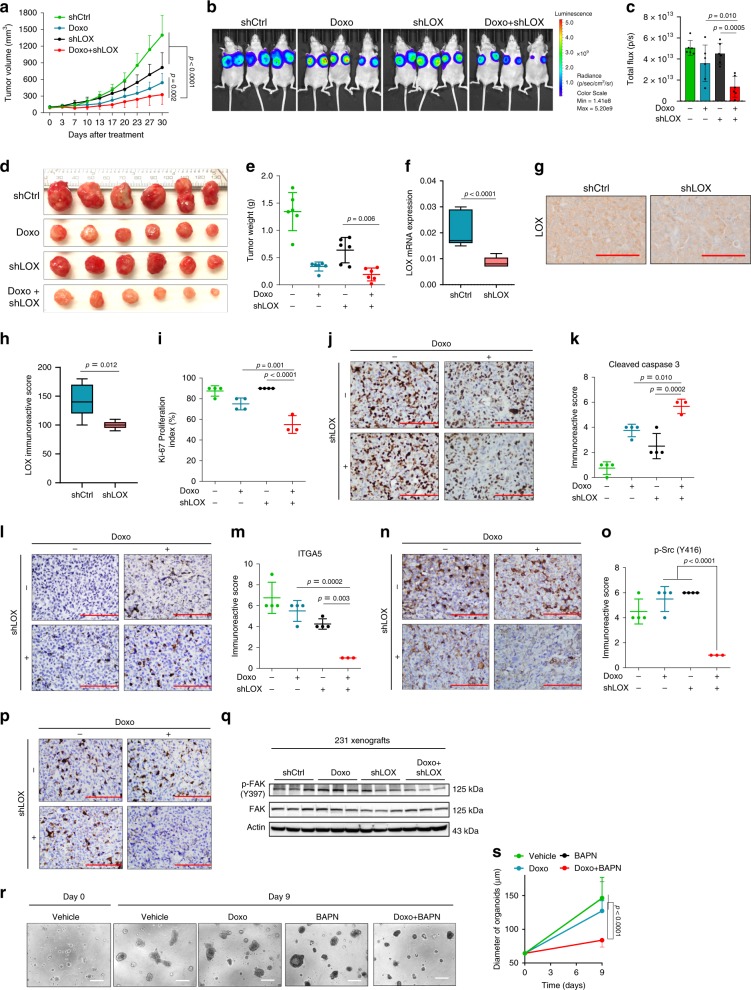
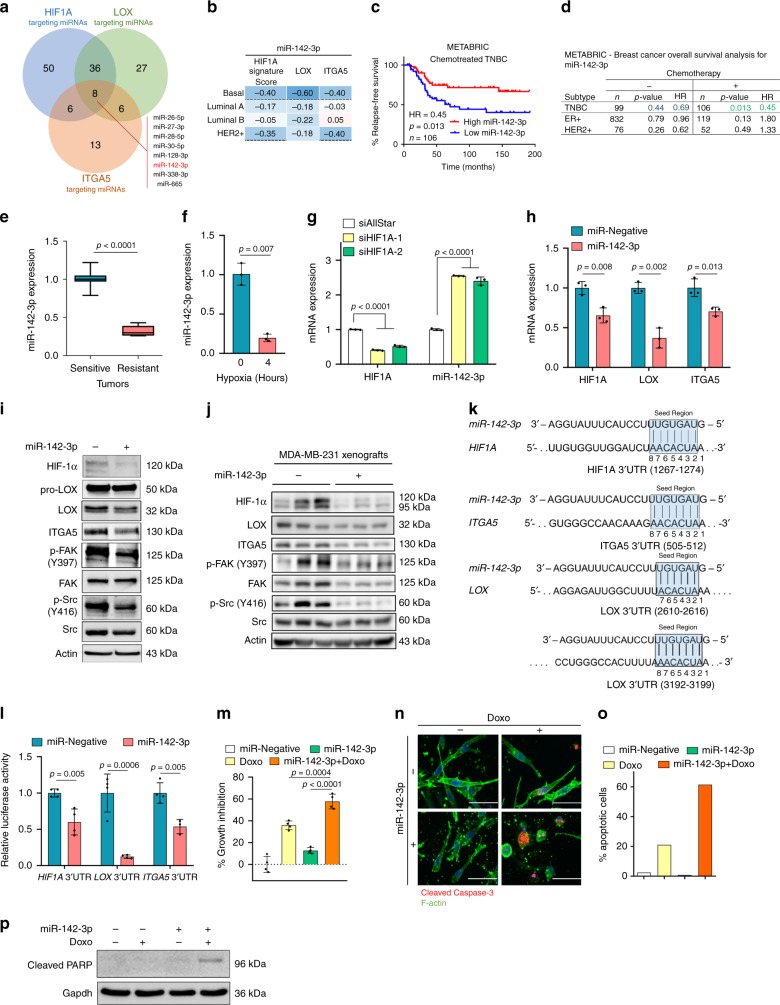
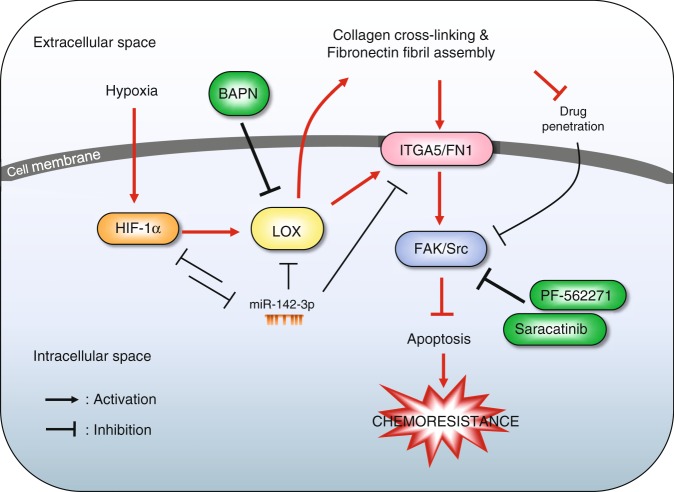
Chemoresistance is a major obstacle in triple negative breast cancer (TNBC), the most aggressive breast cancer subtype. Here we identify hypoxia-induced ECM re-modeler, lysyl oxidase (LOX) as a key inducer of chemoresistance by developing chemoresistant TNBC tumors in vivo and characterizing their transcriptomes by RNA-sequencing. Inhibiting LOX reduces collagen cross-linking and fibronectin assembly, increases drug penetration, and downregulates ITGA5/FN1 expression, resulting in inhibition of FAK/Src signaling, induction of apoptosis and re-sensitization to chemotherapy. Similarly, inhibiting FAK/Src results in chemosensitization. These effects are observed in 3D-cultured cell lines, tumor organoids, chemoresistant xenografts, syngeneic tumors and PDX models. Re-expressing the hypoxia-repressed miR-142-3p, which targets HIF1A, LOX and ITGA5, causes further suppression of the HIF-1α/LOX/ITGA5/FN1 axis. Notably, higher LOX, ITGA5, or FN1, or lower miR-142-3p levels are associated with shorter survival in chemotherapy-treated TNBC patients. These results provide strong pre-clinical rationale for developing and testing LOX inhibitors to overcome chemoresistance in TNBC patients.


Conflict of interest statement

The authors declare no competing interests.

Figures

Fig. 1
Fig. 1. Integrin signaling is a key mediator of chemoresistance in TNBCs.
a Schematic representation of developing doxorubicin resistance in mice using the TNBC cell line, MDA-MB-231 (left panel). Tumor volume fold change (log2) of vehicle-treated, doxorubicin-sensitive and -resistant tumors (right panel). Clipart reprinted with permission from Springer Nature, Nature Protocols, FACS isolation of endothelial cells and pericytes from mouse brain microregions, Elizabeth E Crouch and Fiona Doetsch, Copyright 2018. b Tumor volumes of vehicle (n = 8), sensitive (n = 12) and -resistant (n = 6) tumors. c Waterfall plot of tumor volume fold change over time. Asterisk indicates tumors profiled by RNA-Seq. V vehicle; S sensitive; and R resistant. d Kaplan–Meier survival curve representing the percentage overall survival (OS) in chemotherapy-treated TNBC patients (n = 106) based on low vs. high (median) DoxoR-GS score. e Summary of IPA analysis showing top deregulated pathways in doxorubicin-resistant xenografts. f Genes associated with focal adhesion signaling are enriched in tumors of high DoxoR-GS scorers from GSE58812. g Expression of integrin alpha 5 (ITGA5) in doxorubicin-sensitive (n = 8) vs. -resistant (n = 6) xenografts at mRNA (left) and protein (right) levels, demonstrating membranous and cytoplasmic staining. h Kaplan–Meier survival curve representing the percentage relapse-free survival (RFS) in chemotherapy-treated basal patients (n = 132) based on low vs. high ITGA5 (median) expression. i Table summarizing association of ITGA5 with survival in patients of different subtypes that received or did not receive chemotherapy. j Expression of fibronectin (FN1) in doxorubicin-sensitive (n = 12) vs. resistant (n = 12) tumors at mRNA (left) and protein (right) levels, demonstrating mild to moderate cytoplasmic staining. k Kaplan–Meier survival curve representing the percentage RFS in chemotherapy-treated basal breast cancer patients (n = 132) based on low vs. high FN1 (median) expression. l Table summarizing association of FN1 with survival in patients of different subtypes that received or did not receive chemotherapy. Data on b represent mean ± SEM and all others represent mean ± SD. In Box plots, the box depicts median, 25th to 75th percentiles, and the whisker depicts min to max for this figure and all others. Two-sided Student’s t-test was used to calculate statistical difference between two groups. Significance for survival analyses was calculated by log-rank (Mantel-Cox) test. NES Normalized enrichment score, HR hazard ratio. Scale bar = 100 µm for g, j. Source data are provided as a Source data file.
Fig. 2
Fig. 2. Hypoxia-induced LOX hyperactivates ITGA5/FN1/FAK/Src axis in TNBCs.
a Expression of a HIF-1α direct target gene, carbonic anhydrase 9 (CA9) in sensitive (n = 3) vs. resistant (n = 3) tumors at mRNA (left) and protein (right) levels, demonstrating predominantly membranous and mild cytoplasmic staining. b Genes upregulated upon hypoxia are enriched in patients with high DoxoR-GS score from GSE58812 (n = 106). c, d. % growth inhibition upon doxorubicin treatment of MDA-MB-231 (c) (n = 3) and MDA-MB-157 (d) (n = 4) cells grown under normoxic vs. hypoxic conditions. e Expression of LOX in sensitive (n = 12) vs. resistant (n = 9) tumors at mRNA (left) and protein (right) levels, demonstrating strong cytoplasmic and weak nuclear staining. f, g Representative images of Picrosirius red staining (f) and its quantification (g) (n = 6). h Heatmap summarizing the Pearson’s correlation coefficients between HIF1A and LOX, ITGA5 or FN1 and between LOX and ITGA5 or FN1 in breast cancer patients. An intense red color shows a stronger positive correlation. i qRT-PCR analysis of LOX, ITGA5, and FN1 under hypoxia (n = 3). j Western blot analyses of HIF-1α, LOX and integrin signaling members under hypoxia. k Relative LOX activity in MDA-MB-231 cells under hypoxia. BAPN was used as a negative control (n = 3). l qRT-PCR analysis of LOX, ITGA5, and FN1 after transfection with siAllStar or siLOX (n = 3). m, n Western blot analyses in MDA-MB-231 cells transfected with siAllStar or siLOX (m) and after shLOX induction with doxycycline (n). o Kaplan–Meier survival curve representing the percentage RFS in chemotherapy-treated basal breast cancer patients (n = 132) separated based on low vs. high (median) LOX mRNA. p IHC images of TNBC patient tissues with low and high LOX protein expression. q Kaplan–Meier survival curve representing DFS in chemotherapy-treated TNBC patients (n = 77) separated from median based on LOX protein expression. Data represents mean ± SD. Two-sided Student’s t-test was used to calculate statistical difference between two groups. Significance for survival analyses was calculated by log-rank (Mantel-Cox) test. NES Normalized enrichment score, HR hazard ratio. Scale bar = 100 µm for a, e, and p, and 400 µm for f. Source data are provided as a Source data file.
Fig. 3
Fig. 3. LOX inhibition remodels ECM to confer chemosensitization in TNBCs.
a Doxorubicin response of MDA-MB-231 cells cultured with or without type I collagen for 72 h (n = 4). b Apoptosis assay by Annexin V/DAPI staining from a (n = 2). c Western blot analysis in doxorubicin-treated cells grown with or without type I collagen. d Percentage growth inhibition in LOX-overexpressing cells embedded in collagen upon doxorubicin treatment (n = 3). e Western blot analyses upon LOX overexpression in MDA-MB-231 cells. f, g Percentage growth inhibition of collagen-embedded MDA-MB-231 cells treated with BAPN (f) or transfected with siLOX (g) in combination with doxorubicin (n = 3). h, i Immunofluorescence staining (h) and quantifications of the intensities (i) of extracellular type I collagen and fibronectin upon treatment of collagen-embedded cells with BAPN (n = 18 (vehicle), n = 15 (BAPN) for collagen, and n = 18 (vehicle), n = 12 (BAPN) for fibronectin). j, k Immunofluorescence staining (j) and quantifications of the intensities (k) of HFF-derived type I collagen and fibronectin incubated with vehicle or BAPN-treated MDA-MB-231 cells. ECM without cells represents the staining in the absence of MDA-MB-231 cells (n = 29 (vehicle), n = 25 (BAPN)). l Amount of cross-linked collagen in HFF-derived ECM incubated with vehicle- vs. BAPN-treated MDA-MB-231 cells (n = 3 different wells). m Western blot of soluble and insoluble FN1 obtained by deoxycholate lysis of NIH3T3- and HFF-derived ECM in contact with vehicle- vs. BAPN-treated MDA-MB-231 cells. n Changes in relative doxorubicin fluorescence upon BAPN-treatment in MDA-MB-231 cells embedded in type I collagen (n = 5). o Western blot analysis of LOX and FAK/Src signaling in collagen type I-embedded MDA-MB-231 cells upon doxorubicin and BAPN treatment for 24 h. p Annexin V/DAPI staining upon combination treatment for 72 h (n = 2). q Percentage growth inhibition induced by the combination of doxorubicin with FAK (PF-562271) or Src (Saracatinib) inhibitors in MDA-MB-231 cells embedded in type I collagen (n = 3). Data represents mean ± SD. Two-sided Student’s t-test was used to calculate statistical difference between two groups. One-way ANOVA with Dunnett’s test was performed to compare mean of combination-treated group with single agent treatments in f, q. Scale bar = 50 µm for h, j. Source data are provided as a Source data file.
Fig. 4
Fig. 4. Targeting LOX or downstream FAK/Src overcomes TNBC chemoresistance in vivo.
a Tumor growth in MDA-MB-231 xenografts treated with doxorubicin until resistance develops followed by treatment with the combination of doxorubicin (2.5 mg/kg) and the LOX inhibitor, BAPN (100 mg/kg) (n = 12, 7, and 8 tumors for vehicle, Doxo and Doxo+BAPN, respectively). b Tumor growth rates relative to vehicle from a. c Cumulative survival of mice from a. Mice were sacrificed when the tumor size cut-off was reached or when the body weight dropped to 80% of the initial body weight (n = 6, 4, and 4 mice for vehicle, Doxo and Doxo + BAPN, respectively). d Percentage change in the body weight of the mice from c. e Relative LOX activity in tumors from a (n = 3). f Representative images of Picrosirius red staining (f) and its quantification (g), in tumors from a (n = 6). h In vivo collagen assay in tumors from a (n = 2 (vehicle), n = 4 (Doxo, Doxo+BAPN)). i Tumor growth in 4T1 syngeneic model upon treatment with doxorubicin and BAPN, alone or in combination (n = 4 mice). j LOX activity in tumors from i (n = 6). k, l Representative images of Picrosirius red staining (k) and its quantification (l) in mice from i (n = 7). m, n Intratumoral doxorubicin levels upon treatment with the combination of doxorubicin and BAPN (n = 6). o Western blot analysis of FAK/Src signaling in combination-treated tumors from i. p, q Change in tumor growth (p) and representative images of tumors (q) in 4T1 model upon treatment with doxorubicin and Saracatinib, alone or in combination (n = 4). r, s Change in tumor growth (r) and representative images of tumors (s) in 4T1 model upon treatment with doxorubicin and PF-562271, alone or in combination (n = 4). Data represents mean ± SD. Two-sided Student’s t-test was used to calculate statistical difference between two groups. Two-way ANOVA test was performed for comparing tumor growth over time among different treatment groups in i, p, and r. n.s. not significant. Scale bar = 400 µm for f, k; 200 µm for m, and 1 cm for q, s. Source data are provided as a Source data file.
Fig. 5
Fig. 5. Targeting LOX overcomes chemoresistance in highly aggressive TNBC PDXs.
a Correlation analysis of LOX mRNA expression with hypoxia and focal adhesion scores in 15 different TNBC PDX models. Red dot shows the position of TM01278 PDX model selected. b Representative images of TM01278 PDX organoids at day 0 and day 9 after treatment with doxorubicin and BAPN treatment, alone or in combination. c Quantification of organoid diameter upon combination therapy for 9 days (n = 12 (vehicle, Doxo, BAPN), n = 11 (Doxo+BAPN)). d, e Tumor growth (d) and tumor weight (e) in TM01278 PDX upon treatment with doxorubicin and BAPN, alone or in combination (n = 5). Inset shows LOX expression in PDX tumors. f Representative images of tumors from d. g Relative LOX activity in tumors from d (n = 8 (vehicle), n = 6 (Doxo, BAPN, Doxo+BAPN)). h, i Representative images of Picrosirius red staining (h) and its quantification (i) in combination- and single agent-treated PDX tumors from d (n = 4). j, k Representative images of doxorubicin fluorescence in tumors from d (j), and its quantification (k) (n = 6). l Western blot analysis of FAK/Src signaling in PDXs treated with doxorubicin and BAPN, alone or in combination. Data represents mean ± SD. Two-sided Student’s t-test was used to calculate statistical difference between two groups. One-way ANOVA with Dunnett’s test was performed to compare mean of combination-treated group with single agent treatments in e. Two-way ANOVA test was performed for comparing tumor growth over time among different treatment groups in d. Scale bar = 100 µm for b, 1 cm for f, and 400 µm for h and 200 µm for j. n.s. not significant. Source data are provided as a Source data file.
Fig. 6
Fig. 6. Targeting LOX at the first-line settings potentiates chemoresponse in TNBCs.
a Tumor volume in MDA-MB-231 xenografts upon shLOX induction in the presence or absence of doxorubicin treatment (n = 6). b IVIS images of mice from a. c Quantifications of luciferase intensity in tumors from b (n = 6). d Images showing isolated tumors from a. e Tumor weights in mice from a (n = 6). f qRT-PCR analysis of LOX in Ctrl (n = 9) vs. shLOX (n = 9) xenografts. g, h IHC staining of LOX and its quantification in Ctrl (n = 5) vs. shLOX (n = 5) tumors. i, j Ki-67 proliferation index of tumors from a (n = 4 (vehicle, Doxo, BAPN), n = 3 (Doxo+BAPN)). kp Immunoreactive scores of Cleaved Caspase-3 (k, l), ITGA5 (m, n) and p-Src (Y416) (o, p) in tumors from a (n = 4 (vehicle, Doxo, BAPN), n = 3 (Doxo + BAPN)). q Western blot analysis of p-FAK and FAK in shLOX tumors in combination with doxorubicin. r Representative images of TNBC patient organoid, F149T at day 0 and day 9 after treatment with doxorubicin and BAPN, alone or in combination. s Quantification of organoid diameter upon combination therapy for 9 days (n = 12 (Day 0), n = 9 (vehicle, Day 9), n = 11 (Doxo, BAPN, Doxo+BAPN, Day 9)). Data represents mean ± SD. Two-sided Student’s t-test was used to calculate statistical difference between two groups. One-way ANOVA with Dunnett’s test was performed to compare mean of combination-treated group with single agent treatments in c, e, i, k, m, o, and s. Two-way ANOVA test was performed for comparing tumor growth over time among different treatment groups in a. Scale bar = 100 µm for g, j, l, n, p, r. Source data are provided as a Source data file.
Fig. 7
Fig. 7. miR-142-3p regulates HIF1A/LOX/ITGA5 axis to confer chemosensitization in TNBC.
a Venn diagram of combinatorial target prediction analysis. Number of miRNAs targeting HIF1A (blue), LOX (green) and ITGA5 (orange) is shown. Eight miRNAs predicted to target all three genes are shown. b Heatmap showing Pearson’s correlation coefficients between miR-142-3p and HIF1A gene signature score, LOX and ITGA5 mRNA expressions in patients from GSE19783. An intense blue color shows a stronger negative correlation. c Kaplan–Meier survival curve in chemotherapy-treated TNBC patients (n = 106) based on low vs. high (median) miR-142-3p expression. d Table summarizing the association of miR-142-3p expression with survival in different breast cancer subtypes with or without chemotherapy. e, f qRT-PCR analyses of miR-142-3p expression in doxorubicin-sensitive (n = 11) vs. doxorubicin-resistant (n = 12) xenografts (e) and in MDA-MB-231 cells under hypoxia for 4 h (n = 3) (f). g. qRT-PCR of miR-142-3p upon transfection with two different siRNAs targeting HIF1A for 48 h (n = 3). h, i qRT-PCR (n = 3) (h) and western blot (i) analyses of HIF/LOX/ITGA5 axis upon miR-142-3p transfection. j. Western blot analyses of the HIF1A/LOX/ITGA5 axis in MDA-MB-231 xenografts stably expressing miR-142-3p. k Graphical representation of miR-142-3p binding sites within the 3′-UTRs of HIF1A, LOX and ITGA5. l. Luciferase reporter assay with 3′-UTRs of HIF1A, LOX or ITGA5 in MDA-MB-231 cells transfected with miR-Negative or miR-142-3p (n = 4 (HIF1A and LOX), n = 3–4 for (ITGA5)). m Percentage growth inhibition in collagen-embedded MDA-MB-231 cells after transfection with miR-142-3p in the presence or absence of doxorubicin (n = 4). n Immunofluorescence staining of Cleaved Caspase-3 (red) and F-actin (green) in miR-Negative or miR-142-3p transfected MDA-MB-231 cells in the presence or absence of doxorubicin. o. Quantification of Cleaved Caspase-3 positive cells from n. p. Western blot of cleaved PARP upon miR-142-3p transfection with or without doxorubicin treatment for 72 h. Data represents mean ± SD. Two-sided Student’s t-test was used to calculate statistical difference between two groups. One-way ANOVA with Dunnett’s test was performed to compare mean of combination-treated group with single agent treatments in m. Significance for survival analyses was calculated by log-rank (Mantel-Cox) test. HR hazard ratio. Scale bar = 50 µm for n. Source data are provided as a Source data file.
Fig. 8
Fig. 8. Mechanistic summary and targeting approaches for overcoming chemoresistance.
In the hypoxic, chemoresistant TNBC tumor microenvironment, hypoxia induces HIF-1α which then increases the transcription of LOX. LOX, on one hand, increases the expressions of ITGA5 and its ligand, fibronectin in tumor cells and on the other hand, it induces collagen cross-linking and fibronectin fibril assembly leading to reduced drug penetration into tumor cells. In meantime, hypoxia-mediated downregulation of miR-142-3p, which directly targets HIF1A, LOX and ITGA5, leads to further activation of the HIF1A/LOX/ITGA5/FN1 axis. Overall, this culminates in the activation of FAK/Src signaling, blockage of drug-induced apoptosis and chemoresistance in TNBCs. Therefore, using inhibitors targeting LOX (e.g. BAPN) or its downstream FAK (e.g. PF-562271) or Src (Saracatinib) could overcome chemoresistance in TNBCs.

References

    1. Saraiva DP, Guadalupe Cabral M, Jacinto A, Braga S. How many diseases is triple negative breast cancer: the protagonism of the immune microenvironment. ESMO Open. 2017;2:e000208. doi: 10.1136/esmoopen-2017-000208. - DOI - PMC - PubMed
    1. Yadav BS, Chanana P, Jhamb S. Biomarkers in triple negative breast cancer: a review. World J. Clin. Oncol. 2015;6:252–263. doi: 10.5306/wjco.v6.i6.252. - DOI - PMC - PubMed
    1. Foulkes WD, Smith IE, Reis-Filho JS. Triple-negative breast cancer. N. Engl. J. Med. 2010;363:1938–1948. doi: 10.1056/NEJMra1001389. - DOI - PubMed
    1. Mayer EL, Burstein HJ. Chemotherapy for triple-negative breast cancer: is more better? J. Clin. Oncol. 2016;34:3369–3371. doi: 10.1200/JCO.2016.68.4068. - DOI - PubMed
    1. Prowell TM, Pazdur R. Pathological complete response and accelerated drug approval in early breast cancer. N. Engl. J. Med. 2012;366:2438–2441. doi: 10.1056/NEJMp1205737. - DOI - PubMed

Publication types

MeSH terms