. 2020 Jun 18;78(6):1096-1113.e8.
doi: 10.1016/j.molcel.2020.04.027. Epub 2020 May 15.

Synthetic Lethal and Resistance Interactions with BET Bromodomain Inhibitors in Triple-Negative Breast Cancer

Affiliations

Synthetic Lethal and Resistance Interactions with BET Bromodomain Inhibitors in Triple-Negative Breast Cancer

Shaokun Shu et al. Mol Cell. .

Abstract

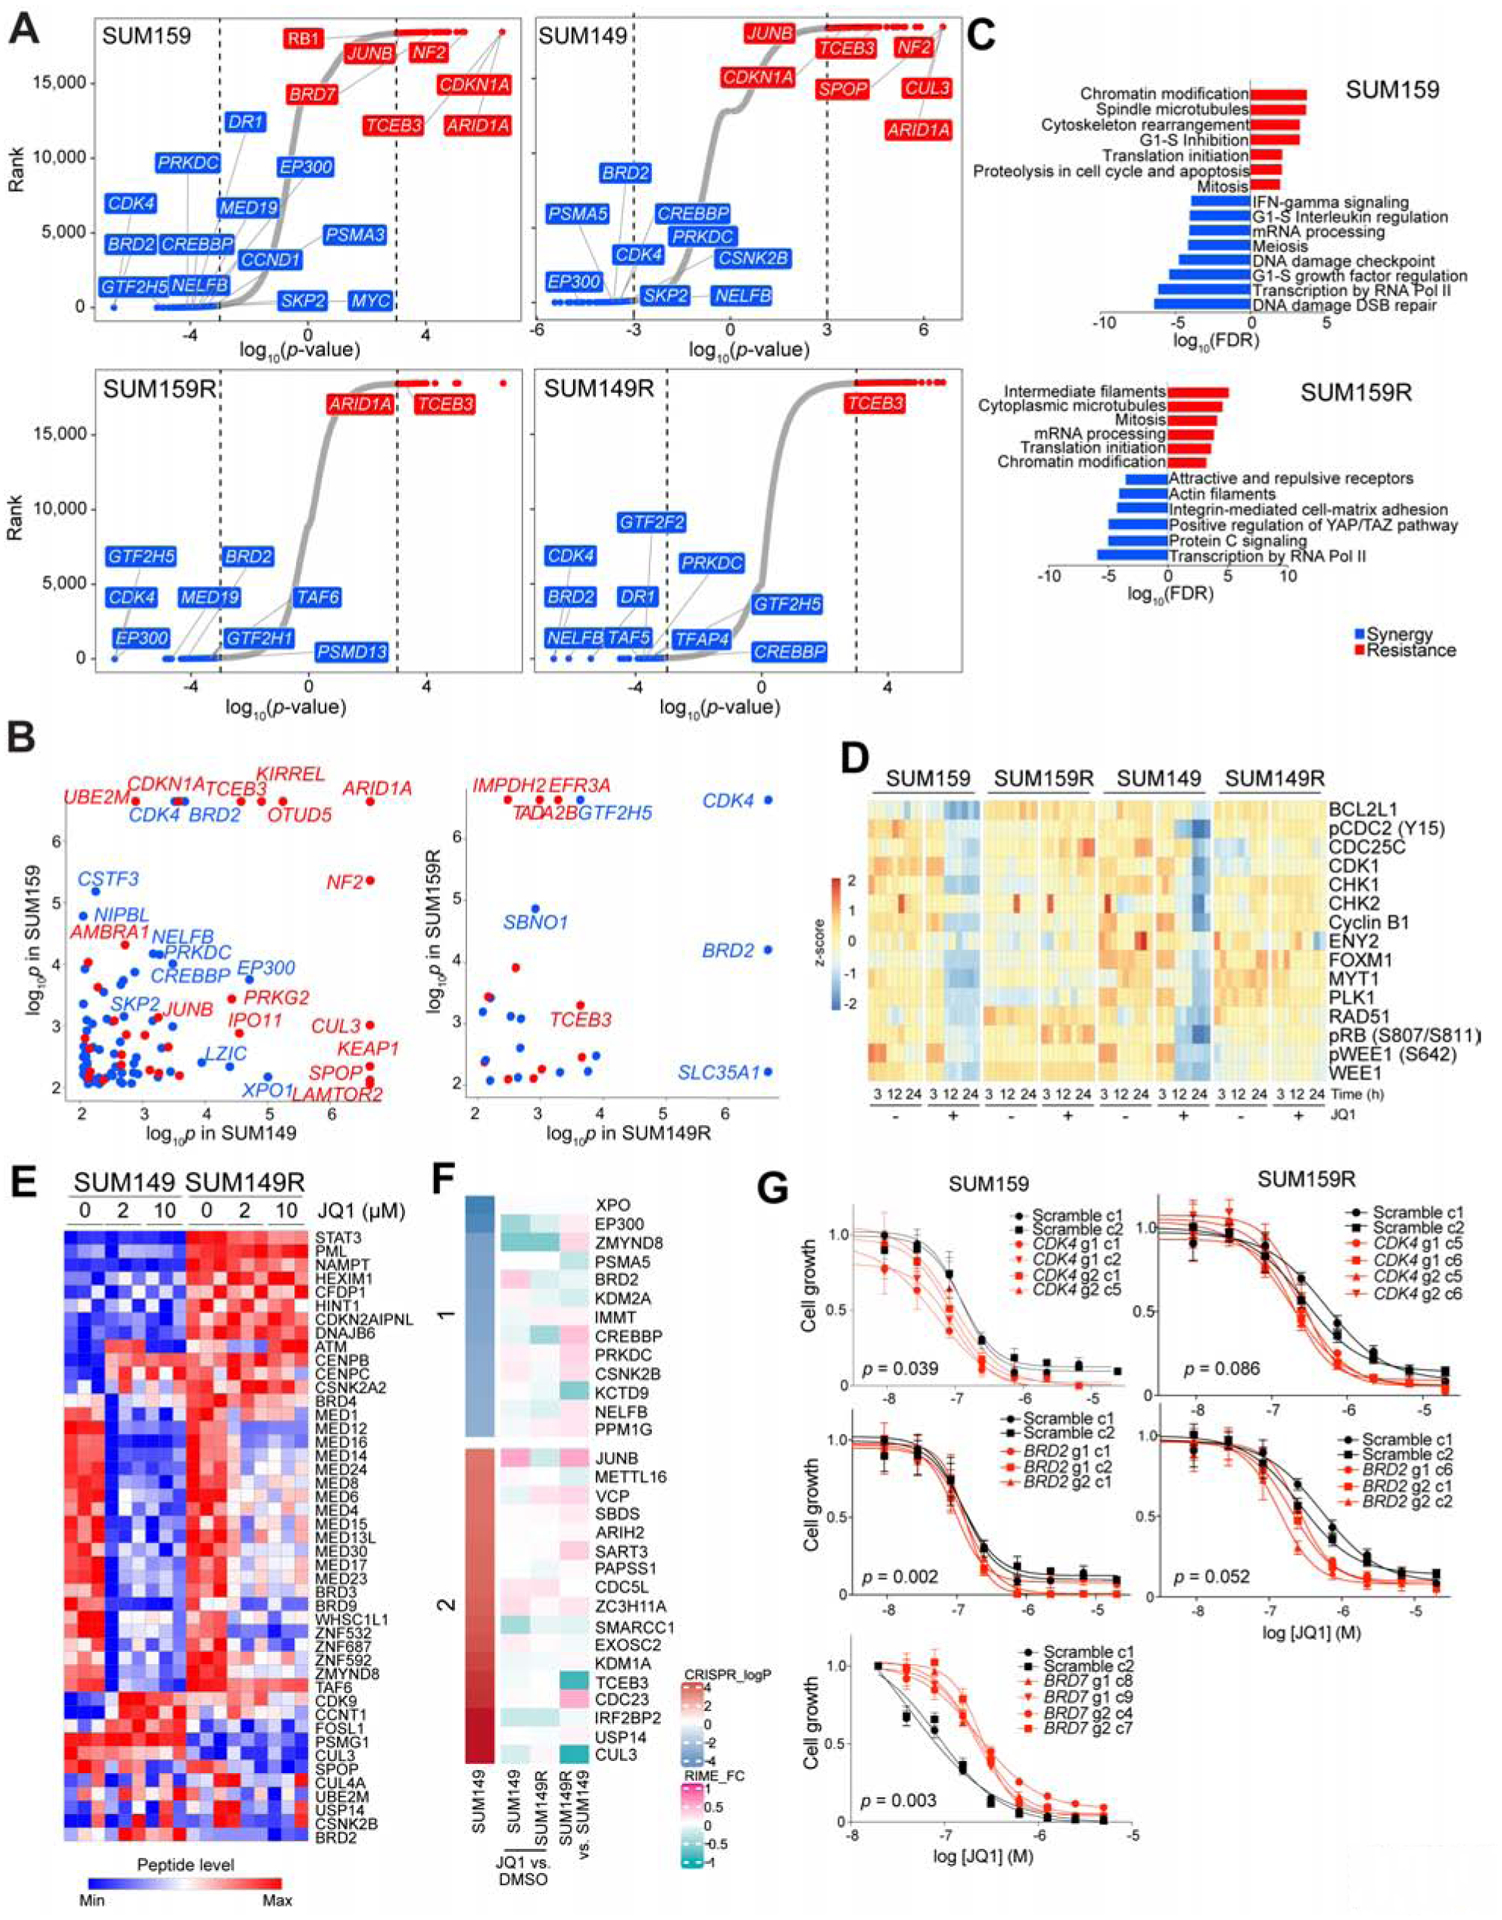
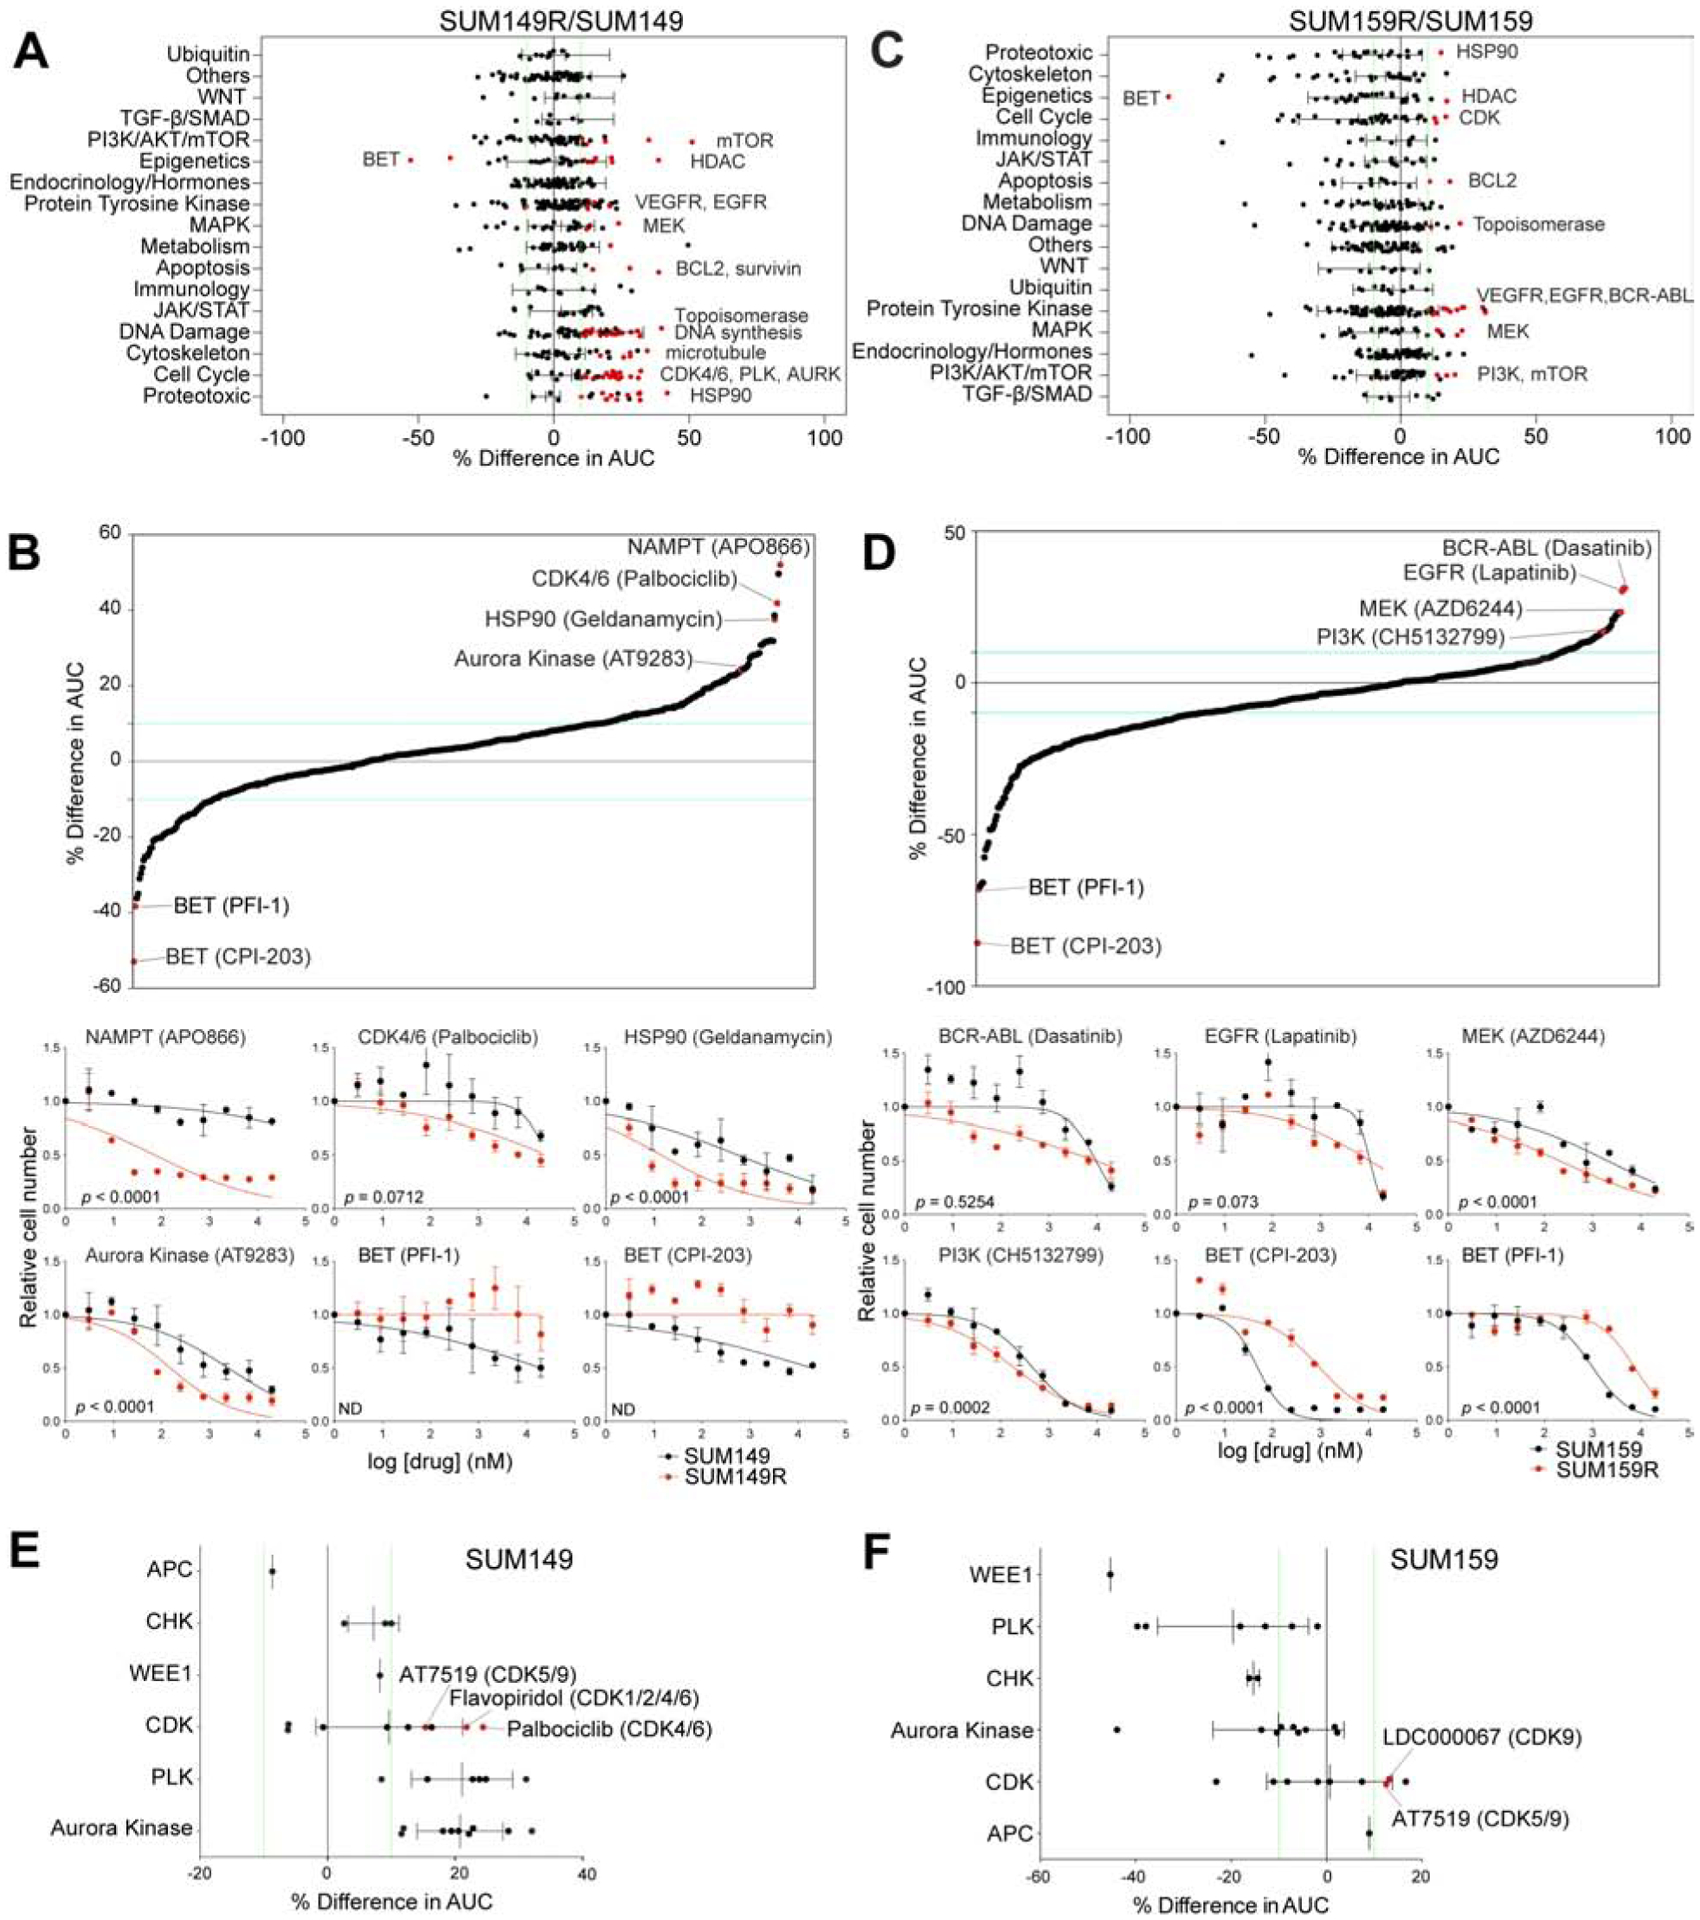
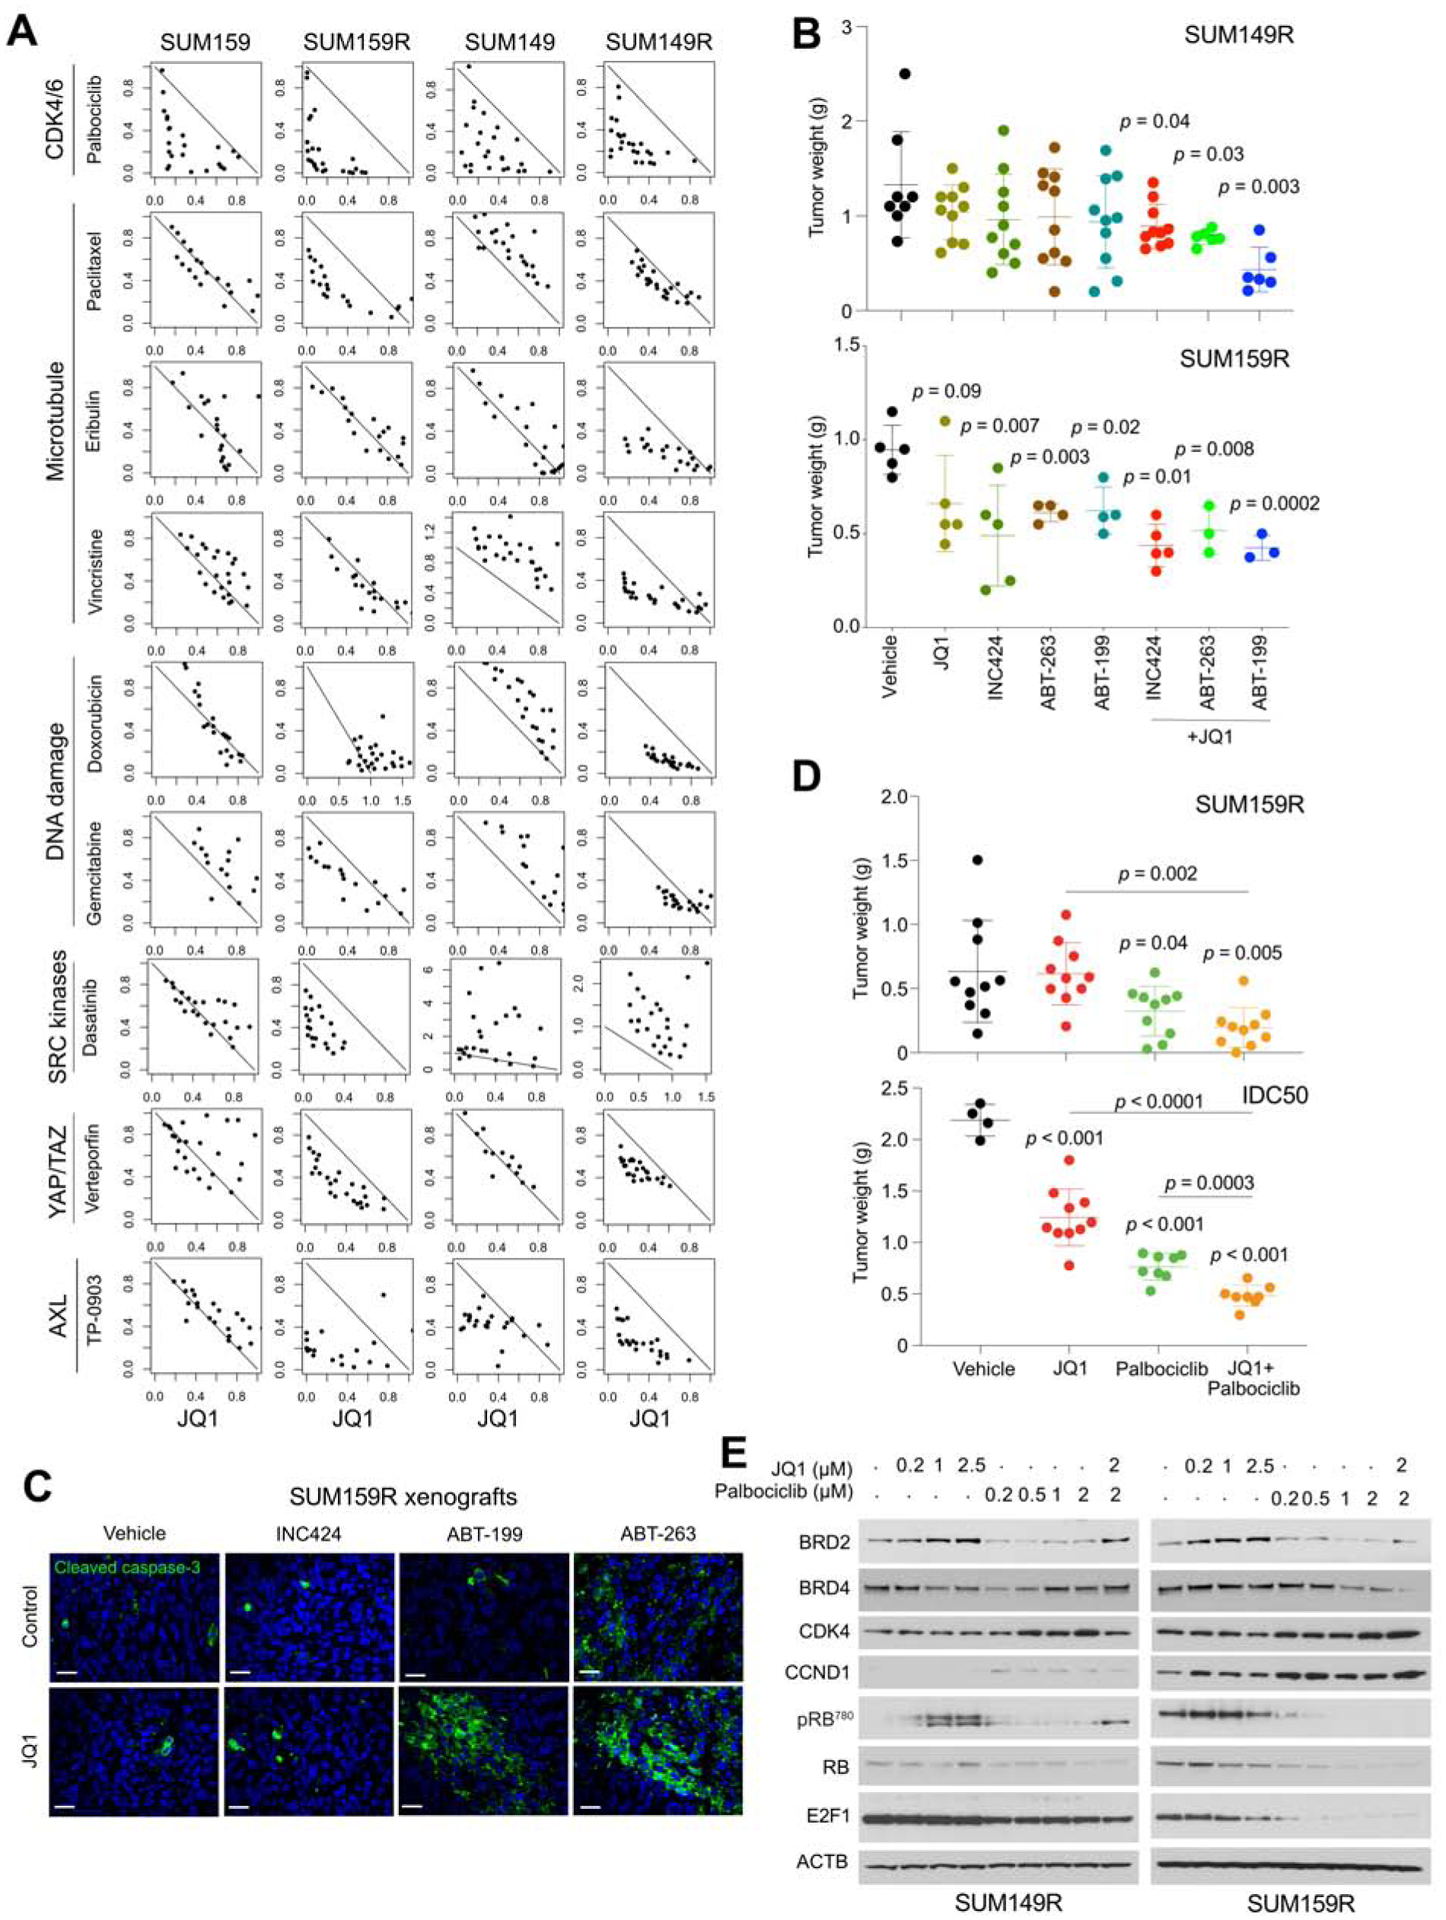
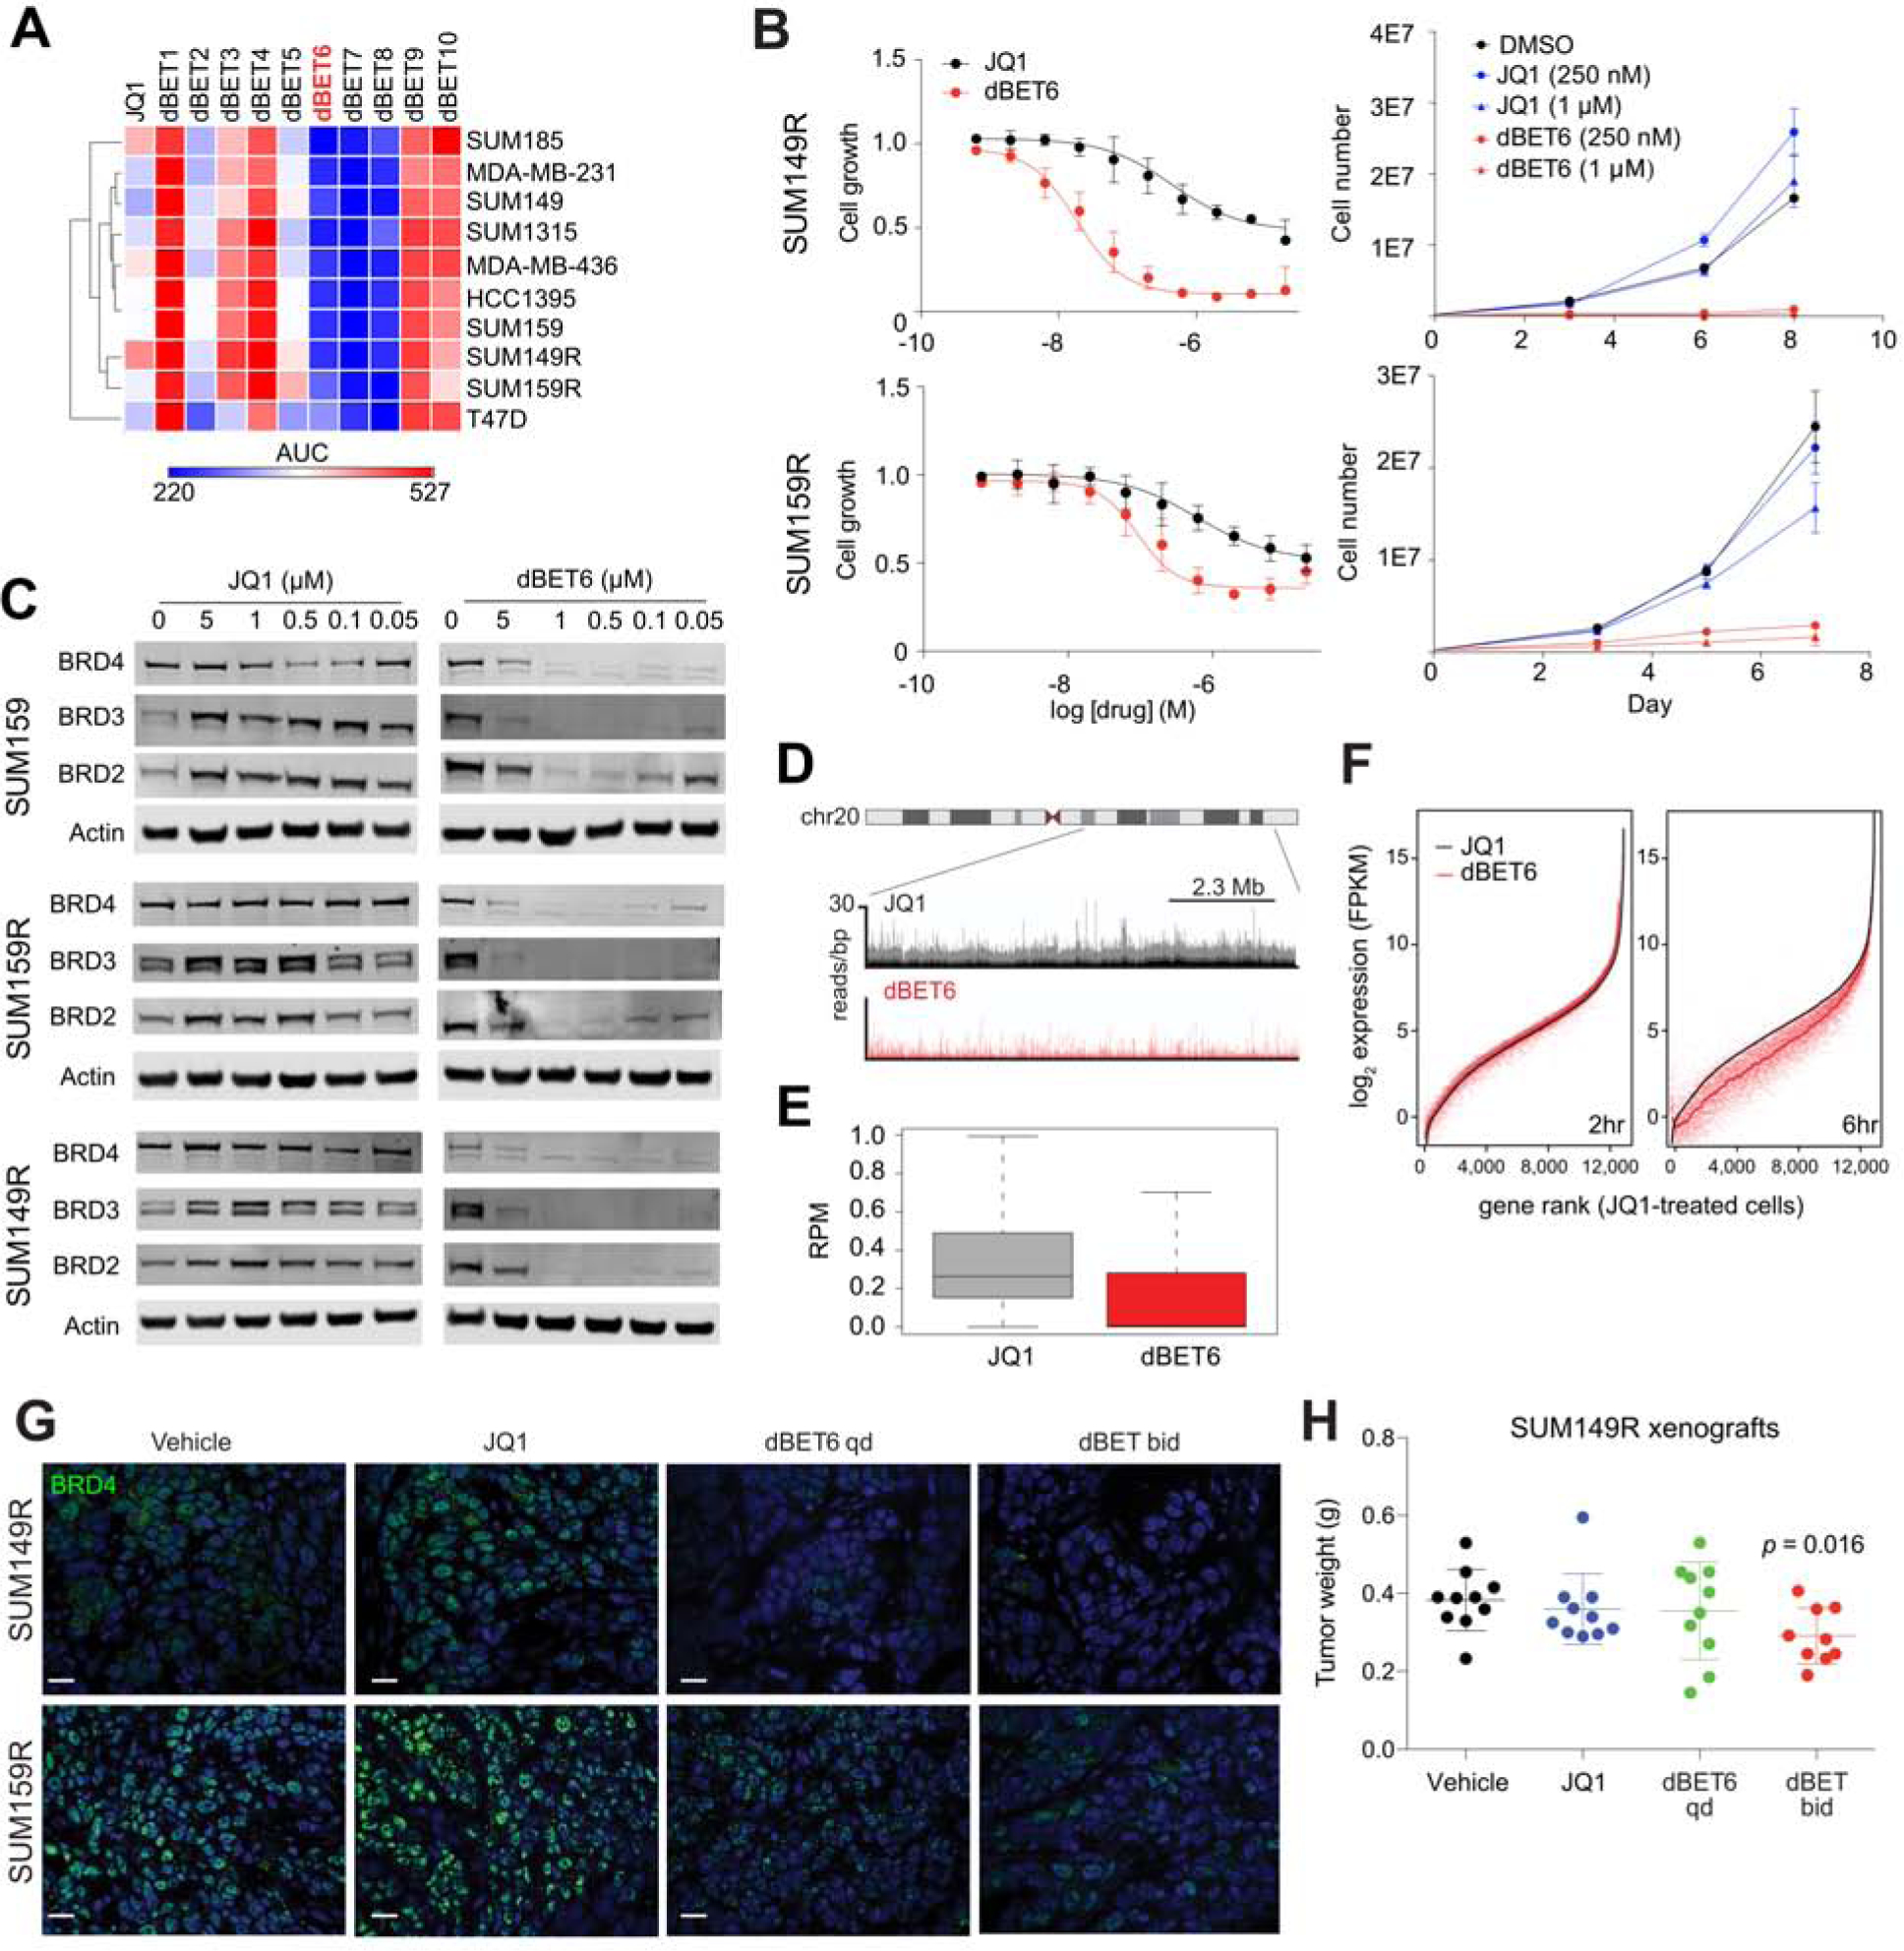
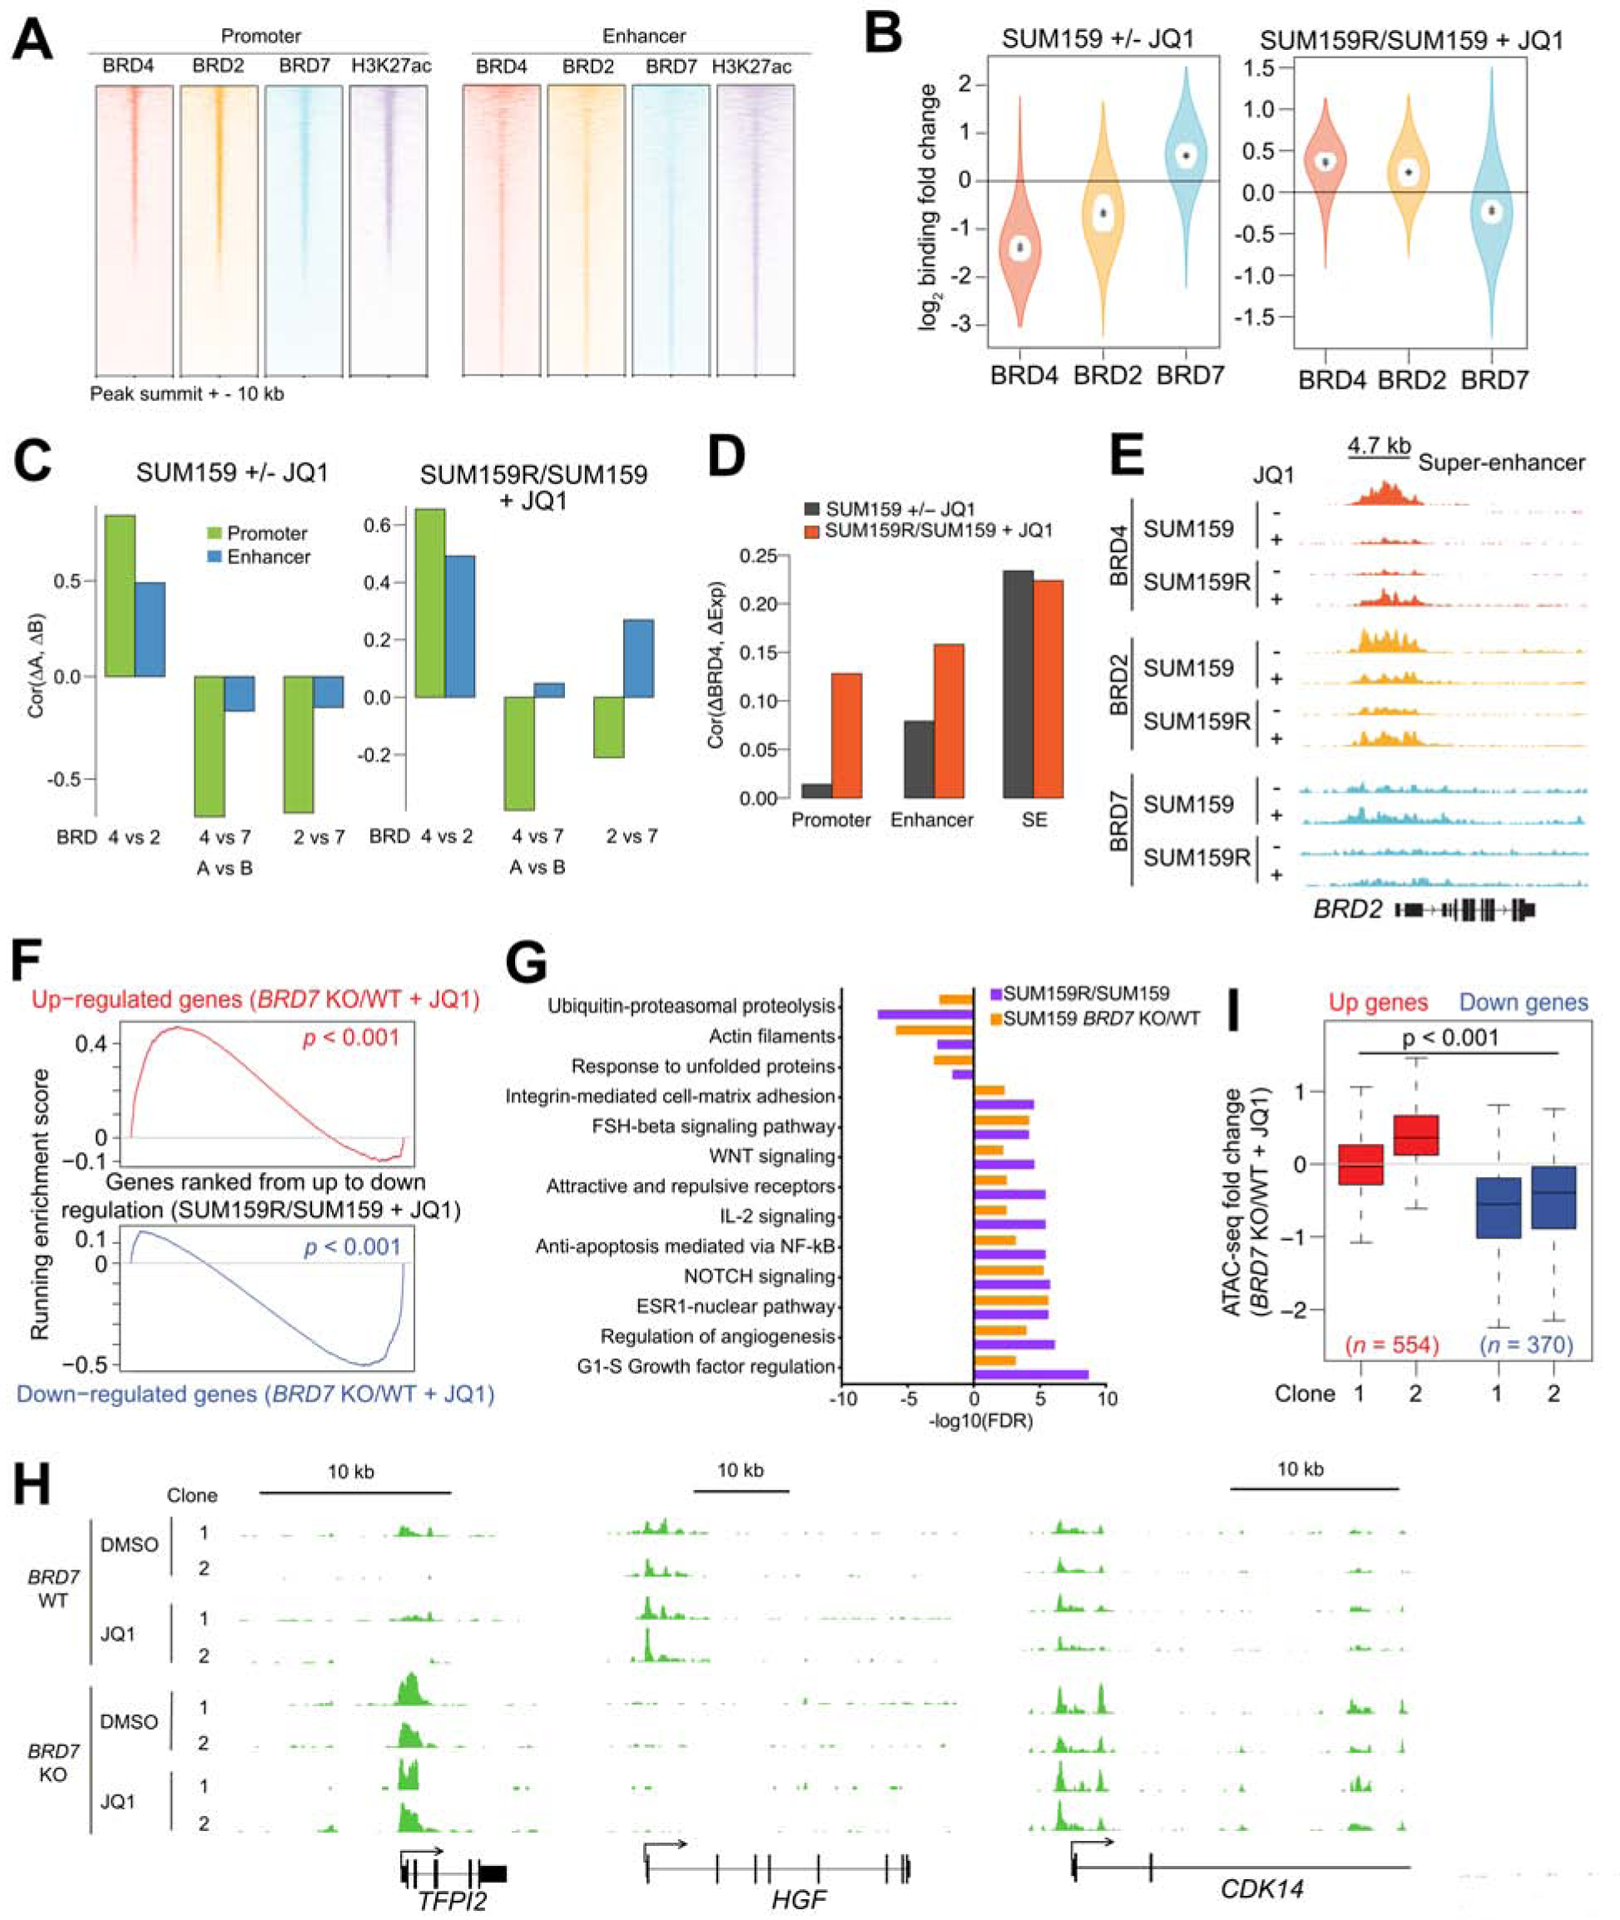
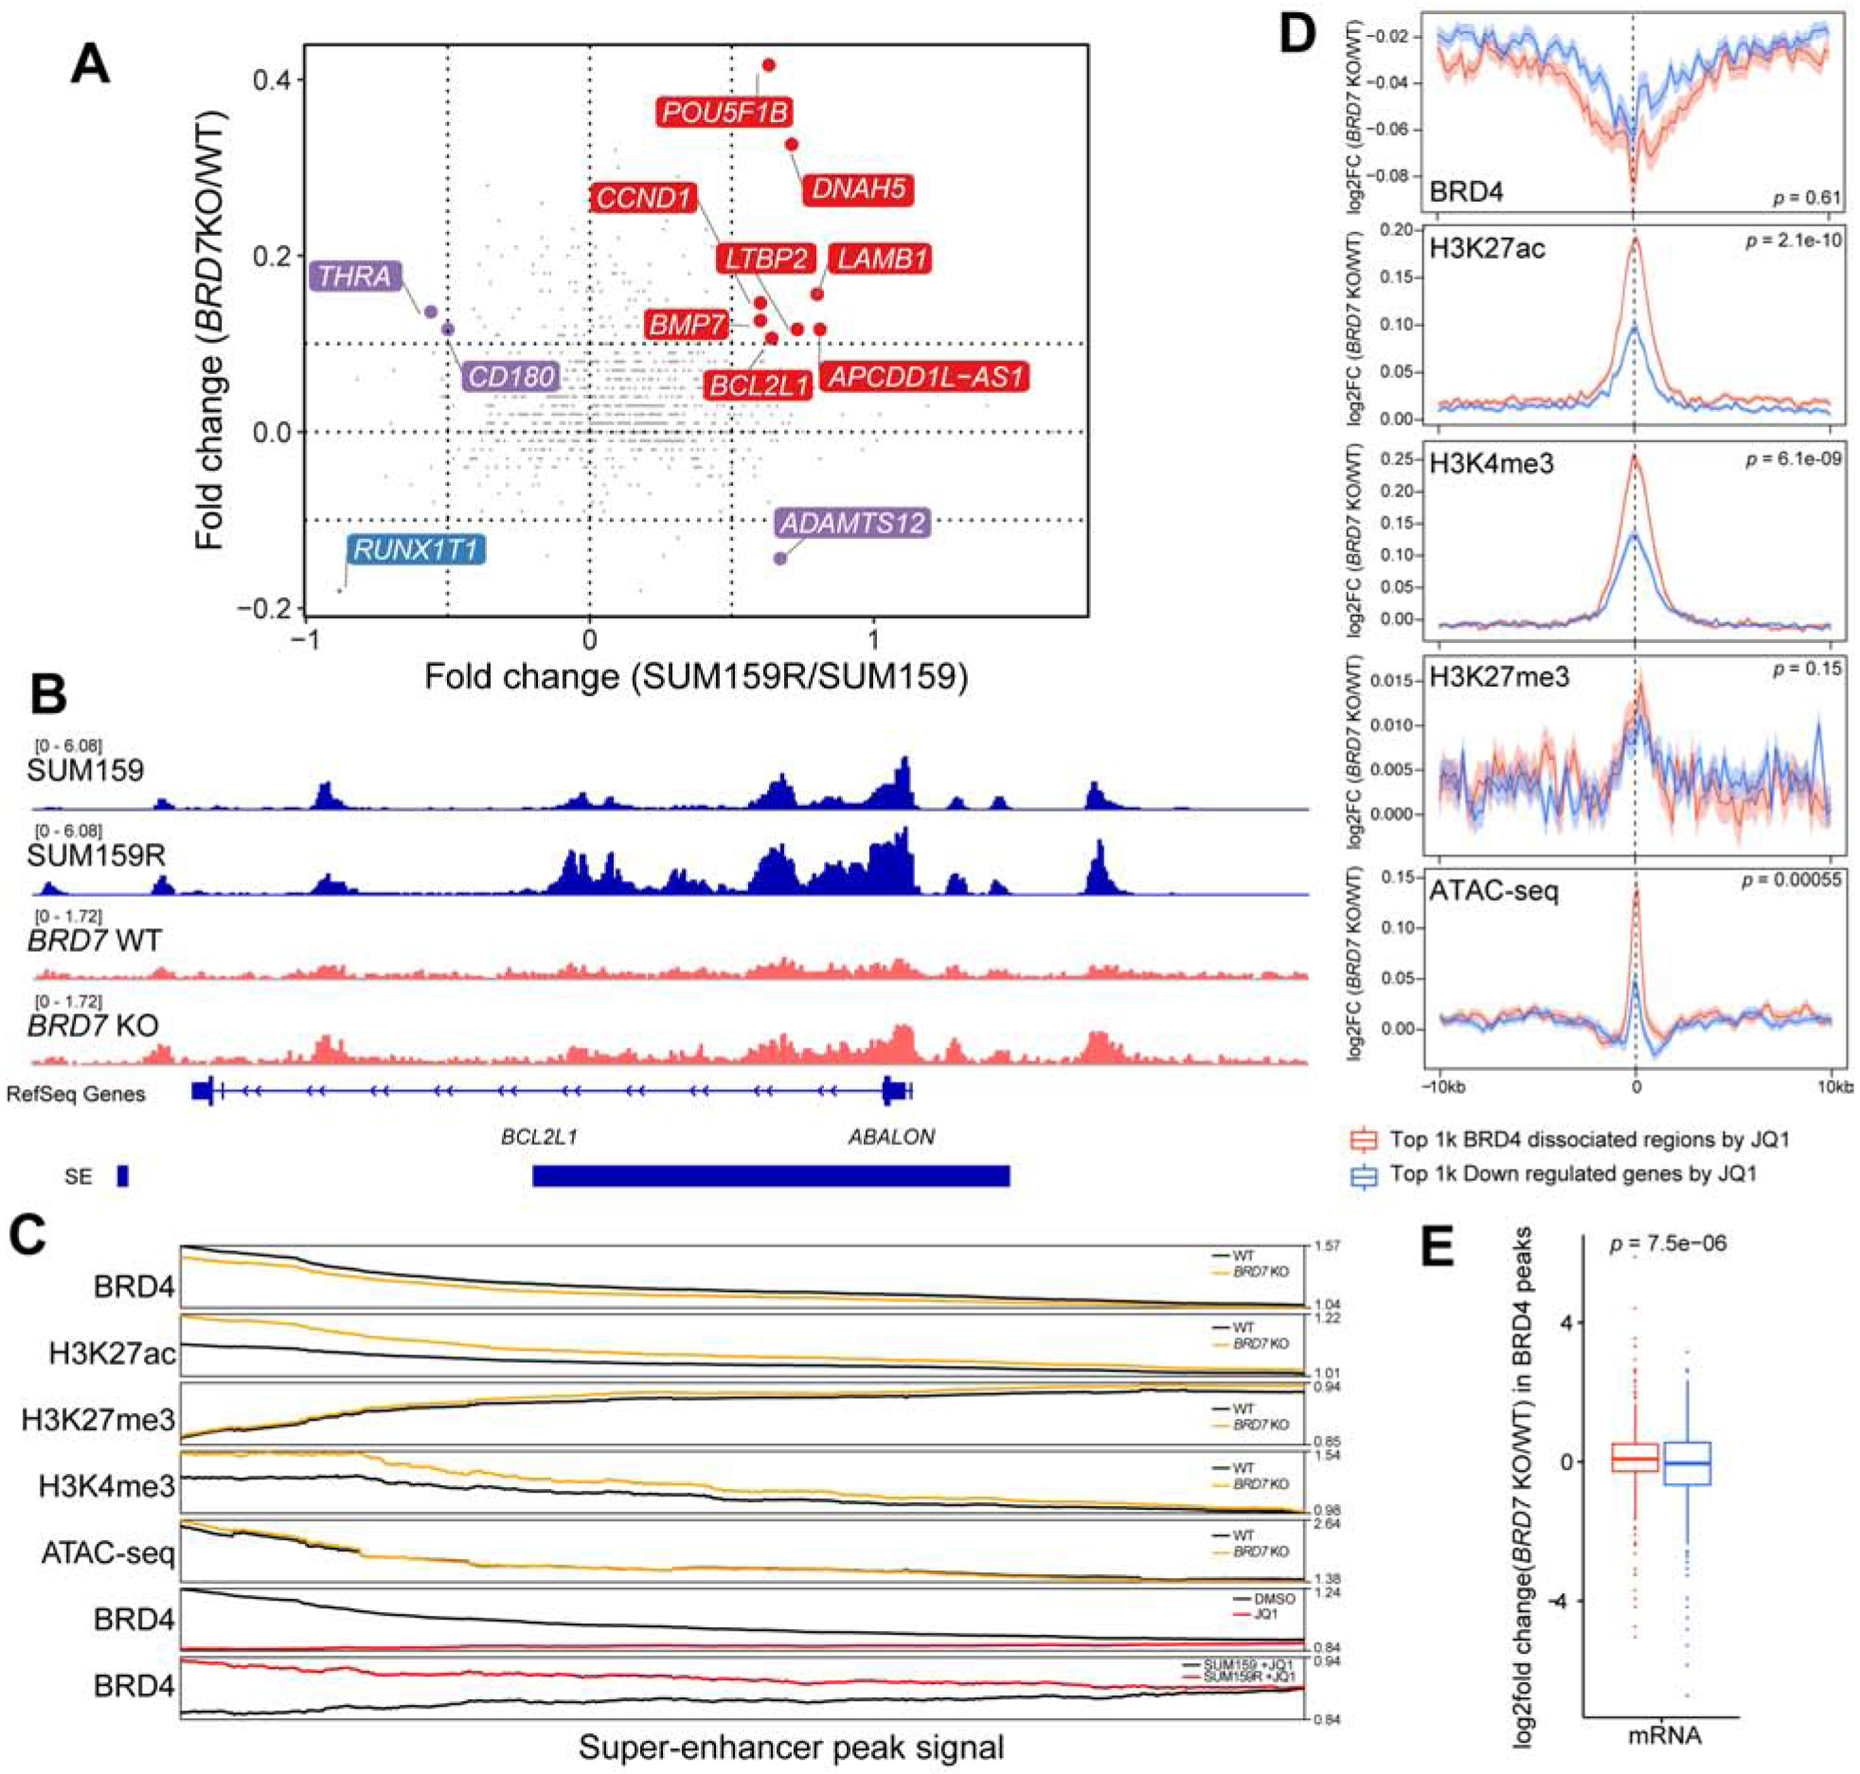
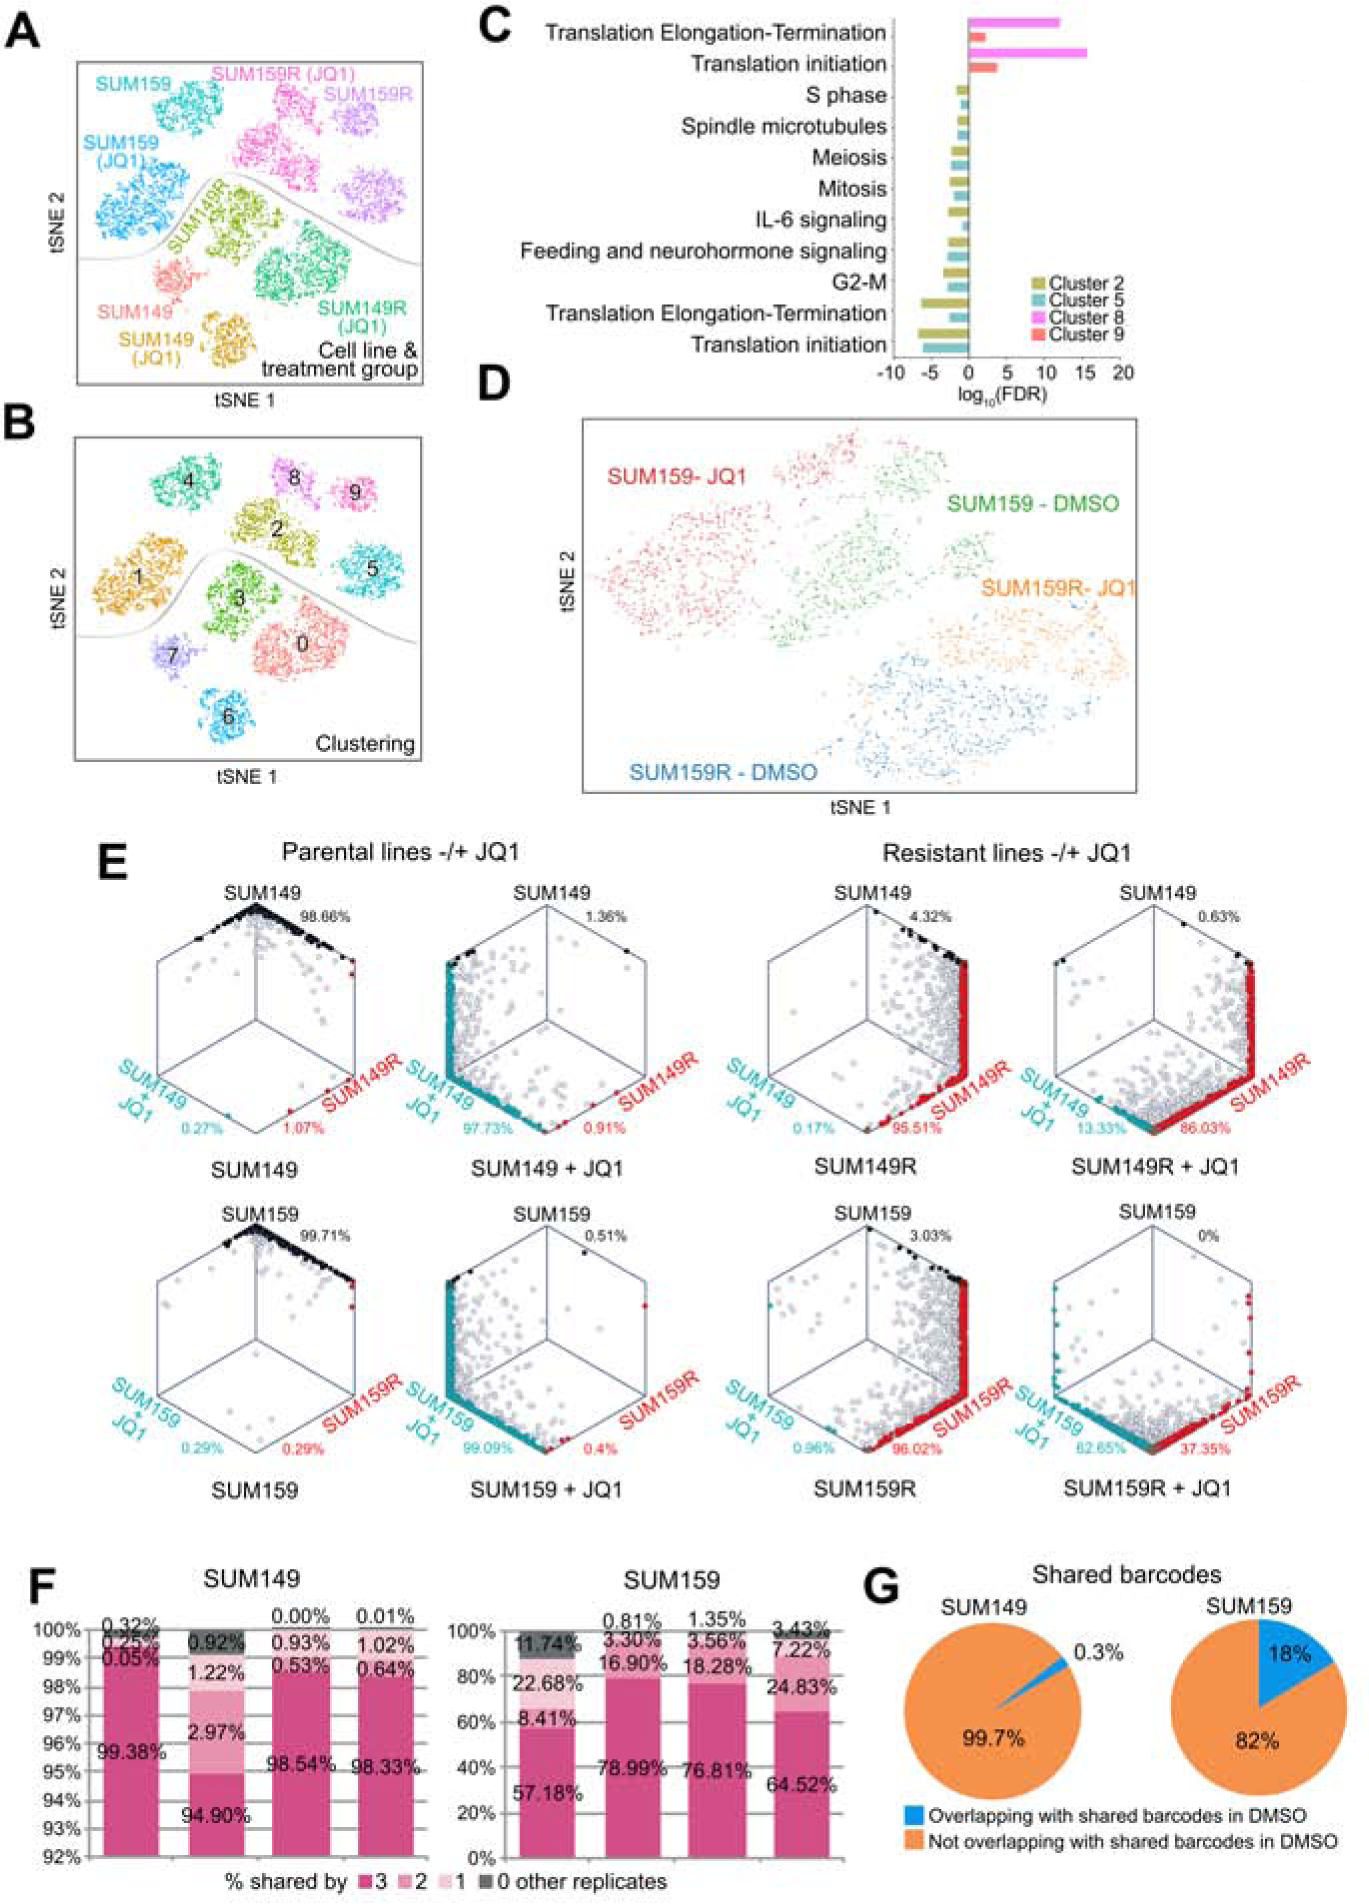
BET bromodomain inhibitors (BBDIs) are candidate therapeutic agents for triple-negative breast cancer (TNBC) and other cancer types, but inherent and acquired resistance to BBDIs limits their potential clinical use. Using CRISPR and small-molecule inhibitor screens combined with comprehensive molecular profiling of BBDI response and resistance, we identified synthetic lethal interactions with BBDIs and genes that, when deleted, confer resistance. We observed synergy with regulators of cell cycle progression, YAP, AXL, and SRC signaling, and chemotherapeutic agents. We also uncovered functional similarities and differences among BRD2, BRD4, and BRD7. Although deletion of BRD2 enhances sensitivity to BBDIs, BRD7 loss leads to gain of TEAD-YAP chromatin binding and luminal features associated with BBDI resistance. Single-cell RNA-seq, ATAC-seq, and cellular barcoding analysis of BBDI responses in sensitive and resistant cell lines highlight significant heterogeneity among samples and demonstrate that BBDI resistance can be pre-existing or acquired.

Keywords: ATAC-seq; BET bromodomain inhibitors; CRISPR screen; ChIP-seq; cellular barcoding; single cell ATAC-seq; single cell RNA-seq; small molecule inhibitor screen; therapeutic resistance; triple-negative breast cancer.


Conflict of interest statement

Declaration of Interests M.B. and K.P. received research support and were consultants to the Novartis Institutes for BioMedical Research during the execution of this study. K.P. serves on the scientific advisory board of Farcast Biosciences and Acrivon Therapeutics. M.B. receives sponsored research support from Novartis, serves on the SAB of Kronos Bio, and is a consultant to GTx, Inc., Aleta Biotherapeutics, and H3 Biomedicine. R.Z. and J.B. are current employees of C4 Therapeutics Inc. and Novartis, respectively. C.K. is a scientific founder, fiduciary board of directors member, scientific advisory board member, consultant, and shareholder of Foghorn Therapeutics, Inc. (Cambridge, MA). S. Shu, K.P., and J.B. are inventors of a patent on BET inhibitor resistance that DFCI licensed to Roche.

Figures

Figure 1.
Figure 1.. CRISPR screen results and molecular profiles.
(A) Top hit genes in the CRISPR screen revealed by comparing untreated vs. JQ1-treated cells. Genes are ranked by log10(p-values) defined by MAGeCK. Significant resistance and synthetic lethal hits (p-value < 0.001) are marked in red and blue, respectively. (B) Comparison of CRISPR screen hits between the indicted cell lines. Genes with p-values < 0.001 in both cell lines are shown. (C) Top process networks enriched in CRISPR screen hits. (D) Heatmap of Cluster 8 in RPPA data representing proteins downregulated after JQ1 treatment in parental but not in BBDI-resistant cells. (E) Heatmap of BRD4 RIME data in SUM149 and SUM149R cells −/+ 3h JQ1 treatment at the indicated doses. (F) Heatmap of significant resistant (red) and synthetic lethal (blue) hits CRISPR screen hits and their BRD4 binding changes revealed by RIME in SUM149 and SUM149R cells in JQ1 compared to DMSO and in SUM149R compared to SUM149 cells. (G) Dose response curves of JQ1 of scramble or gene-specific sgRNA-expressing single cell clones derived from the indicated cell lines. See also Figures S1–3, and Tables S1–3.
Figure 2.
Figure 2.. Small molecule screen in BBI-resistant TNBC cells.
(A-D) Differences in drug sensitivities between SUM149R and SUM149 (A,B) and between SUM159R and SUM159 cells (C,D), grouped by pathways targeted by drugs in the library (A,C), and ordered by percent differences in AUC (B,D). Common targets of top hits are indicated (A,C), and individual dose-response curves of top hits are shown (B,D). (E-F) Differences in sensitivities of drugs targeting the cell cycle, grouped by target, in SUM149 (E), and SUM159 cells (F). See also Figure S3 and Table S4.
Figure 3.
Figure 3.. Validation of synthetic lethal interactions with JQ1.
(A) Synergy studies of JQ1 with various inhibitors in cell culture. Points represent paired values of drug concentrations assessed for synergism (see Methods). The diagonal line signifies drug additivity. Points above and below the line represent antagonistic and synergistic drug combinations, respectively. (B) Plots show xenograft weights after treatment with JQ1 and other drugs alone and in combinations. P-values indicate the statistical significance of differences compared to vehicle based on t-tests. (C) Immunofluorescence analysis of cleaved caspase-3 in SUM159R xenografts after single and combination treatments. Scale bars represent 50 μm. (D) Plots show xenograft weights after treatment with JQ1 and palbociclib, alone and in combination. (E) Immunoblot analysis of indicated proteins in SUM149R and SUM159R cells treated with the indicated doses of JQ1, palbociclib, and their combination for 12 hrs. See also Figure S4.
Figure 4.
Figure 4.. Targeted BET degradation in TNBC.
(A) Heatmap of sensitivities to JQ1 and dBET series, by surrogate levels of ATP content. Results of 10-point dose response curves after 72 hours of treatment are represented by area under curve (AUC). (B) Dose response curves (left) and growth curves (right) of JQ1 and dBET6 at indicated concentrations in SUM149R and SUM159R. (C) Immunoblot analysis of BRD2, BRD3, and BRD4 levels after 4 hours of treatment with JQ1 and dBET6 in SUM159, SUM159R, and SUM149R cells. (D) ChIP-seq tracks of BRD4 levels on chromosome 20 in SUM149R. Top track (black) shows the basal resistance state in the presence of 10 μM JQ1, and bottom track (red) shows 2 hours of treatment with 250 nM dBET6. (E) Boxplot of the global levels of chromatin-bound BRD4 after treatment with 10μM of JQ1 and 250 nM dBET6 for 2 hours. RPM, reads per million. (F) Expression levels of all active genes ranked by their expression after treatment with JQ1 for 2 hours (left) and dBET6 for 6 hours (right). (G) Immunofluorescence analysis of BRD4 in SUM149R and SUM159R xenografts treated with JQ1 (50 mg/kg, daily) or dBET6 (7.5 mg/kg, once or twice daily). Scale bars represent 50 μm. (H) Tumor weights of SUM149R xenografts following 2 weeks of treatment with JQ1 or dBET6. P-value indicates the statistical significance of difference compared to vehicle, based on t-test. See also Figure S4.
Figure 5.
Figure 5.. BRD4, BRD2 and BRD7 binding changes and their effects upon JQ1 treatment.
(A) ChIP-seq binding enrichment of BRD4, BRD2, BRD7, and H3K27ac in promoter and enhancer regions in SUM159 cells. (B) BRD4, BRD2, and BRD7 ChIP-seq binding changes between JQ1-treated (+JQ1) and untreated (−JQ1) SUM159 cells and between JQ1-treated resistant (SUM159R) and parental cells. Outer violin indicates the entire distribution, inner violin (white) indicates the IQR, and “.” and “+” indicate the median and mean, respectively. (C) Pairwise correlations of BRD4, BRD2, and BRD7 ChIP-seq binding changes in promoter and enhancer regions. (D) Correlations of BRD4 binding changes in promoter, enhancer, and SE regions and their gene expression changes. (E) Gene tracks depicting BRD4, BRD2, and BRD7 signal at the BRD2 locus. (F) Gene set enrichment analysis (GSEA) depicting the relationship between expression of genes in JQ1-treated BRD7 KO cells and JQ1-treated resistant cells. (G) Top process networks enriched in differentially expressed genes between JQ1-treated BRD7 wild type (WT) and BRD7 knockout (KO) SUM159 cells and between JQ1-treated SUM159R and SUM159 cells. (H) Gene tracks depicting ATAC-seq signal at selected genomic loci in SUM159 BRD7 WT and KO cells. (I) Association between ATAC-seq binding changes and gene expression changes in two JQ1-treated BRD7 KO clones compared with JQ1-treated WT SUM159 cells. See also Figure S5 and Table S5.
Figure 6.
Figure 6.. The effects of BRD7 deletion on BRD4 binding and histone modification patterns.
(A) Changes in SEs upon BRD7 knockout and between JQ1 sensitive and resistant SUM159 cells. Red is the co-activated super enhancers; blue is co-repressed super enhancers. Purple is the discrepant regulated super enhancers. (B) Example for a differential H3K27ac signal in a SE region. Normalized H3K27ac ChIP-seq signals (Reads Per Million) are shown as tracks using IGV. (C) Line plot shows smoothed signal of BRD4, H3K27ac, H3K27me3, and H3K4me3 ChIP-seq and ATAC-seq in BRD7 knockout and scramble SUM159 cells at SEs, and comparison to that of BRD4 ChIP-seq signal in DMSO, JQ1-treated and JQ1-resistant SUM159 cells (bottom two tracks). SEs are ranked by the fold change of BRD4 signal between +/− JQ1 from high (left) to low (right). (D) Changes in BRD4, H3K27ac, H3K27me3, H3K4me3, and ATAC-seq signal at top 1,000 BRD4 binding sites sensitive to JQ1 in SUM159 cells (red) and at top 1,000 genes downregulated by JQ1 in SUM159 cells (blue). ChIP-seq signals on peak summit +/− 10kb region. (E) Changes in mRNA levels at BRD4 peaks differential between BRD7 KO and WT cells at top 1,000 BRD4 binding sites sensitive to JQ1 in SUM159 cells (red) and at top 1,000 genes downregulated by JQ1 in SUM159 cells (blue). See also Figures S6.
Figure 7.
Figure 7.. Single cell profiling of drug-resistant cells.
A-B, t-SNE plots depicting single cells by single cell RNA-seq in populations of JQ1-treated and untreated SUM149 and SUM159 parental and BBDI-resistant SUM149R and SUM159R cells, colored by cell line and treatment group (A), and by gene expression cluster (B). (C) Top process networks enriched in differentially expressed genes between clusters 6 and 9 (DMSO) and between clusters 2 and 8 (JQ1) within SUM159R cells. (D) t-SNE plots depicting single cells by single cell ATAC-seq in populations of JQ1-treated and untreated SUM159 parental and BBDI-resistant SUM159R cells. (E) Hexagonal plots depicting the bootstrap classification of single cells in populations of parental, JQ1-treated, BBDI-resistant, and JQ1-treated BBDI-resistant cells. Each point is a single cell and is positioned along axes according to its bootstrapping classification score for the indicated cell identity. Black, blue, and red cells are classified as parental, JQ1-treated, and BBDI-resistant cells, respectively, and gray cells are unclassified. (F) Bar graphs show percentages of total barcodes shared among all replicates in JQ1-treated SUM149 and SUM159 cells. (G) Pie charts show percentages of shared barcodes overlapping between untreated and JQ1-treated SUM149 and SUM159 cells. See also Figure S7 and Table S6.

Comment in

References

    1. Abraham J, Coleman R, Elias A, Holmes FA, Kalinsky K, Kittaneh M, Lower E, Mahtani R, Terry Mamounas E, Pegram M, et al. (2018). Use of cyclin-dependent kinase (CDK) 4/6 inhibitors for hormone receptor-positive, human epidermal growth factor receptor 2-negative, metastatic breast cancer: a roundtable discussion by The Breast Cancer Therapy Expert Group (BCTEG). Breast Cancer Res Treat 171, 11–20. - PubMed
    1. Anders S, Pyl PT, and Huber W (2015). HTSeq--a Python framework to work with high-throughput sequencing data. Bioinformatics 31, 166–169. - PMC - PubMed
    1. Benjamini Y, and Hochberg Y (1995). Controlling the False Discovery Rate: A Practical and Powerful Approach to Multiple Testing J. Royal Statistical Society 57, 289–300.
    1. Bhang HE, Ruddy DA, Krishnamurthy Radhakrishna V, Caushi JX, Zhao R, Hims MM, Singh AP, Kao I, Rakiec D, Shaw P, et al. (2015). Studying clonal dynamics in response to cancer therapy using high-complexity barcoding. Nat Med 21, 440–448. - PubMed
    1. Buenrostro JD, Wu B, Litzenburger UM, Ruff D, Gonzales ML, Snyder MP, Chang HY, and Greenleaf WJ (2015). Single-cell chromatin accessibility reveals principles of regulatory variation. Nature 523, 486–490. - PMC - PubMed

Publication types

MeSH terms