. 2020 Jun 11;181(6):1423-1433.e11.
doi: 10.1016/j.cell.2020.04.045. Epub 2020 May 4.

Clinically Applicable AI System for Accurate Diagnosis, Quantitative Measurements, and Prognosis of COVID-19 Pneumonia Using Computed Tomography

Affiliations

Clinically Applicable AI System for Accurate Diagnosis, Quantitative Measurements, and Prognosis of COVID-19 Pneumonia Using Computed Tomography

Kang Zhang et al. Cell. .

Erratum in

Abstract

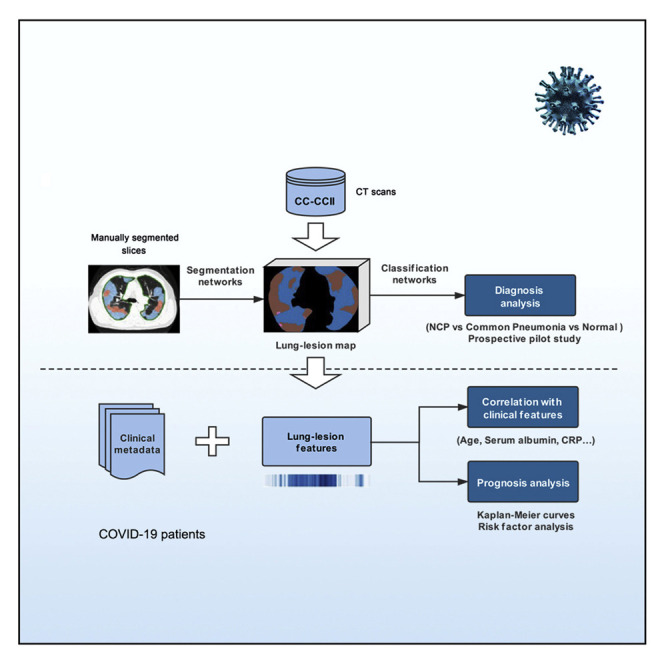
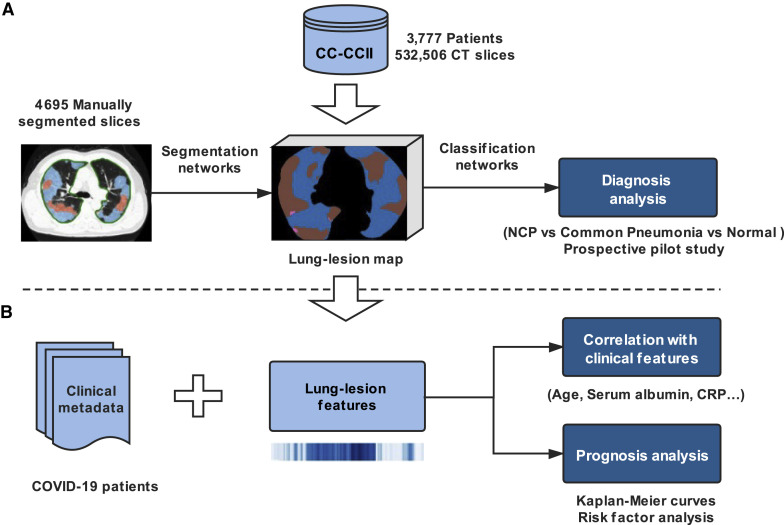
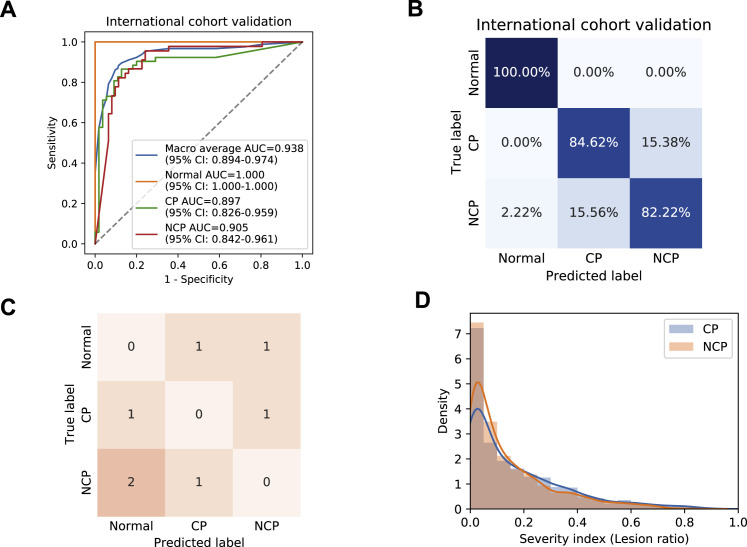
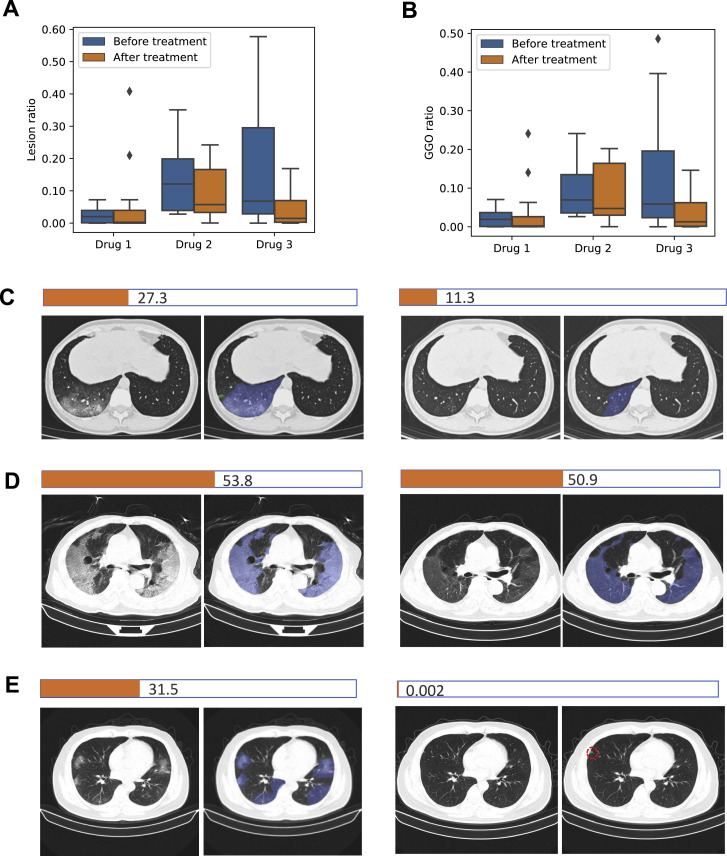
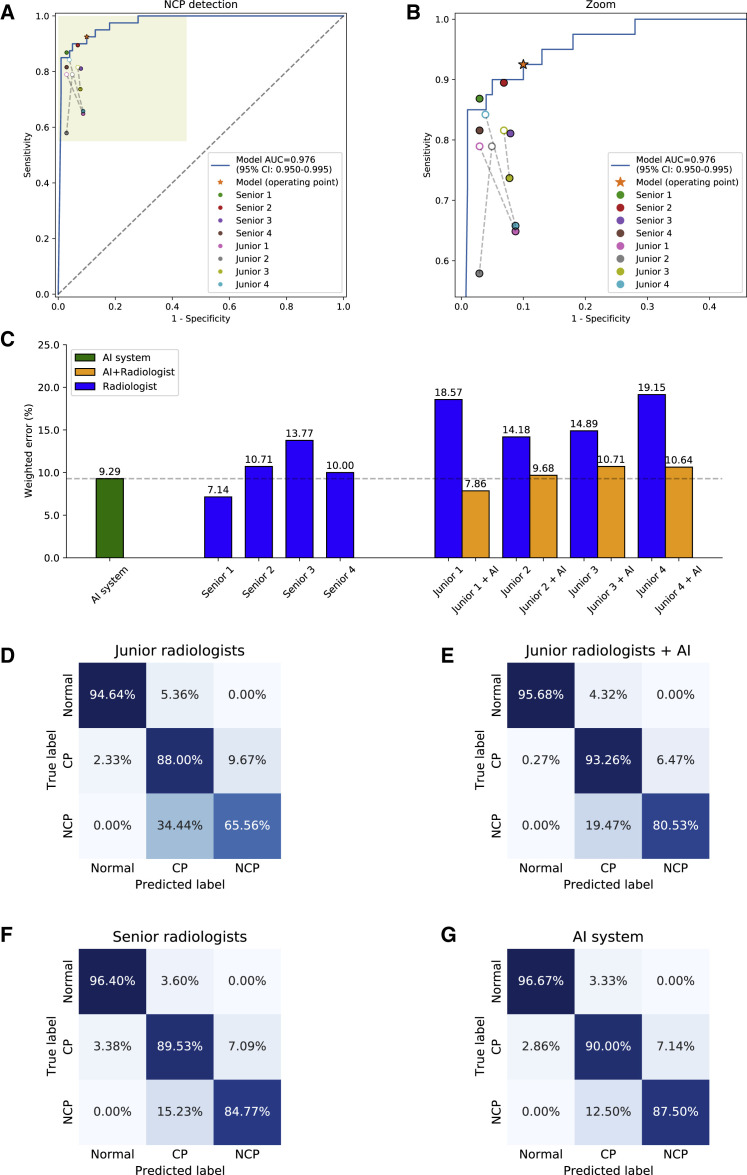
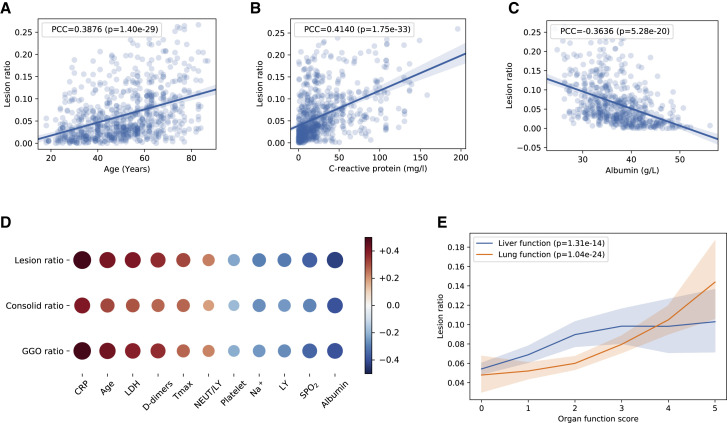
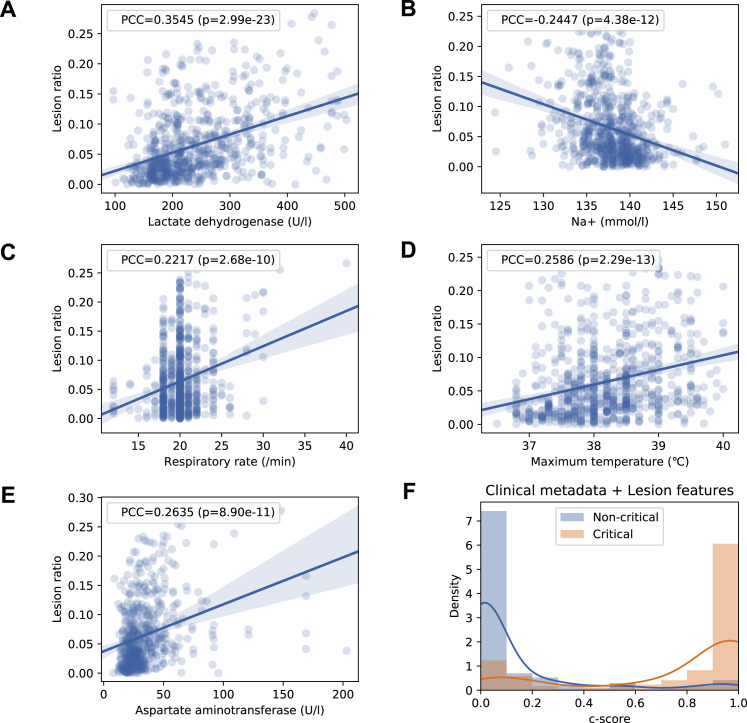
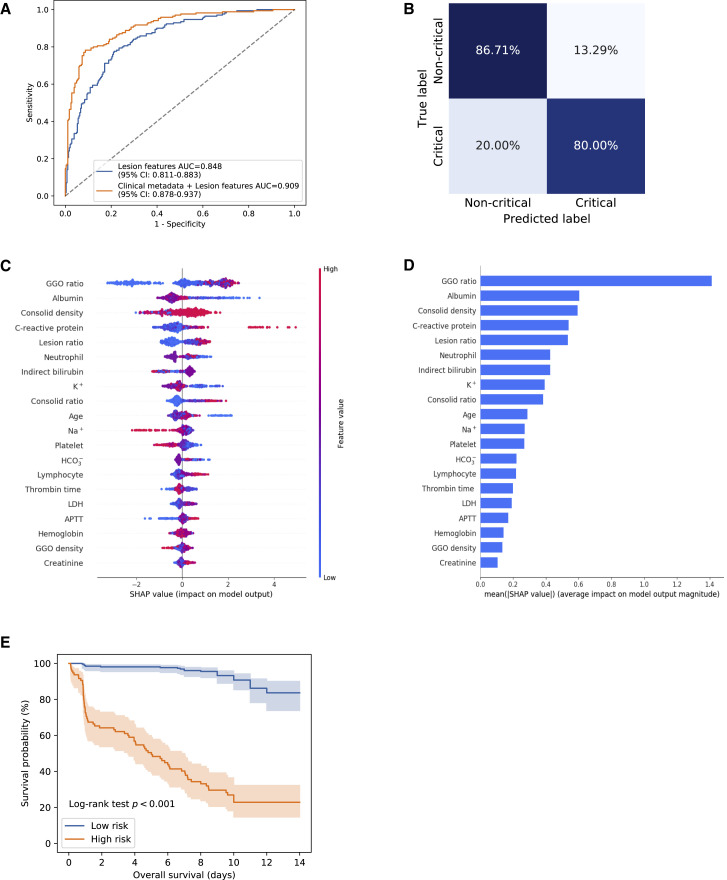
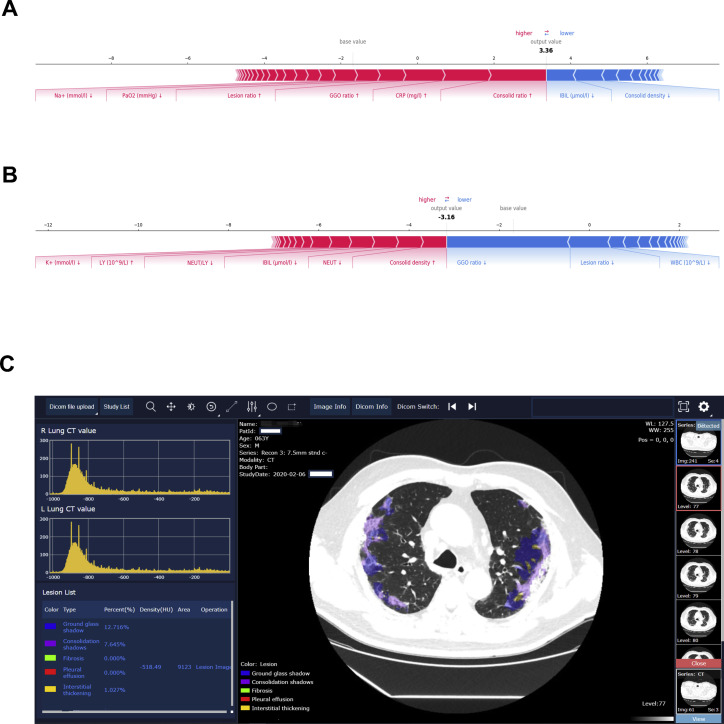
Many COVID-19 patients infected by SARS-CoV-2 virus develop pneumonia (called novel coronavirus pneumonia, NCP) and rapidly progress to respiratory failure. However, rapid diagnosis and identification of high-risk patients for early intervention are challenging. Using a large computed tomography (CT) database from 3,777 patients, we developed an AI system that can diagnose NCP and differentiate it from other common pneumonia and normal controls. The AI system can assist radiologists and physicians in performing a quick diagnosis especially when the health system is overloaded. Significantly, our AI system identified important clinical markers that correlated with the NCP lesion properties. Together with the clinical data, our AI system was able to provide accurate clinical prognosis that can aid clinicians to consider appropriate early clinical management and allocate resources appropriately. We have made this AI system available globally to assist the clinicians to combat COVID-19.

Keywords: AI; COVID-19; SARS-CoV-2; automated diagnosis; computed tomography; deep learning; pneumonia; prognosis analysis.


Conflict of interest statement

Declaration of Interests The authors declare no competing interests.

Figures

None
Graphical abstract
Figure 1
Figure 1
Our Proposed AI Framework for NCP Diagnosis and Prognosis Prediction (A) A large CT dataset was constructed using the data from CC-CCII (532,506 CT images from NCP, common pneumonia, and normal controls). The NCP diagnosis system consisted of two models: a lung-lesion segmentation model and a diagnosis prediction model. We first trained a segmentation network with 4,695 manually segmented images from NCP and common pneumonia patients. The diagnosis classifier took as input the previous lung-lesion map and generated probability of three classes: NCP, common pneumonia, and normal controls with classification networks. A number of prospective pilot studies were also conducted to test our AI performance for clinical application. (B) AI-assisted clinical prognosis estimation based on CT quantitative parameters and clinical metadata. A system for risk factor evaluation and Kaplan-Meier curve analysis for severe or critical illness as defined in the text was also implemented. See also Figure S1, Figure S2, and S7 and Table S1.
Figure S1
Figure S1
STARD Diagram Describing the CT Dataset Used for Our AI System from CC-CCII, Related to Figure 1 The exclusion criteria were also considered.
Figure S2
Figure S2
Illustration of Network Architectures of the Proposed AI Diagnostic System, Related to Figure 1 (A) Two-stage segmentation module for acceleration. In the first stage, we down-sampled the input image to a 128 × 128 level and segmented the lung field from the image, as the patterns of lung fields were easily learned at a relatively low resolution. In the second stage, we first calculated the bounding box with the lung field segmentation results. The key region was cropped from the original input image and resized it to a 256 × 256 level as the input for the second stage segmentation model. (B) The 3D classification networks used in our COVID-19 diagnosis system. For more details see STAR Methods.
Figure 2
Figure 2
Performance of Our AI System on a Lesion Segmentation Task Shown in Three Examples Left column: original CT slices from three NCP patients; middle column, manually segmented CT slices; right column, AI-based automated segmented CT slices. Row (A) A CT slice with mild NCP lesions defined as small ground-glass opacities (GGO) of bilateral lung involvement. Row (B) A CT slice with intermediate NCP lesions. Bilateral and predominantly peripheral lesions of GGO. Row (C) A CT slice with severe NCP lesions. Bilateral and peripheral mixed lesions of GGO and consolidation shadows. The severity level definitions are as follows: mild, defined as less than three GGO lesions of size less than 3 cm; intermediate, defined as a lesion area more than 25% of the entire lung field; severe, defined as a lesion area more than 50% of the entire lung field. See also Figure S3 and Table S2.
Figure S3
Figure S3
Segmentation Examples of Our Model for Lesion Segmentation Task, Related to Figure 2 Upper row, original CT slices of five types of lesions; middle row, manually segmented CT slices; lower column, AI-based automated segmented CT slices. The five columns represented CT slice with lesions of ground-glass opacity (GGO), consolidation, pulmonary fibrosis, interstitial thickening, and pleural effusion (from left to right).
Figure 3
Figure 3
Performance of Our AI System in Identifying NCP Patients from Patients with Other Common Types of Pneumonia and Normal Controls (A–D) Receiver operating characteristics (ROC) curves and normalized confusion matrices of multiclass classifications. The blue curve denoted macro-average area under the curve (AUC) of one (NCP) versus other two classes, including common pneumonia (CP) and normal controls (Normal). CI, confidence interval. (A and B) AI system performance on internal validation data. (A) ROC curves. (B) Normalized confusion matrix. For three-way classification: accuracy = 92.49%, AUROC = 0.9813 (95% CI: 0.9691–0.9902). For NCP versus the rest: accuracy = 92.49%, sensitivity = 94.93%, specificity = 91.13%, AUROC = 0.9797 (95% CI: 0.9665–0.9904). (C and D) AI performance on independent external validation data in Yichang (Hubei, China). (C) ROC curves. (D) Normalized confusion matrix. For a three-way classification: accuracy = 89.92%, AUROC = 0.9805 (95% CI: 0.9662–0.9899). For NCP versus the rest: accuracy = 90.70%, sensitivity = 92.51%, specificity = 85.92%, AUROC = 0.9712 (95% CI: 0.9516–0.9855). See also Figure S5.
Figure 4
Figure 4
Performance of the AI System in Prospective Pilot Studies in Four Independent Chinese Cohorts (A–F) ROC curves and normalized confusion matrices of multiclass classifications. The blue curve denoted macro-average AUC of one (NCP) versus other two classes, including common pneumonia (CP) and normal controls (Normal). (A and B) AI system performance on a cohort from an epidemic area in China (City of Wuhan). (A) ROC curves. (B) Normalized confusion matrix. For three-way classification: accuracy = 91.20%, AUROC = 0.9741 (95% CI: 0.9583–0.9856). For NCP versus the rest: accuracy = 91.20%, sensitivity = 94.03%, specificity = 88.46%, AUROC = 0.9610 (95% CI: 0.9403–0.9785). (C and D) AI system performance on a cohort from a non-epidemic area in China (City of Hefei). (C) ROC curves. (D) Normalized confusion matrix. For three-way classification: accuracy = 91.76%, AUROC = 0.9776 (95% CI: 0.9630–0.9899). For NCP versus the rest: accuracy = 90.32%, sensitivity = 94.74%, specificity = 89.19%, AUROC = 0.9700 (95% CI: 0.9500–0.9872). (E and F) AI system performance on a cohort from a non-epidemic area in China (City of Guangzhou). (E) ROC curves. (F) Normalized confusion matrix. For three-way classification: accuracy = 89.67%, AUROC = 0.9755 (95% CI: 0.9545–0.9896). For NCP versus the rest: accuracy = 84.78%, sensitivity = 90.00%, specificity = 84.15%, AUROC = 0.9512 (95% CI: 0.9124–0.9820).
Figure S5
Figure S5
Evaluation and Diagnostic Performance of the AI System, Related to Figure 3 (A and B) AI performance in an independent international cohort. Receiver operating characteristic curves (ROC) and normalized confusion matrix of the model for detecting NCP patients from common pneumonia (CP) and normal controls. For three-way classification: accuracy = 85.05%, AUROC = 0.9381 (95% CI: 0.8944-0.9742). For NCP versus the rest: accuracy = 84.11%, sensitivity = 86.67%, specificity = 82.26%, AUROC = 0.9050 (95% CI: 0.8421-0.9612). (C) Penalty scoring matrix. (D) A distribution plot of the severity index (lesion volume ratios) between NCP patients and common pneumonia patients, which represented a severity level comparison between the two disease groups. The distribution difference between these two groups was evaluated by a statistical measurement of Jaccard Similarity (JS), which was the intersection divided by the union of distribution of two samples. The JS of the lesion ratios for CP and NCP patients was of 0.939, suggesting that the distributions of severity levels were similarly matched and would not generate a bias in diagnosis analysis.
Figure S4
Figure S4
Evaluation of Drug Treatment Effects by AI-Based Lesion Quantitative Measurements, Related to STAR Methods Comparative measurements of ground glass opacities (GGO) and total lesion (lesion) volume ratio before and after a drug treatment in three preliminary drug treatment observation trials (drug 1, 2 and 3). (A and B) Bar graphs comparing lesion volume changes before and after treatment by three drugs. (C-E) Image examples of lesion changes before treatment (left panels) and after treatment (right panels). The NCP total lesion area in the example slice of each patient was quantified as a horizonal bar. A typical image with lesions and corresponding AI segmentation was presented for each drug treatment. For the AI segmentation color code, blue, purple and green represented GGO, consolidation (CL) and pulmonary fibrosis, respectively. (C) A representative patient from the drug 1 group. (D) A representative patient from the drug 2 group. (E) A representative patient from the drug 3 group. A t test was used to measure statistical significance comparing before and after a treatment. The lesion change comparison before and after treatment was no statistically significant in the drug 1 group, whereas it was significant in the Drug 2 group (p = 0.0345) and the Drug 3 (p = 0.00056).
Figure 5
Figure 5
Comparisons of Diagnostic Performance between Our AI Model and Practicing Radiologists (A and B) The performance of our AI system and eight practicing radiologists (four junior level and four senior level). ROC curve for diagnosis of NCP versus other classes. Filled dots denote junior and senior radiologists’ performances, while the hollow dots denote the performance of junior group with AI assistance. Dashed lines linked the paired performance values of each junior radiologist. (C) Weighted error results based on penalty scores (See Figure S5). (D–G) Confusion matrices of multiclass classification. (D) Confusion matrix of the mean diagnostic performance of four junior radiologists. (E) Confusion matrix of the mean diagnostic performance of four junior radiologists with AI assistance. (F) Confusion matrix of the mean diagnostic performance of four senior radiologists. (G) The AI system demonstrated performance comparable to that of senior practicing radiologists. Accuracy = 90.71%, sensitivity = 92.50%, specificity = 90.00%, AUROC = 0.9756 (95% CI: 0.9496–0.9948).
Figure 6
Figure 6
The Correlation of Lung-Lesion Features with Clinical Parameters (A–C) Linear regression analysis comparing the volume lesion ratio and three correlated clinical parameters, including (A) age, (B) CRP, and (C) albumin. (D) Correlation of three CT quantification features (volume ratio of GGO, CL, and total lesion) with clinical parameters. See STAR Methods for details. (E) The correlations of the volume ratio of lesion and the c-scores for lung function and liver functions graded by physicians. All p values remained statistically significant after the Holm-Bonferroni adjustment. LDH, lactic dehydrogenase. See also Figure S6.
Figure S6
Figure S6
The Correlation of Lung-Lesion Features with Clinical Parameters and Progression of Disease, Related to Figure 6 (A-E) Linear regression analysis comparing the volume lesion ratio and five correlated clinical parameters, including (A) serum lactate dehydrogenase (LDH), (B) Na+, (C) respiratory rate, (D) maximum body temperature, and (E) serum aspartate aminotransferase (AST). P-values were adjusted with the Holm-Bonferroni method. (F) A density plot of the c-score for the prognosis prediction model used in STAR Methods.
Figure 7
Figure 7
Risk Factors and Clinical Prognosis Analysis for Progression to Severe or Critical Illness (A) The ROC curves for a binary classification of progression to critical illness stratified by lesion features and the combination of lesion features and clinical metadata. (B) Corresponding normalized confusion matrix: sensitivity = 80.00%, specificity = 86.71%, AUROC = 0.9093 (95% CI: 0.8775–0.9369). (C and D) Illustration of features contributing to progression to critical illness by SHAP values. (C) The relative contributions of CT and clinical parameters for prognosis prediction. Features on the right of the risk explanation bar pushed the risk higher, and features on the left pushed the risk lower. (D) The relative contribution of each of the CT or clinical parameters to predict the risk of progression to severe or critical illness. (E) When the patients were stratified into high-risk (c-score ≥ 0.5) and low-risk (c-score < 0.5) groups, Kaplan-Meier curves of progression to critical illness showed a distinct difference in survival probability in this cohort. APTT, activated partial thromboplastin time; C-reactive protein, CRP; ground-glass opacity, GGO. See also Figure S4, Figure S6, and S7 and Table S4.
Figure S7
Figure S7
Illustration of Our AI System for Diagnosis and Clinical Prognosis Estimation of COVID-19 Patients during Clinical Deployment, Related to Figure 7 (A and B) Examples of clinical prognosis estimation. We selected two patients from the critical illness and the non-critical illness group to show interpretability of the effects of lung-lesion features and clinical parameters as the input risk factors for prognosis prediction. The effects of input from lung-lesion features and clinical parameters for risk prediction. Pink features pushed the risk higher (to the right) and blue features pushed the risk lower (to the left). (A) A patient from the critical illness group. (B) A patient from the non-critical illness group. (C) Our system provided lesion segmentation of CT images and quantitative analysis of all the lesion types.

References

    1. Badrinarayanan V., Kendall A., Cipolla R. Segnet: A deep convolutional encoder-decoder architecture for image segmentation. IEEE Trans. Pattern Anal. Mach. Intell. 2017;39:2481–2495. - PubMed
    1. Burlina P.M., Joshi N., Pekala M., Pacheco K.D., Freund D.E., Bressler N.M. Automated grading of age-related macular degeneration from color fundus images using deep convolutional neural networks. JAMA Ophthalmol. 2017;135:1170–1176. - PMC - PubMed
    1. Chan J.F., Yuan S., Kok K.H., To K.K., Chu H., Yang J., Xing F., Liu J., Yip C.C., Poon R.W. A familial cluster of pneumonia associated with the 2019 novel coronavirus indicating person-to-person transmission: a study of a family cluster. Lancet. 2020;395:514–523. - PMC - PubMed
    1. Chen L.-C., Papandreou G., Schroff F., Adam H. Rethinking atrous convolution for semantic image segmentation. arXiv:170605587. 2017
    1. Chen A., Karwoski R.A., Gierada D.S., Bartholmai B.J., Koo C.W. Quantitative CT Analysis of Diffuse Lung Disease. Radiographics. 2020;40:28–43. - PubMed

Publication types

MeSH terms