. 2020 May 28;181(5):1036-1045.e9.
doi: 10.1016/j.cell.2020.04.026. Epub 2020 May 15.

Imbalanced Host Response to SARS-CoV-2 Drives Development of COVID-19

Affiliations

Imbalanced Host Response to SARS-CoV-2 Drives Development of COVID-19

Daniel Blanco-Melo et al. Cell. .

Abstract

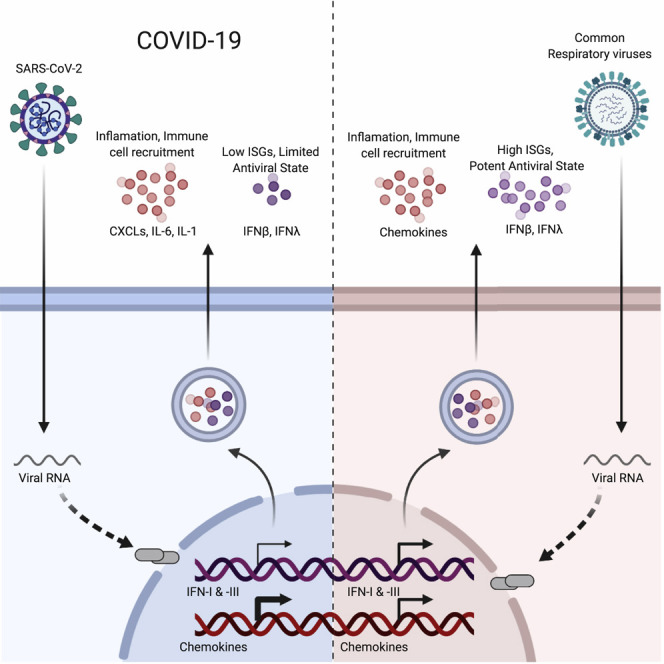
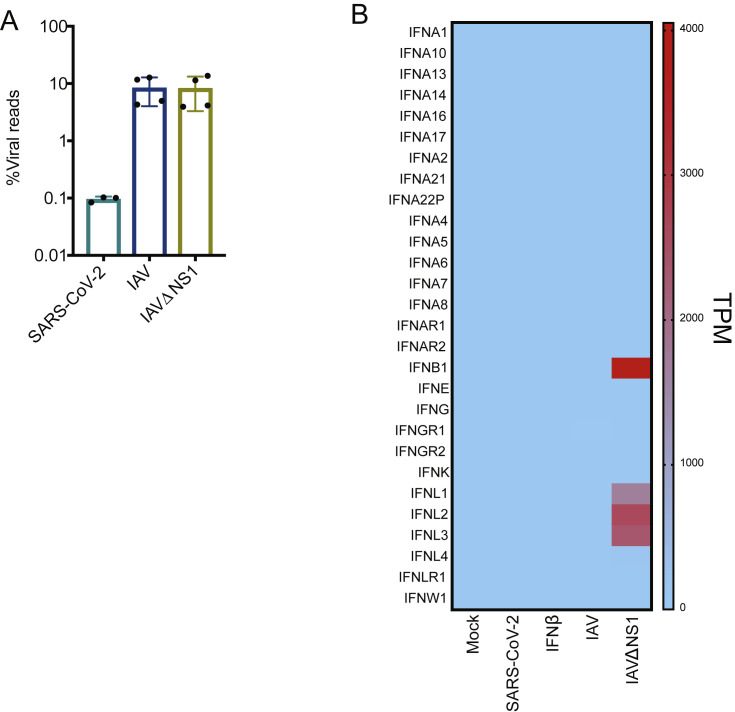
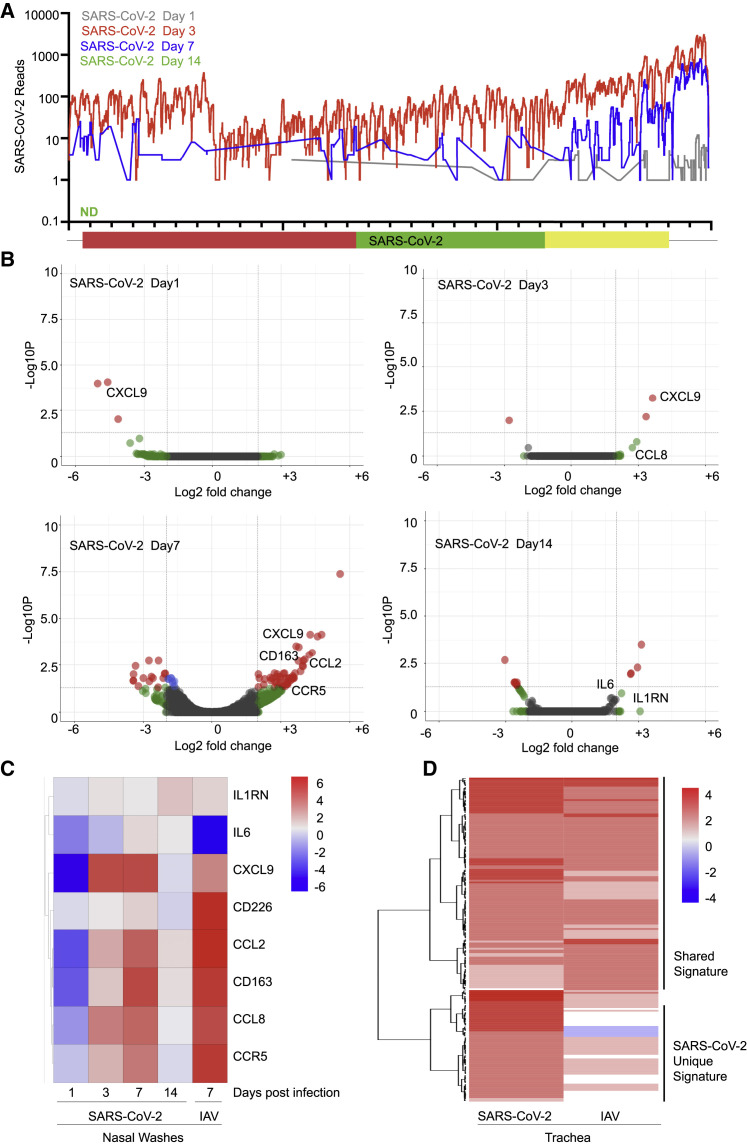
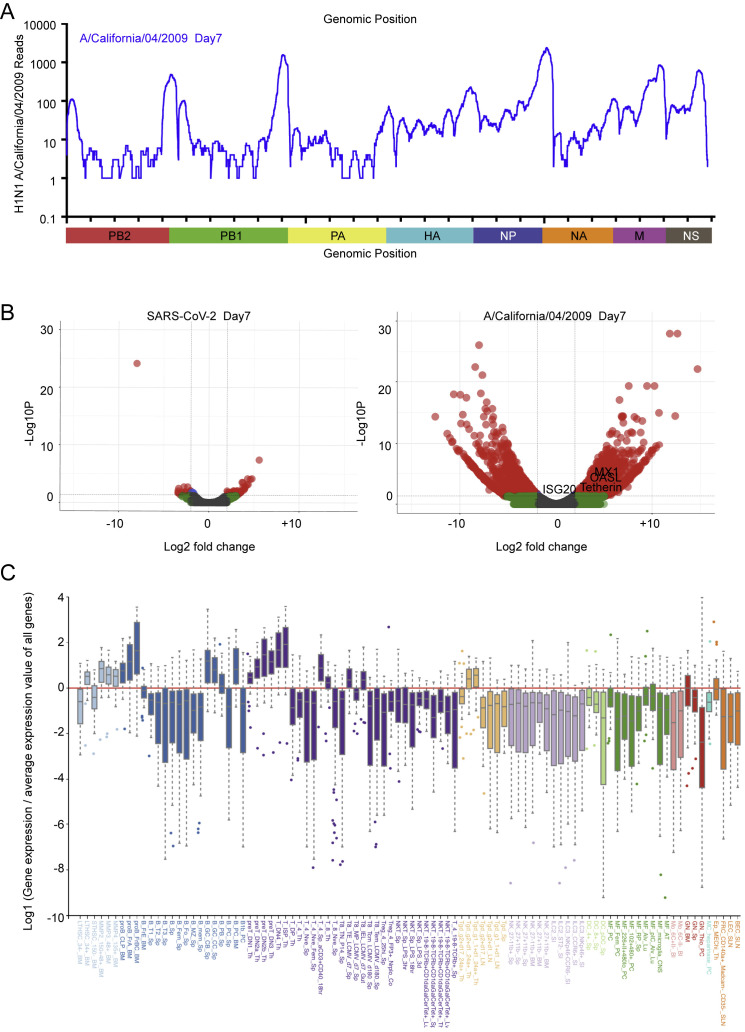
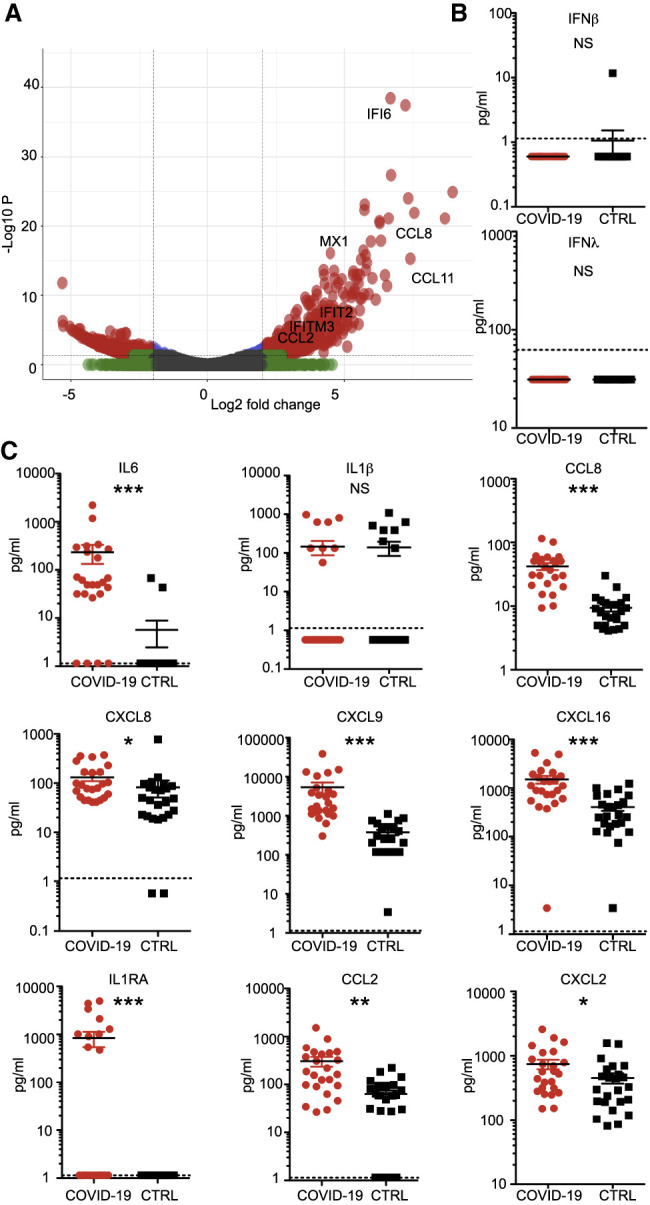
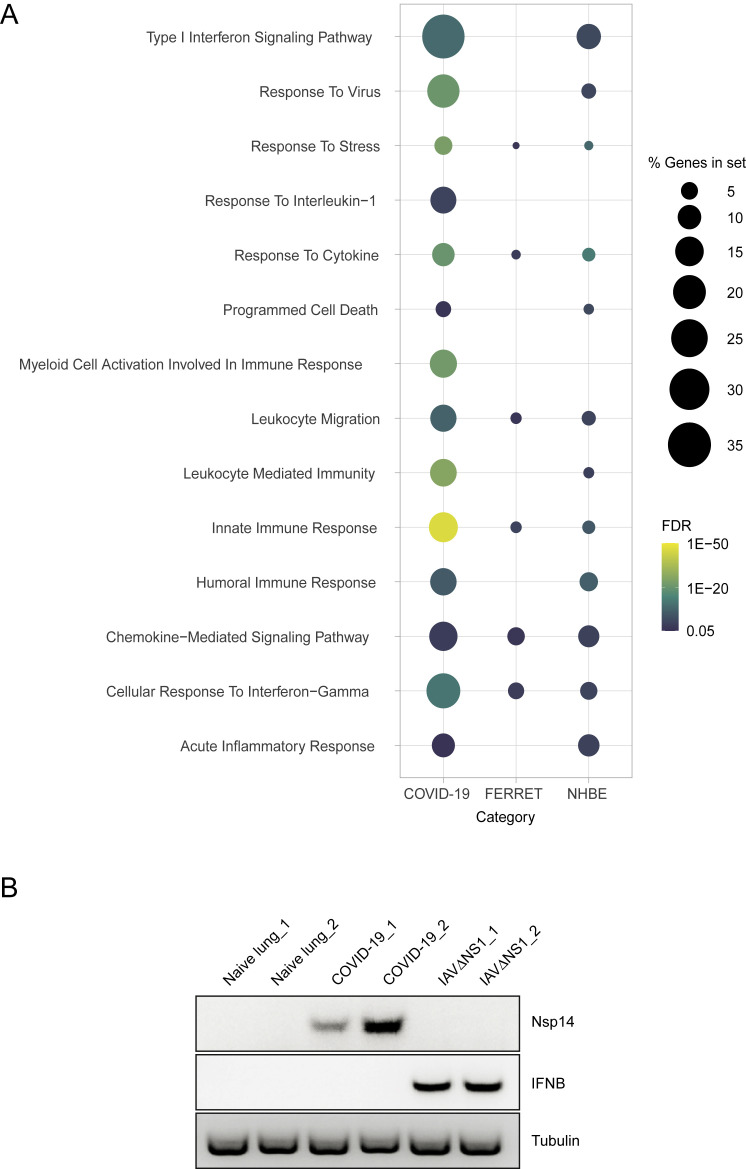
Viral pandemics, such as the one caused by SARS-CoV-2, pose an imminent threat to humanity. Because of its recent emergence, there is a paucity of information regarding viral behavior and host response following SARS-CoV-2 infection. Here we offer an in-depth analysis of the transcriptional response to SARS-CoV-2 compared with other respiratory viruses. Cell and animal models of SARS-CoV-2 infection, in addition to transcriptional and serum profiling of COVID-19 patients, consistently revealed a unique and inappropriate inflammatory response. This response is defined by low levels of type I and III interferons juxtaposed to elevated chemokines and high expression of IL-6. We propose that reduced innate antiviral defenses coupled with exuberant inflammatory cytokine production are the defining and driving features of COVID-19.

Keywords: COVID-19; Coronavirus; IL6; SARS-CoV-2; chemokines; ferret; interferon; transcriptomics; virus-host interactions.


Conflict of interest statement

Declaration of Interests The authors declare no competing interests.

Figures

None
Graphical abstract
Figure 1
Figure 1
Host Transcriptional Response to Respiratory Infection in Human Lung Epithelium-Derived Cell Lines (A) Virus replication levels in infected cells. RNA-seq was performed on poly(A)-enriched total RNA, and the percentage of virus-aligned reads (over total reads) is indicated for each sample. Error bars represent standard deviation from three independent biological replicates (except for IAV infection, where data are representative of independent biological duplicates). The cell types used for each infection is indicated (+) at the bottom of the figure. All infections were performed at a high MOI (MOI, 2–5), except for , which indicates an MOI of 0.2. (B) Read coverage along the SARS-CoV-2 genome for mCherry- or ACE2-expressing A549 cells. The graph indicates the number of viral reads per position of the virus genome in A549 cells transduced with adenovirus (AdV)-based vectors expressing mCherry (MOI, 0.2; light blue) or ACE2 (MOI 0.2, salmon (); MOI 2, dark red). A scaled model of the SARS-CoV-2 genome and its genes is depicted below (generated in BioRender). (C) Western blot analysis of mCherry- or ACE2-expressing A549 cells infected with SARS-CoV-2. Whole-cell lysates were analyzed by SDS-PAGE and blotted for ACE2, SARS-CoV-2 nucleocapsid (N), and actin. (D) qRT-PCR analysis of mCherry- or ACE2-expressing A549 cells infected with SARS-CoV-2 (MOI, 0.2). The graph depicts the relative amount of SARS-CoV-2 Envelope (E), non-structural protein 14 (nsp14), and human IFNB transcripts normalized to human α-tubulin. Error bars represent the standard deviation of the mean log2(fold change) of three independent biological replicates. (E) Principal-component analysis (PCA) for the global transcriptional response to respiratory viruses. Sparse PCA depicts global transcriptome profiles of the samples in (A). Cell types used for infection are represented by different shapes (circle, A549; square, A549-ACE; diamond, Calu-3; triangle, MRC5). (F) Heatmap depicting the expression levels of differentially expressed genes (DEGs) of the samples in (A) belonging to the indicated GO biological processes (GO: 0034097, GO: 0045087, GO: 0009615, GO: 0006954). The graph depicts the log2(fold change) of DEGs of infected compared with mock-treated cells. The included genes have a log2(fold change) of more than 2 and a p-adjusted value of less than 0.05. Data from SARS-CoV-1 and MERS-CoV infections correspond to GEO: GSE56192.
Figure S1
Figure S1
Role of IFN Response in Infection with SARS-CoV-2, Related to Figure 1 (A) Western blot analysis of WT or ACE2-expressing A549 cells mock-treated or infected with SARS-CoV-2 or Sendai virus. Whole cell lysates were analyzed by SDS-PAGE and blotted for SARS-CoV-2 spike, phospho-TBK1, MX1, STAT1 and actin. (B) qRT-PCR analysis of Vero E6 cells infected with SARS-CoV-2 and treated with IFNβ 2 h post infection as indicated. The graph depicts the relative amount of SARS-CoV-2 envelope (E) and non-structural protein 14 (nsp14) normalized to human α-Tubulin. Error bars represent the standard deviation of the mean fold change of three independent biological replicates. Statistical significance calculated by Student's t test corrected for multiple comparisons using Holm-Sidak method (∗∗∗) p value < 0.001. (C) Western blot analysis of conditions as in (B). Whole cell lysates were analyzed by SDS-PAGE and blotted for SARS-CoV-2 spike and GAPDH. (D) Western blot analysis of ACE2-expressing A549 cells infected with SARS-CoV-2 with or without Ruxolitinib. Whole cell lysates were analyzed by SDS-PAGE and blotted for SARS-CoV-2 spike and GAPDH. (E) Virus replication levels in SARS-CoV-2-infected A549-ACE2 cells treated with or without Ruxolitinib. RNA-seq was performed on polyA enriched total RNA and the percentage of virus-aligned reads (over total reads) is indicated for each sample. Error bars represent standard deviation from three independent biological replicates. Infections were preformed at high MOI (MOI: 2). (F-G) Expression levels of (F) ISGs or (G) cytokines and chemokines in conditions as in (E). Scatterplot of the log2(Fold Change) of individual genes in SARS-CoV-2-infected A549-ACE2 cells treated with or without Ruxolitinib. Linear regression line and confidence interval (95%) is shown as a red line and gray shaded area, respectively. Dotted diagonal represent no changes between conditions. (H). Heatmap depicting the expression levels of ISGs as in (F).
Figure 2
Figure 2
Host Transcriptional Response to IAV and SARS-CoV-2 in Primary Human Bronchial Epithelial Cells (A) Shared DEGs in IFNβ-treated, SARS-CoV-2- or IAV-infected NHBE cells. The Venn diagram depicts genes shared and/or unique between each comparison. (B) Sparse PCA depicting global transcriptional profiles of the samples in (A). (C) Dotplot visualization of enriched GO terms in NHBE cells. Gene enrichment analyses were performed using STRING against the GO dataset for biological processes. The color of the dots represents the false discovery rate (FDR) value for each enriched GO term, and size represents the percentage of genes enriched in the total gene set. (D) Heatmap indicating the expression levels of DEGs involved in IFN-I responses. (E) Heatmap as in (D) for genes belonging to GO annotations for cytokine activity and chemokine activity (GO: 0005125, GO: 0008009). The graphs depict the log2(fold change) of DEGs of infected compared with mock-treated cells. Genes included have a log2(fold change) of more than 1 and a p-adjusted value of less than 0.05.
Figure S2
Figure S2
Infectivity and Host Response to SARS-CoV-2 Infection in NHBE Cells, Related to Figure 2 (A) Virus replication levels in infected cells. RNA-seq was performed on polyA enriched total RNA and the percentage of virus-aligned reads (over total reads) is indicated for each sample. Error bars represent standard deviation from four independent biological replicates (except for SARS-CoV-2 infection where data are representative of independent biological triplicates). (B) Heatmap depicting the expression levels of Interferon transcripts in the indicated conditions. Colors representing transcripts per million (TPMs) in RNA-seq experiments.
Figure 3
Figure 3
Longitudinal Analysis of the Host Response to SARS-CoV-2 in Ferrets (A) Read coverage along the SARS-CoV-2 genome. The graph indicates the number of viral reads per each position of the virus genome identified in RNA extracted from nasal washes of ferrets 1 (gray), 3 (red), 7 (blue), and 14 (green) days after infection (ND, not detected). (B) Volcano plots indicating DEGs of ferrets along the course of a SARS-CoV-2 infection as in (A). DEGs (p-adjusted < 0.05) with a |log2(fold change)| of more than 2 are indicated in red. Non-significant DEGs with a |log2(fold change)| of more than 2 are indicated in green. (C) Heatmap depicting the expression levels of a subset of cytokines differentially expressed in nasal washes collected from ferrets infected with the indicated viruses at specific times. (D) Heatmap depicting the expression levels of lymphoblast-related genes differentially expressed in trachea samples collected from ferrets infected with the indicated viruses after 3 days. The graphs show the log2(fold change) of DEGs of infected compared with mock-infected animals. Genes included have a log2(fold change) of more than 2 and a p-adjusted value of less than 0.05. Ferrets were randomly assigned to the different treatment groups (naive, n = 2; SARS-CoV-2 infection, n = 6; IAV [pH1N1] infection, n = 2; IAV [H3N2] infection, n = 2).
Figure S3
Figure S3
Transcriptional Response to SARS-CoV-2 and IAV in Ferrets, Related to Figure 3 (A) Read coverage along the IAV genome. Graph indicates the number of viral reads per each position of the IAV virus genome identified in RNA extracted from nasal washes of ferrets at 7 days post infection. Scaled model of the concatenated IAV segments is depicted below. (B) Volcano plots indicating differentially expressed genes of ferrets infected with SARS-CoV-2 or IAV for 7 days. Differentially expressed genes (p-adjusted value < 0.05) with a |Log2(Fold Change)| > 2 are indicated in red. Non-significant differentially expressed Genes with a |Log2(Fold Change)| > 2 are indicated in green. (C) Cellular profiling from a subset of genes selectively enriched in response to SARS-CoV-2 compared to IAV, as determined by the Immunological Genome Project.
Figure 4
Figure 4
Transcriptional and Serological Profile of Clinical COVID-19 Patients (A) Volcano plot depicting DEGs in post-mortem lung samples of two COVID-19 patients compared with healthy lung biopsies. DEGs (p-adjusted < 0.05) with a |log2(fold change)| of more than 2 are indicated in red. Non-significant DEGs with a |log2(fold change)| of more than 2 are indicated in green. (B and C) Cytokine profiles of COVID-19 patients. Sera of 24 COVID-19 patients and 24 SARS-CoV-2-negative controls were analyzed by ELISA for the protein levels of (B) IFN-I and IFN-III or (C) a broad panel of cytokines. The dotted line depicts the limit of detection. Statistical significance was calculated by Mann-Whitney non-parametric t test. NS, non-significant; p < 0.05, ∗∗p < 0.005, ∗∗∗p < 0.0001.
Figure S4
Figure S4
Unique and Shared Biological Processes between Different Models of SARS-CoV-2 Infection, Related to Figure 4 (A) Dotplot visualization of enriched GO terms in NHBE cells, ferrets and COVID-19 patients. Gene enrichment analyses were performed using STRING against the GO dataset for biological processes. The color of the dots represents the false discovery rate (FDR) value for each enriched GO term and its size represents the percentage of genes enriched in the total gene set. (B) Semiquantitative PCR analysis of healthy and COVID-19 derived lung tissues. Image indicates the relative expression of SARS-CoV-2 nsp14, IFNB and tubulin transcripts in healthy human biopsies and biological replicates of lung tissue from COVID-19 patients. Additionally cDNA of A549 cells infected with IAVΔNS1 are included as controls.

Similar articles

Cited by

References

    1. Amanat F., Krammer F. SARS-CoV-2 Vaccines: Status Report. Immunity. 2020;52:583–589. - PMC - PubMed
    1. Blanco-Melo D., Nilsson-Payant B.E., Uhl S., Escudero-Pèrez B., Olschewski S., Thibault P., Panis M., Rosenthal M., Muñoz-Fontela C., Lee B. An inability to maintain the ribonucleoprotein genomic structure is responsible for host detection of negative-sense RNA viruses. bioRxiv. 2020 doi: 10.1101/2020.2003.2012.989319. - DOI
    1. Channappanavar R., Fehr A.R., Vijay R., Mack M., Zhao J., Meyerholz D.K., Perlman S. Dysregulated Type I Interferon and Inflammatory Monocyte-Macrophage Responses Cause Lethal Pneumonia in SARS-CoV-Infected Mice. Cell Host Microbe. 2016;19:181–193. - PMC - PubMed
    1. Chen N., Zhou M., Dong X., Qu J., Gong F., Han Y., Qiu Y., Wang J., Liu Y., Wei Y. Epidemiological and clinical characteristics of 99 cases of 2019 novel coronavirus pneumonia in Wuhan, China: a descriptive study. Lancet. 2020;395:507–513. - PMC - PubMed
    1. Chu D.K.W., Pan Y., Cheng S.M.S., Hui K.P.Y., Krishnan P., Liu Y., Ng D.Y.M., Wan C.K.C., Yang P., Wang Q. Molecular Diagnosis of a Novel Coronavirus (2019-nCoV) Causing an Outbreak of Pneumonia. Clin. Chem. 2020;66:549–555. - PMC - PubMed

Publication types

MeSH terms