. 2020 Jun 2;118(11):2741-2754.
doi: 10.1016/j.bpj.2020.04.022. Epub 2020 Apr 29.

Multiscale Coarse-Grained Approach to Investigate Self-Association of Antibodies

Affiliations

Multiscale Coarse-Grained Approach to Investigate Self-Association of Antibodies

Saeed Izadi et al. Biophys J. .

Abstract

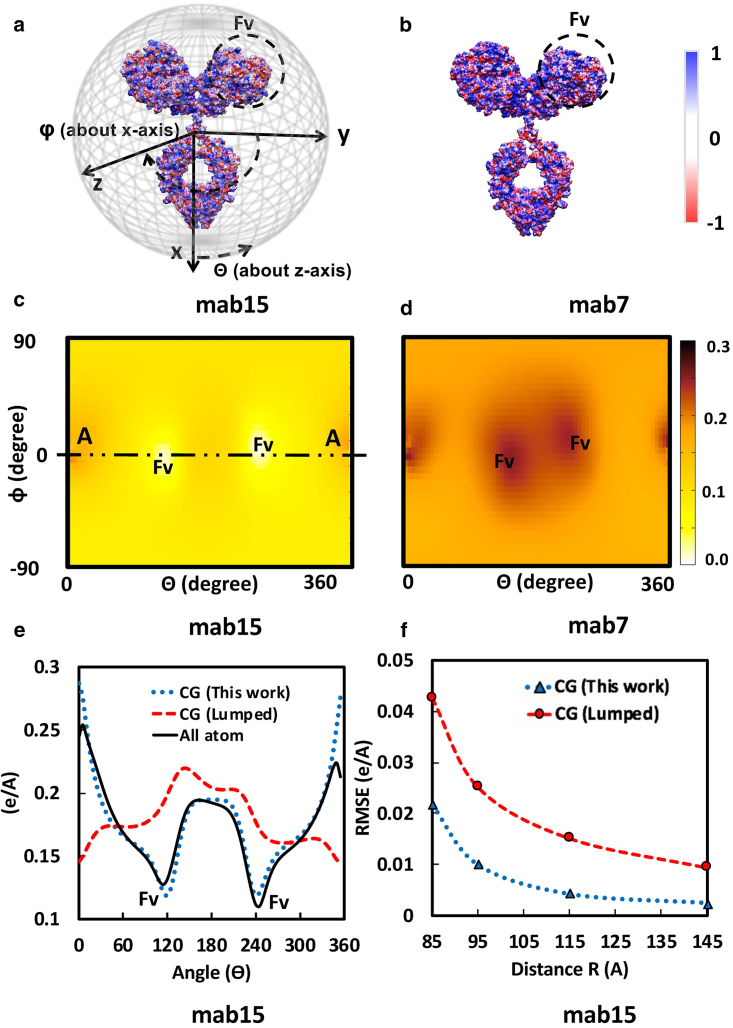
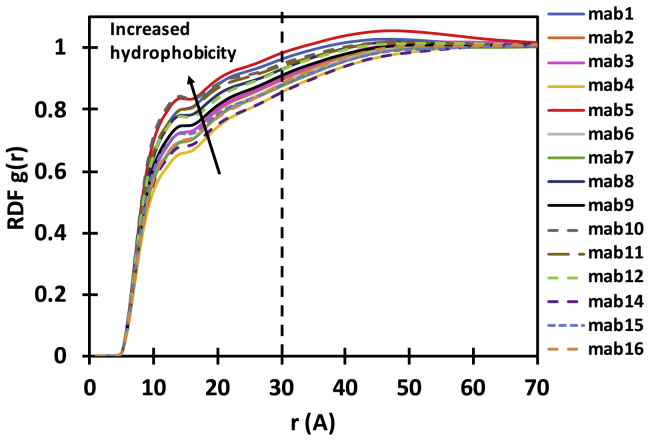
Self-association of therapeutic monoclonal antibodies (mabs) are thought to modulate the undesirably high viscosity observed in their concentrated solutions. Computational prediction of such a self-association behavior is advantageous early during mab drug candidate selection when material availability is limited. Here, we present a coarse-grained (CG) simulation method that enables microsecond molecular dynamics simulations of full-length antibodies at high concentrations. The proposed approach differs from others in two ways: first, charges are assigned to CG beads in an effort to reproduce molecular multipole moments and charge asymmetry of full-length antibodies instead of only localized charges. This leads to great improvements in the agreement between CG and all-atom electrostatic fields. Second, the distinctive hydrophobic character of each antibody is incorporated through empirical adjustments to the short-range van der Waals terms dictated by cosolvent all-atom molecular dynamics simulations of antibody variable regions. CG simulations performed on a set of 15 different mabs reveal that diffusion coefficients in crowded environments are markedly impacted by intermolecular interactions. Diffusion coefficients computed from the simulations are in correlation with experimentally measured observables, including viscosities at a high concentration. Further, we show that the evaluation of electrostatic and hydrophobic characters of the mabs is useful in predicting the nonuniform effect of salt on the viscosity of mab solutions. This CG modeling approach is particularly applicable as a material-free screening tool for selecting antibody candidates with desirable viscosity properties.


Figures

Figure 1
Figure 1
CG representation of the IgG1 mab structure. (a) The molecular multipole moments up to the octupole order of the full-length mab are calculated. (b) The charges on CG sites are assigned so that these multipole moments are accurately reproduced. (c) All-atom MD simulations of the Fv region that were solvated in a mixed solution of explicit water molecules and a hydrophobic tracer molecule (trimethylamine) are performed to determine the hydrophobicity characters of the Fv. (d) The LJ parameters are adjusted based on the hydrophobic characters of Fv and the size of each representative CG domain.
Figure 3
Figure 3
(a and b) The electrostatic surface potential for mab15 and mab7 (pH 6.0) and 15 mM solution ionic strength, generated using APBS and VMD (38). The red and blue contours indicate −1 and +1 KT/e electrostatic surface potentials, respectively. (c and d) Shown is the calculated electrostatic potential on a circumscribed sphere with radius 100 Å centered at the center of the mass of mab15 and mab7. The heatmap shows the electrostatic potential at each point on the sphere represented by polar angles (θ and ϕ). (e) Shown is the electrostatic potential field along the A-A line produced by the proposed CG charge placement (this work), the commonly used “lumped” charge placement, and the reference all-atom representation. (f) Root mean-square error in electrostatic potential due to the proposed CG charge placement (this work) and the “lumped” charge placement relative to the reference all-atom representation at different distances are given. The electrostatic potential at a given distance is calculated on the surface of a sphere with the corresponding radius surrounding the mab.
Figure 2
Figure 2
The radial distribution function (RDF) of tracer molecules relative to the atoms in Fv region determined for different mabs. The RDF profile describes how the probability of finding a molecule differs with respect to the distance to the Fv molecular surface.
Figure 4
Figure 4
(a and b) Correlation and bar plots comparing calculated self-diffusion (D/D0) and measured kD. The D-values are averages over the three independent CG simulation runs at 60 mg/mL. D0 is the single antibody diffusivity in free space; an average value of 4 × 10−7 cm2/s has been reported (10). kD and their SDs of the mean are from (10). (c and d) Given are correlation and bar plots comparing the calculated self-diffusion (D/D0) and measured solution viscosity (η). The D-values are averages over the three independent CG simulation runs at 160 mg/mL. The error bars show the SD from the mean. The viscosities, measured at 175 mg/mL (±5%) by cone and plate rheometry, are taken from (10). The empty circles and patterned columns represent the outlier.
Figure 5
Figure 5
(a) RDF of mab7 and mab15 calculated from the CG simulations at 160 mg/mL. (b and c) Shown are the equilibrated systems of mab7 and mab15 after 5 μs. The strong electrostatic and hydrophobic complementarities between CG domains in mab15 promote reversible intermolecular interactions, leading to the formation of large mab clusters. In contrast, mab7 exists more in the form of monomers because of its high molecular net charge that results in strong electrostatic repulsion. The figures were generated using VMD (38).
Figure 6
Figure 6
(a) Experimentally measured concentration-dependent viscosity profile for mab15, mab5, and mab7. The lines are used as a guide to the eye and were generated using an exponential fit. (b) The computed inverse translational self-diffusion coefficients (1/D) are shown for mab15, mab5, and mab7 at six simulated concentrations. The diffusion coefficients are provided in units of Å2/ps, which is equivalent to the diffusion coefficients given at 10−5 cm2/s. The lines are used as a guide to the eye and were generated using a polynomial fit. To see this figure in color, go online.
Figure 7
Figure 7
(a) Electrostatic potential for mab15, mab5, and mab7 as a function of angle θ at ϕ = 0 on a circumscribed sphere with radius 100 Å, corresponding to A-A line in Fig. 3. Both mab7 and mab5 show very similar electrostatic potential, whereas mab15 has a significantly different potential. (b) Shown is the RDF of the hydrophobic tracer molecule around the Fv region of mab15, mab7, and mab5 obtained from cosolvent MD. Shown is that mab5 is more hydrophobic than mab7 and mab15. To see this figure in color, go online.
Figure 8
Figure 8
Change in experimental viscosities due to the change in ionic strength predicted from net charge and hydrophobicity. (a) The x axis and y axis represent the calculated monopole moment and the hydrophobicity scale (HFv), respectively. The circle radii correspond to experimentally measured viscosities at a 175 mg/mL concentration in low-salt (20 mM His-acetate (pH 5.5); solid circle) and high-salt (200 mM arginine-Cl (pH 5.0); dashed circle shaded gray) buffer solutions. (b) shows the product of x and y axes from (a) plotted against the percentage change in the viscosity observed upon salt addition.

Similar articles

Cited by

References

    1. Carter P.J. Potent antibody therapeutics by design. Nat. Rev. Immunol. 2006;6:343–357. - PubMed
    1. Lobo E.D., Hansen R.J., Balthasar J.P. Antibody pharmacokinetics and pharmacodynamics. J. Pharm. Sci. 2004;93:2645–2668. - PubMed
    1. Reichert J.M. Which are the antibodies to watch in 2013? MAbs. 2013;5:1–4. - PMC - PubMed
    1. Reichert J.M. Antibodies to watch in 2016. MAbs. 2016;8:197–204. - PMC - PubMed
    1. Yadav S., Shire S.J., Kalonia D.S. Factors affecting the viscosity in high concentration solutions of different monoclonal antibodies. J. Pharm. Sci. 2010;99:4812–4829. - PubMed

Publication types

Substances

LinkOut - more resources