. 2020 Oct 1;222(9):1550-1560.
doi: 10.1093/infdis/jiaa257.

Enhanced Human Immunodeficiency Virus-1 Replication in CD4+ T Cells Derived From Individuals With Latent Mycobacterium tuberculosis Infection

Affiliations

Enhanced Human Immunodeficiency Virus-1 Replication in CD4+ T Cells Derived From Individuals With Latent Mycobacterium tuberculosis Infection

Xianbao He et al. J Infect Dis. .

Abstract

Background: Mycobacterium tuberculosis (Mtb) and human immunodeficiency virus (HIV) coinfection increases mortality, accelerates progression to acquired immune deficiency syndrome, and exacerbates tuberculosis disease. However, the impact of pre-existing Mtb infection on subsequent HIV infection has not been fully explored. We hypothesized that Mtb infection creates an immunological environment that influences the course of HIV infection, and we investigated whether pre-existing Mtb infection impacts the susceptibility of CD4+ T cells to HIV-1 infection.

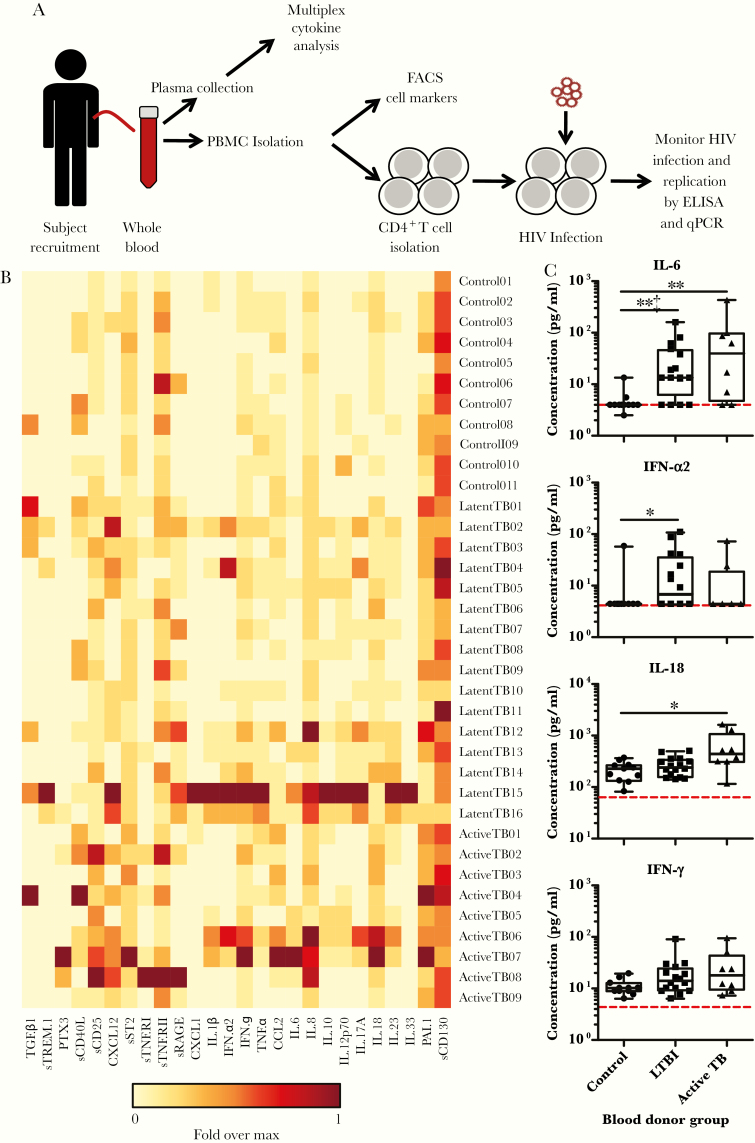
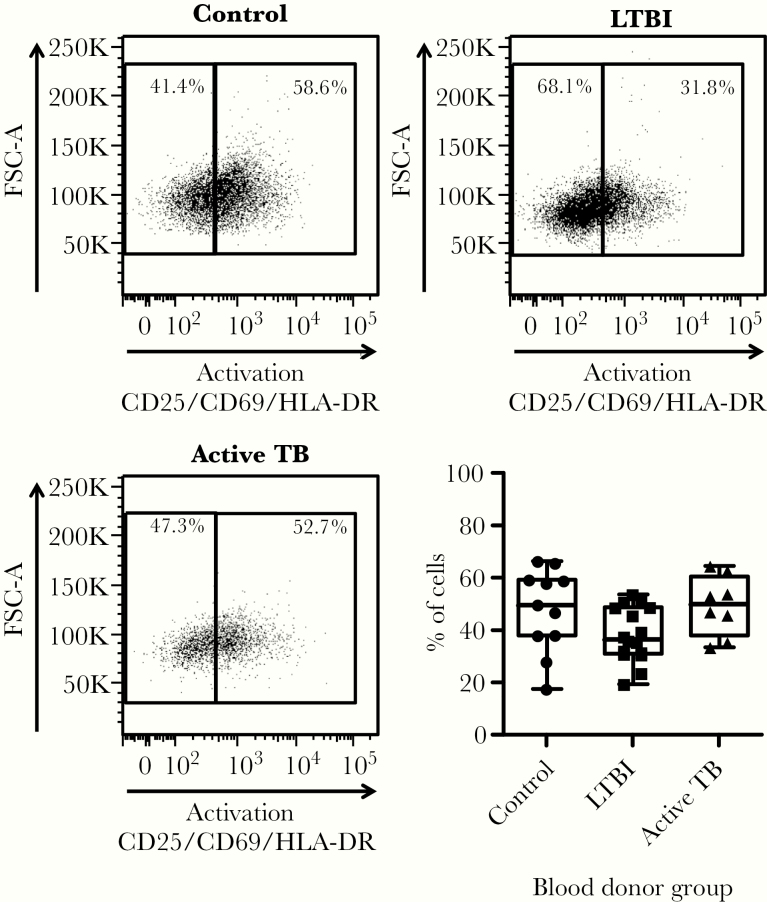
Methods: Plasma and blood CD4+ T cells isolated from HIV-negative individuals across the Mtb infection spectrum and non-Mtb-infected control individuals were analyzed for inflammation markers and T-cell phenotypes. CD4+ T cells were infected with HIV-1 in vitro and were monitored for viral replication.

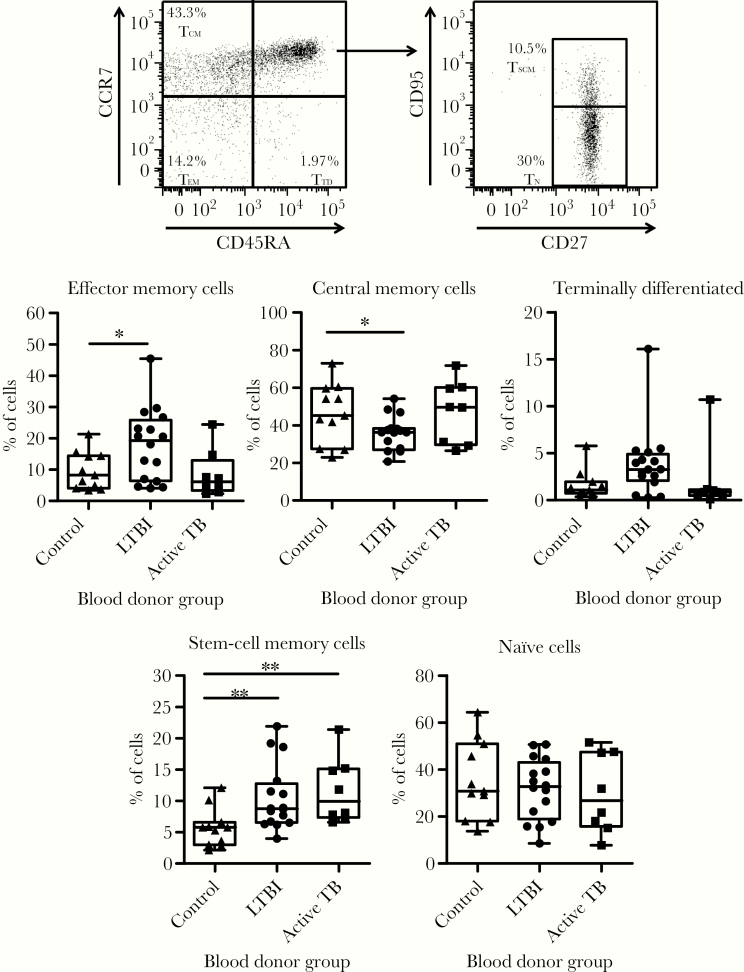
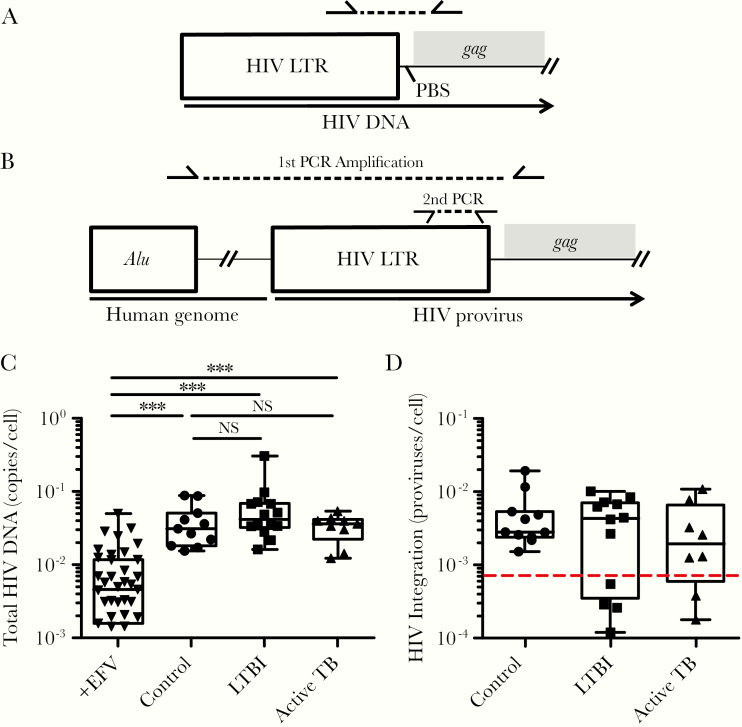
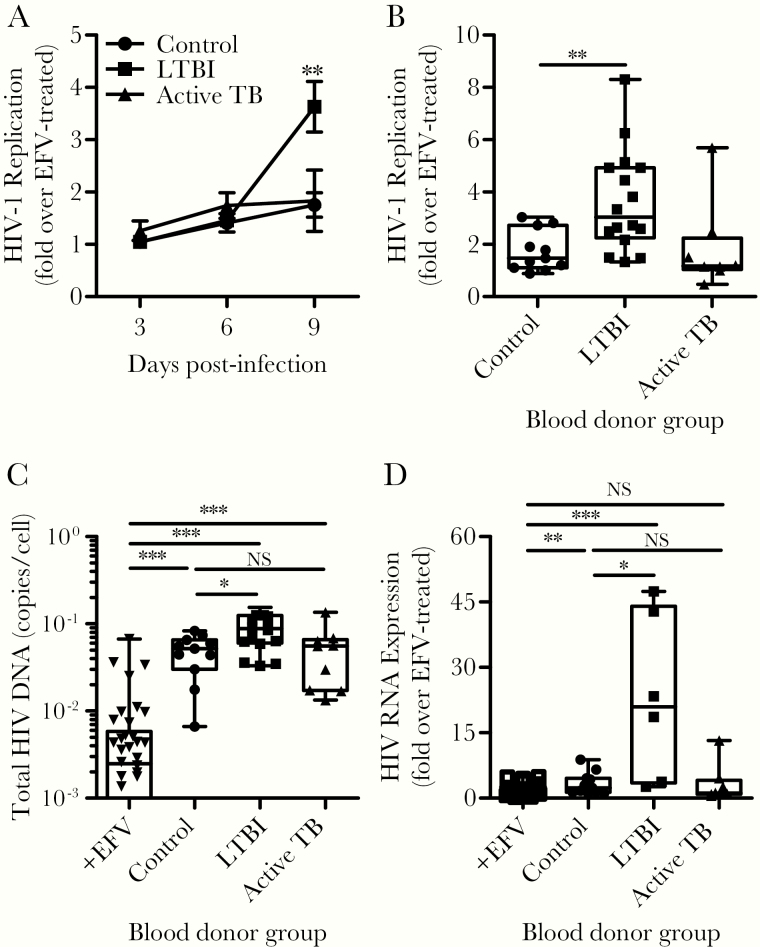
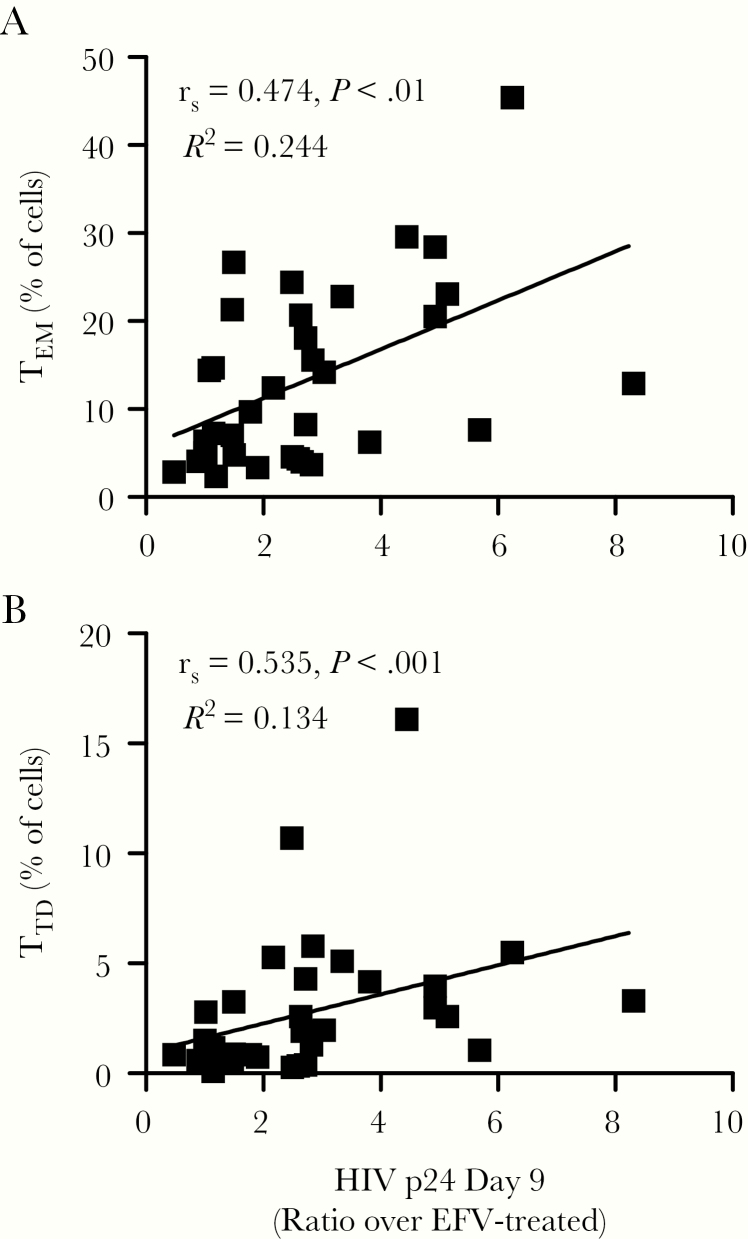
Results: We observed differences in proinflammatory cytokines and the relative proportion of memory T-cell subsets depending on Mtb infection status. CD4+ T cells derived from individuals with latent Mtb infection supported more efficient HIV-1 transcription, release, and replication. Enhanced HIV-1 replication correlated with higher percentages of CD4+ TEM and TTD cells.

Conclusions: Pre-existing Mtb infection creates an immunological environment that reflects Mtb infection status and influences the susceptibility of CD4+ T cells to HIV-1 replication. These findings provide cellular and molecular insights into how pre-existing Mtb infection influences HIV-1 pathogenesis.

Keywords: CD4 T cells; HIV replication; TB immune responses; TB-HIV coinfection; latent tuberculosis infection (LTBI).


Figures

Figure 1.
Figure 1.
Mycobacterium tuberculosis infection leaves an immunological footprint detected by elevated levels of inflammation-associated analytes in plasma and that is dependent on the infection status. (A) Experimental outline. Whole blood was collected from volunteers representing the subject groups shown in Table 1. A portion of blood was kept separate for harvesting plasma to be used for multiplex cytokine analysis and for supplementing the culture media to be used for CD4+ T cells. The rest of the blood was used for isolating peripheral blood mononuclear cells (PBMC) for flow cytometry analysis and for isolating CD4+ T cells for human immunodeficiency virus (HIV)-1 infection experiments. Human immunodeficiency virus-1 infection was monitored by enzyme-linked immunosorbent assay (ELISA) of HIV-1 antigen (p24), quantitative polymerase chain reaction (qPCR) analysis of HIV-1 deoxyribonucleic acid, and qPCR analysis of HIV-1 ribonucleic acid. (B) Plasma analyte concentrations were measured by multiplex analysis and are displayed as a heatmap for each blood donor. Heatmap shows the amount of each analyte per blood donor, relative to the maximum signal for set analyte. (C) Plots of representative analytes indicating data range, median, and interquartile range. Each point represents individual donors. Dotted red line indicates the limit of detection. P values were calculated based on the Mann-Whitney U test: *, P < .05 and **, P < .01. ‡ denotes P < .0019 after Bonferroni correction. The full data set of analytes is included as Supplementary Table and Supplementary Figure 1A–C. FACS, fluorescence-activated cell sorting; IFN, interferon; IL, interleukin; LTBI, latent tuberculosis infection; TB, tuberculosis.
Figure 2.
Figure 2.
Mycobacterium tuberculosis infection does not affect the overall proportion of activated CD4+ T cells in the blood. Peripheral blood mononuclear cells from study subjects were stained for flow cytometry analysis to determine the proportion of CD4+ T cells expressing any of the molecules associated with T-cell activation: CD25, CD69, and/or HLA-DR. This combination of markers captures both early and late T-cell activation states. Representative fluorescence-activated cell sorting plots for each subject group and a plot of all donors are shown. Plots indicate data range, median, and interquartile range. P values were calculated based on the Mann-Whitney U test. FSC, forward scatter; LTBI, latent tuberculosis infection; TB, tuberculosis.
Figure 3.
Figure 3.
Mycobacterium tuberculosis infection leaves an immunological footprint detected by changes in the relative proportion of CD4+ T-cell memory subsets. Peripheral blood mononuclear cells from study subjects were stained for flow cytometry analysis to determine the proportion of CD4+ T-cell subsets based on the expression of molecules associated with memory phenotypes. A representative dot plot is shown with the gating strategy and the CD4+ T-cell subsets represented by each gate: effector memory (TEM), central memory (TCM), and terminally differentiated (TTD). CCR7+/CD45RA+ cells were further subdivided into true naive cells (TN) and stem cell memory T cells (TSCM) based on the expression of CD27 and CD95. Percentages shown for each gate indicate their proportion relative to the total CD4+ T-cell population. Plots represent the proportion of each CD4+ T-cell subset for all donors and show the data range, median, and interquartile range. P values were calculated based on the Mann-Whitney U test: *, P < .05 and **, P < .01. LTBI, latent tuberculosis infection; TB, tuberculosis.
Figure 4.
Figure 4.
Pre-existing Mycobacterium tuberculosis infection does not affect the susceptibility of CD4+ T cells to human immunodeficiency virus (HIV)-1 infection. CD4+ T cells from the different subject groups were infected with HIV-1, and infection was restricted to a single round of infection with the antiretroviral drug saquinavir (1 μM). A portion of the infected cells were treated with the antiretroviral drug efavirenz (1 μM) to serve as a negative control for HIV-1 infection. Total cellular deoxyribonucleic acid (DNA) was harvested and analyzed for total and integrated HIV-1 by quantitative polymerase chain reaction (PCR) following the strategy shown in A and B. Levels of total and integrated HIV-1 DNA for each blood donor are shown in C and D respectively. Data are displayed as the number of copies per cell. The data range, median, and interquartile range are shown. The dotted red line in D indicates the limit of detection of the assay. P values were calculated based on the Mann-Whitney U test: ***, P < .001 and NS, P > .05. EFV, efavirenz; LTBI, latent tuberculosis infection; LTR, long terminal repeat; NS, not significant; PBS, primer binding site; TB, tuberculosis.
Figure 5.
Figure 5.
The stage of pre-existing Mycobacterium tuberculosis infection affects human immunodeficiency virus (HIV)-1 replication. CD4+ T cells from the different subject groups were infected with HIV-1, and infection was (A–C) allowed to expand or (D) restricted to a single round of infection with the antiretroviral drug saquinavir (1 μM). A portion of the infected cells were treated with the antiretroviral drug efavirenz ([EFV] 1 μM) to serve as a negative control for HIV-1 infection. (A) The HIV-1 replication was monitored by the release of HIV-1 antigen (p24) into the culture medium over the span of 9 days. Data are shown as the ratio of HIV-1 p24 signal as determined by enzyme-linked immunosorbent assay, over the signal from parallel cultures treated with EFV. Asterisks represent the statistical significance of the signal from latent tuberculosis infection (LTBI) subjects compared to the other groups on day 9. (B) Dot plot showing the distribution of HIV-1 p24 signal detected on day 9 for each blood donor group. (C) On day 9, cells were harvested and cellular deoxyribonucleic acid (DNA) was purified for quantitative polymerase chain reaction (qPCR) analysis of HIV-1 DNA. Data are displayed as copies of HIV-1 DNA per cell. (D) Cultures of cells treated with saquinavir were harvested on day 4 postinfection, and cellular ribonucleic acid (RNA) was purified for qPCR analysis of HIV-1 RNA to measure the level of proviral gene transcription. Note that RNA was available for only 6 of the donors with LTBI. Data are shown as the fold increase in signal relative to parallel cultures treated with EFV for each blood donor. Plots indicate the data range, median, and interquartile range. P values were calculated based on the Mann-Whitney U test: *, P < .05, **, P < .01, ***, P < .001, and NS P > .05. NS, not significant; TB, tuberculosis.
Figure 6.
Figure 6.
Higher human immunodeficiency virus (HIV)-1 replication correlates with higher percentages of TEM and TTD CD4+ T cells. We calculated one-on-one correlations between the level of HIV-1 replication on day 9 postinfection and the percentage of (A) effector memory (TEM) and (B) terminally differentiated (TTD) CD4+ T cells using Spearman’s rank correlation. Dot plots show the correlation coefficient (rs), P value from the Spearman’s correlation, and the R2 value of the best-fitting line based on linear regression. Each data point represents individual donors. Additional correlations versus plasma analytes and versus the proportion of other CD4+ T-cell subsets are included in Supplementary Figure 2A−C.

References

    1. World Health Organization. Global Tuberculosis Report 2019. Geneva: World Health Organization; 2019.
    1. Joint United Nations Programme on HIV and AIDS (UNAIDS). UNAIDS Data 2019. Geneva, Switzerland: UNAIDS; 2019:16–9. Available at: https://www.unaids.org/sites/default/files/media_asset/2019-UNAIDS-data_... . Accessed 07 November 2019.
    1. Kwan CK, Ernst JD. HIV and tuberculosis: a deadly human syndemic. Clin Microbiol Rev 2011; 24:351–76. - PMC - PubMed
    1. World Health Organization. Global Tuberculosis Control: Epidemiology, Strategy, Financing: WHO Report 2009. Geneva: World Health Organization; 2009.
    1. Whalen C, Horsburgh CR, Hom D, Lahart C, Simberkoff M, Ellner J. Accelerated course of human immunodeficiency virus infection after tuberculosis. Am J Respir Crit Care Med 1995; 151:129–35. - PubMed

Publication types

MeSH terms