Evaluation of the relationship between slow-waves of intracranial pressure, mean arterial pressure and brain tissue oxygen in TBI: a CENTER-TBI exploratory analysis
- PMID: 32418148
- PMCID: PMC8286934
- DOI: 10.1007/s10877-020-00527-6
Evaluation of the relationship between slow-waves of intracranial pressure, mean arterial pressure and brain tissue oxygen in TBI: a CENTER-TBI exploratory analysis
Abstract
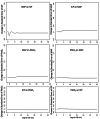
Brain tissue oxygen (PbtO2) monitoring in traumatic brain injury (TBI) has demonstrated strong associations with global outcome. Additionally, PbtO2 signals have been used to derive indices thought to be associated with cerebrovascular reactivity in TBI. However, their true relationship to slow-wave vasogenic fluctuations associated with cerebral autoregulation remains unclear. The goal of this study was to investigate the relationship between slow-wave fluctuations of intracranial pressure (ICP), mean arterial pressure (MAP) and PbtO2 over time. Using the Collaborative European NeuroTrauma Effectiveness Research in Traumatic Brain Injury (CENTER-TBI) high resolution ICU sub-study cohort, we evaluated those patients with recorded high-frequency digital intra-parenchymal ICP and PbtO2 monitoring data of a minimum of 6 h in duration. Digital physiologic signals were processed for ICP, MAP, and PbtO2 slow-waves using a moving average filter to decimate the high-frequency signal. The first 5 days of recording were analyzed. The relationship between ICP, MAP and PbtO2 slow-waves over time were assessed using autoregressive integrative moving average (ARIMA) and vector autoregressive integrative moving average (VARIMA) modelling, as well as Granger causality testing. A total of 47 patients were included. The ARIMA structure of ICP and MAP were similar in time, where PbtO2 displayed different optimal structure. VARIMA modelling and IRF plots confirmed the strong directional relationship between MAP and ICP, demonstrating an ICP response to MAP impulse. PbtO2 slow-waves, however, failed to demonstrate a definite response to ICP and MAP slow-wave impulses. These results raise questions as to the utility of PbtO2 in the derivation of cerebrovascular reactivity measures in TBI. There is a reproducible relationship between slow-wave fluctuations of ICP and MAP, as demonstrated across various time-series analytic techniques. PbtO2 does not appear to reliably respond in time to slow-wave fluctuations in MAP, as demonstrated on various VARIMA models across all patients. These findings suggest that PbtO2 should not be utilized in the derivation of cerebrovascular reactivity metrics in TBI, as it does not appear to be responsive to changes in MAP in the slow-waves. These findings corroborate previous results regarding PbtO2 based cerebrovascular reactivity indices.
Keywords: Autoregulation; Brain tissue oxygen; Cerebrovascular reactivity; TBI; Traumatic brain injury.
© 2020. The Author(s).
Conflict of interest statement
PS and MC receive part of licensing fees for the software ICM + (Cambridge Enterprise Ltd, UK) used for data collection and analysis in this study. MC has consultancy agreement with Integra, PS has consultancy agreements with Integra Life Sciences and Pressura Neuro Ltd.
Figures


Similar articles
-
Brain Tissue Oxygen and Cerebrovascular Reactivity in Traumatic Brain Injury: A Collaborative European NeuroTrauma Effectiveness Research in Traumatic Brain Injury Exploratory Analysis of Insult Burden.J Neurotrauma. 2020 Sep 1;37(17):1854-1863. doi: 10.1089/neu.2020.7024. Epub 2020 May 4. J Neurotrauma. 2020. PMID: 32253987 Free PMC article.
-
Statistical Cerebrovascular Reactivity Signal Properties after Secondary Decompressive Craniectomy in Traumatic Brain Injury: A CENTER-TBI Pilot Analysis.J Neurotrauma. 2020 Jun 1;37(11):1306-1314. doi: 10.1089/neu.2019.6726. Epub 2020 Feb 25. J Neurotrauma. 2020. PMID: 31950876 Free PMC article.
-
Comparison of high versus low frequency cerebral physiology for cerebrovascular reactivity assessment in traumatic brain injury: a multi-center pilot study.J Clin Monit Comput. 2020 Oct;34(5):971-994. doi: 10.1007/s10877-019-00392-y. Epub 2019 Oct 1. J Clin Monit Comput. 2020. PMID: 31573056 Free PMC article.
-
Alternative continuous intracranial pressure-derived cerebrovascular reactivity metrics in traumatic brain injury: a scoping overview.Acta Neurochir (Wien). 2020 Jul;162(7):1647-1662. doi: 10.1007/s00701-020-04378-7. Epub 2020 May 8. Acta Neurochir (Wien). 2020. PMID: 32385635 Review.
-
Pressure Autoregulation Measurement Techniques in Adult Traumatic Brain Injury, Part II: A Scoping Review of Continuous Methods.J Neurotrauma. 2017 Dec 1;34(23):3224-3237. doi: 10.1089/neu.2017.5086. Epub 2017 Sep 26. J Neurotrauma. 2017. PMID: 28699412
Cited by
-
Multimodal and autoregulation monitoring in the neurointensive care unit.Front Neurol. 2023 Apr 20;14:1155986. doi: 10.3389/fneur.2023.1155986. eCollection 2023. Front Neurol. 2023. PMID: 37153655 Free PMC article. Review.
-
Temporal relationship between vasopressor and sedative administration and cerebrovascular response in traumatic brain injury: a time-series analysis.Intensive Care Med Exp. 2023 May 29;11(1):30. doi: 10.1186/s40635-023-00515-5. Intensive Care Med Exp. 2023. PMID: 37246179 Free PMC article.
-
Descriptive analysis of low versus elevated intracranial pressure on cerebral physiology in adult traumatic brain injury: a CENTER-TBI exploratory study.Acta Neurochir (Wien). 2020 Nov;162(11):2695-2706. doi: 10.1007/s00701-020-04485-5. Epub 2020 Sep 4. Acta Neurochir (Wien). 2020. PMID: 32886226 Free PMC article.
-
Dynamic Temporal Relationship Between Autonomic Function and Cerebrovascular Reactivity in Moderate/Severe Traumatic Brain Injury.Front Netw Physiol. 2022 Feb 16;2:837860. doi: 10.3389/fnetp.2022.837860. eCollection 2022. Front Netw Physiol. 2022. PMID: 36926091 Free PMC article.
-
Cerebrovascular Reactivity Is Not Associated With Therapeutic Intensity in Adult Traumatic Brain Injury: A Validation Study.Neurotrauma Rep. 2023 May 12;4(1):307-317. doi: 10.1089/neur.2023.0011. eCollection 2023. Neurotrauma Rep. 2023. PMID: 37187506 Free PMC article.
References
-
- Le Roux P, Menon DK, Citerio G, Vespa P, Bader MK, Brophy G, et al. The International Multidisciplinary Consensus Conference on Multimodality Monitoring in Neurocritical Care: evidentiary tables: a statement for healthcare professionals from the Neurocritical Care Society and the European Society of Intensive Care Medicine. Neurocrit Care. 2014;21(Suppl 2):S297–361. doi: 10.1007/s12028-014-0081-x. - DOI - PMC - PubMed
-
- Hawryluk GWJ, Phan N, Ferguson AR, Morabito D, Derugin N, Stewart CL, et al. Brain tissue oxygen tension and its response to physiological manipulations: influence of distance from injury site in a swine model of traumatic brain injury. J Neurosurg. 2016;125:1217–1228. doi: 10.3171/2015.7.JNS15809. - DOI - PubMed

