. 2020 Sep 15;88(6):488-499.
doi: 10.1016/j.biopsych.2020.03.011. Epub 2020 Mar 31.

MEF2C Hypofunction in Neuronal and Neuroimmune Populations Produces MEF2C Haploinsufficiency Syndrome-like Behaviors in Mice

Affiliations

MEF2C Hypofunction in Neuronal and Neuroimmune Populations Produces MEF2C Haploinsufficiency Syndrome-like Behaviors in Mice

Adam J Harrington et al. Biol Psychiatry. .

Erratum in

  • Erratum.
    [No authors listed] [No authors listed] Biol Psychiatry. 2023 May 1;93(9):852. doi: 10.1016/j.biopsych.2023.02.011. Biol Psychiatry. 2023. PMID: 37045513 No abstract available.

Abstract

Background: Microdeletions of the MEF2C gene are linked to a syndromic form of autism termed MEF2C haploinsufficiency syndrome (MCHS). MEF2C hypofunction in neurons is presumed to underlie most of the symptoms of MCHS. However, it is unclear in which cell populations MEF2C functions to regulate neurotypical development.

Methods: Multiple biochemical, molecular, electrophysiological, behavioral, and transgenic mouse approaches were used to characterize MCHS-relevant synaptic, behavioral, and gene expression changes in mouse models of MCHS.

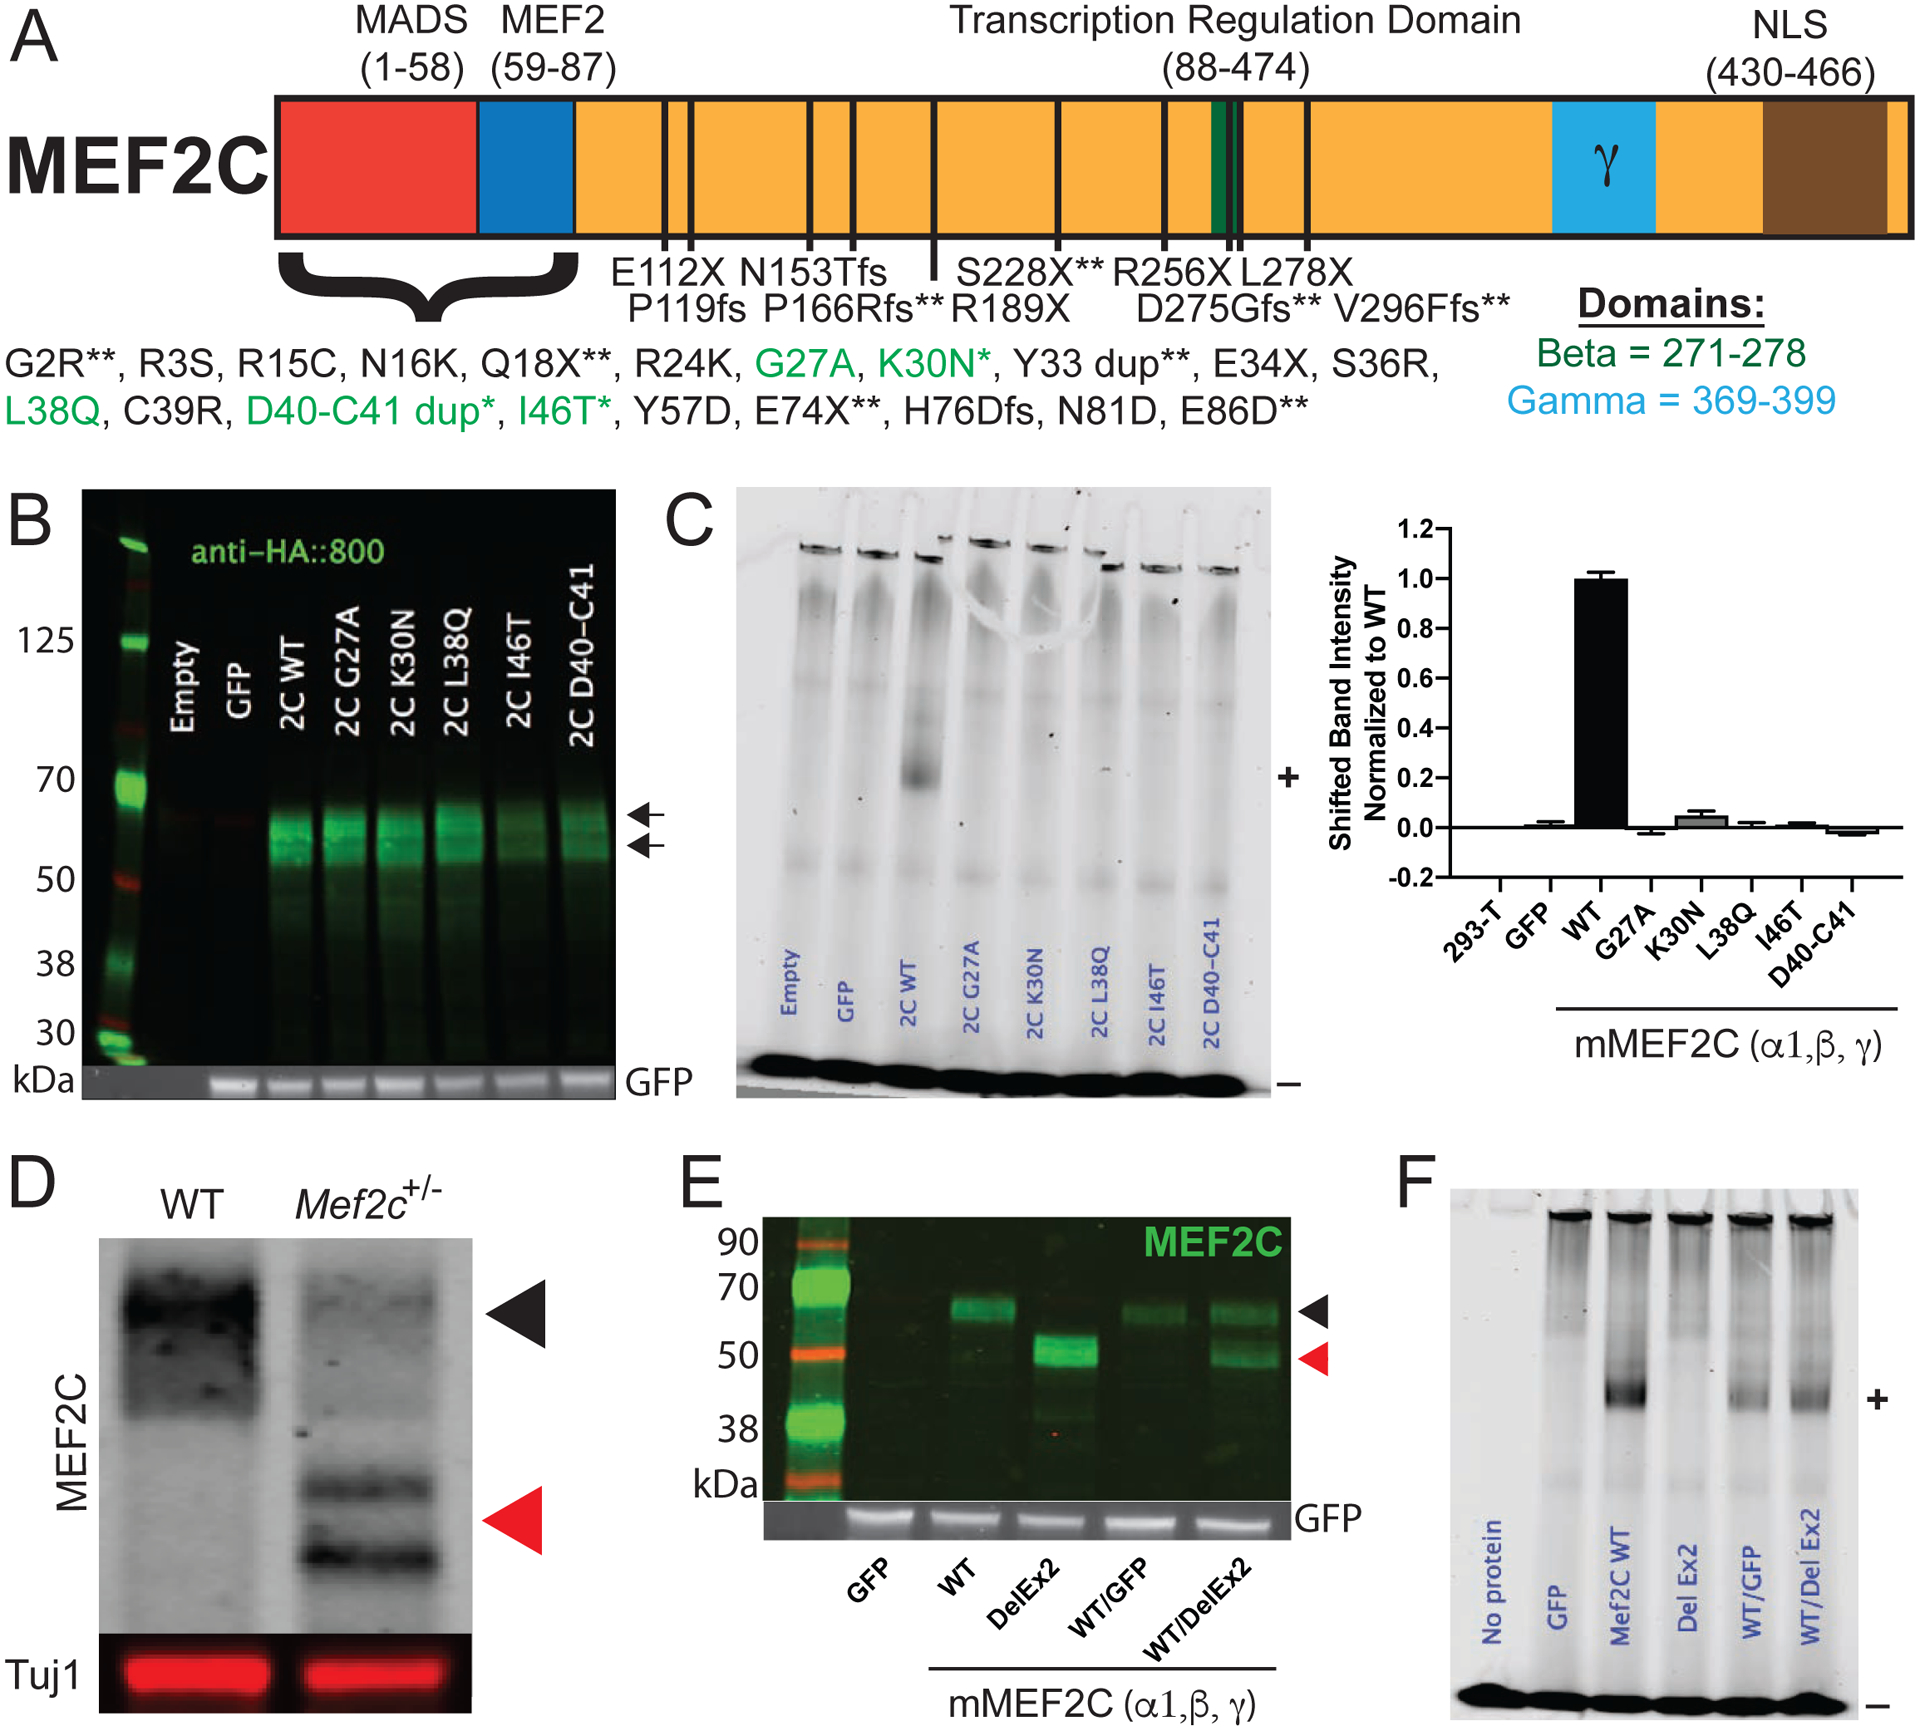
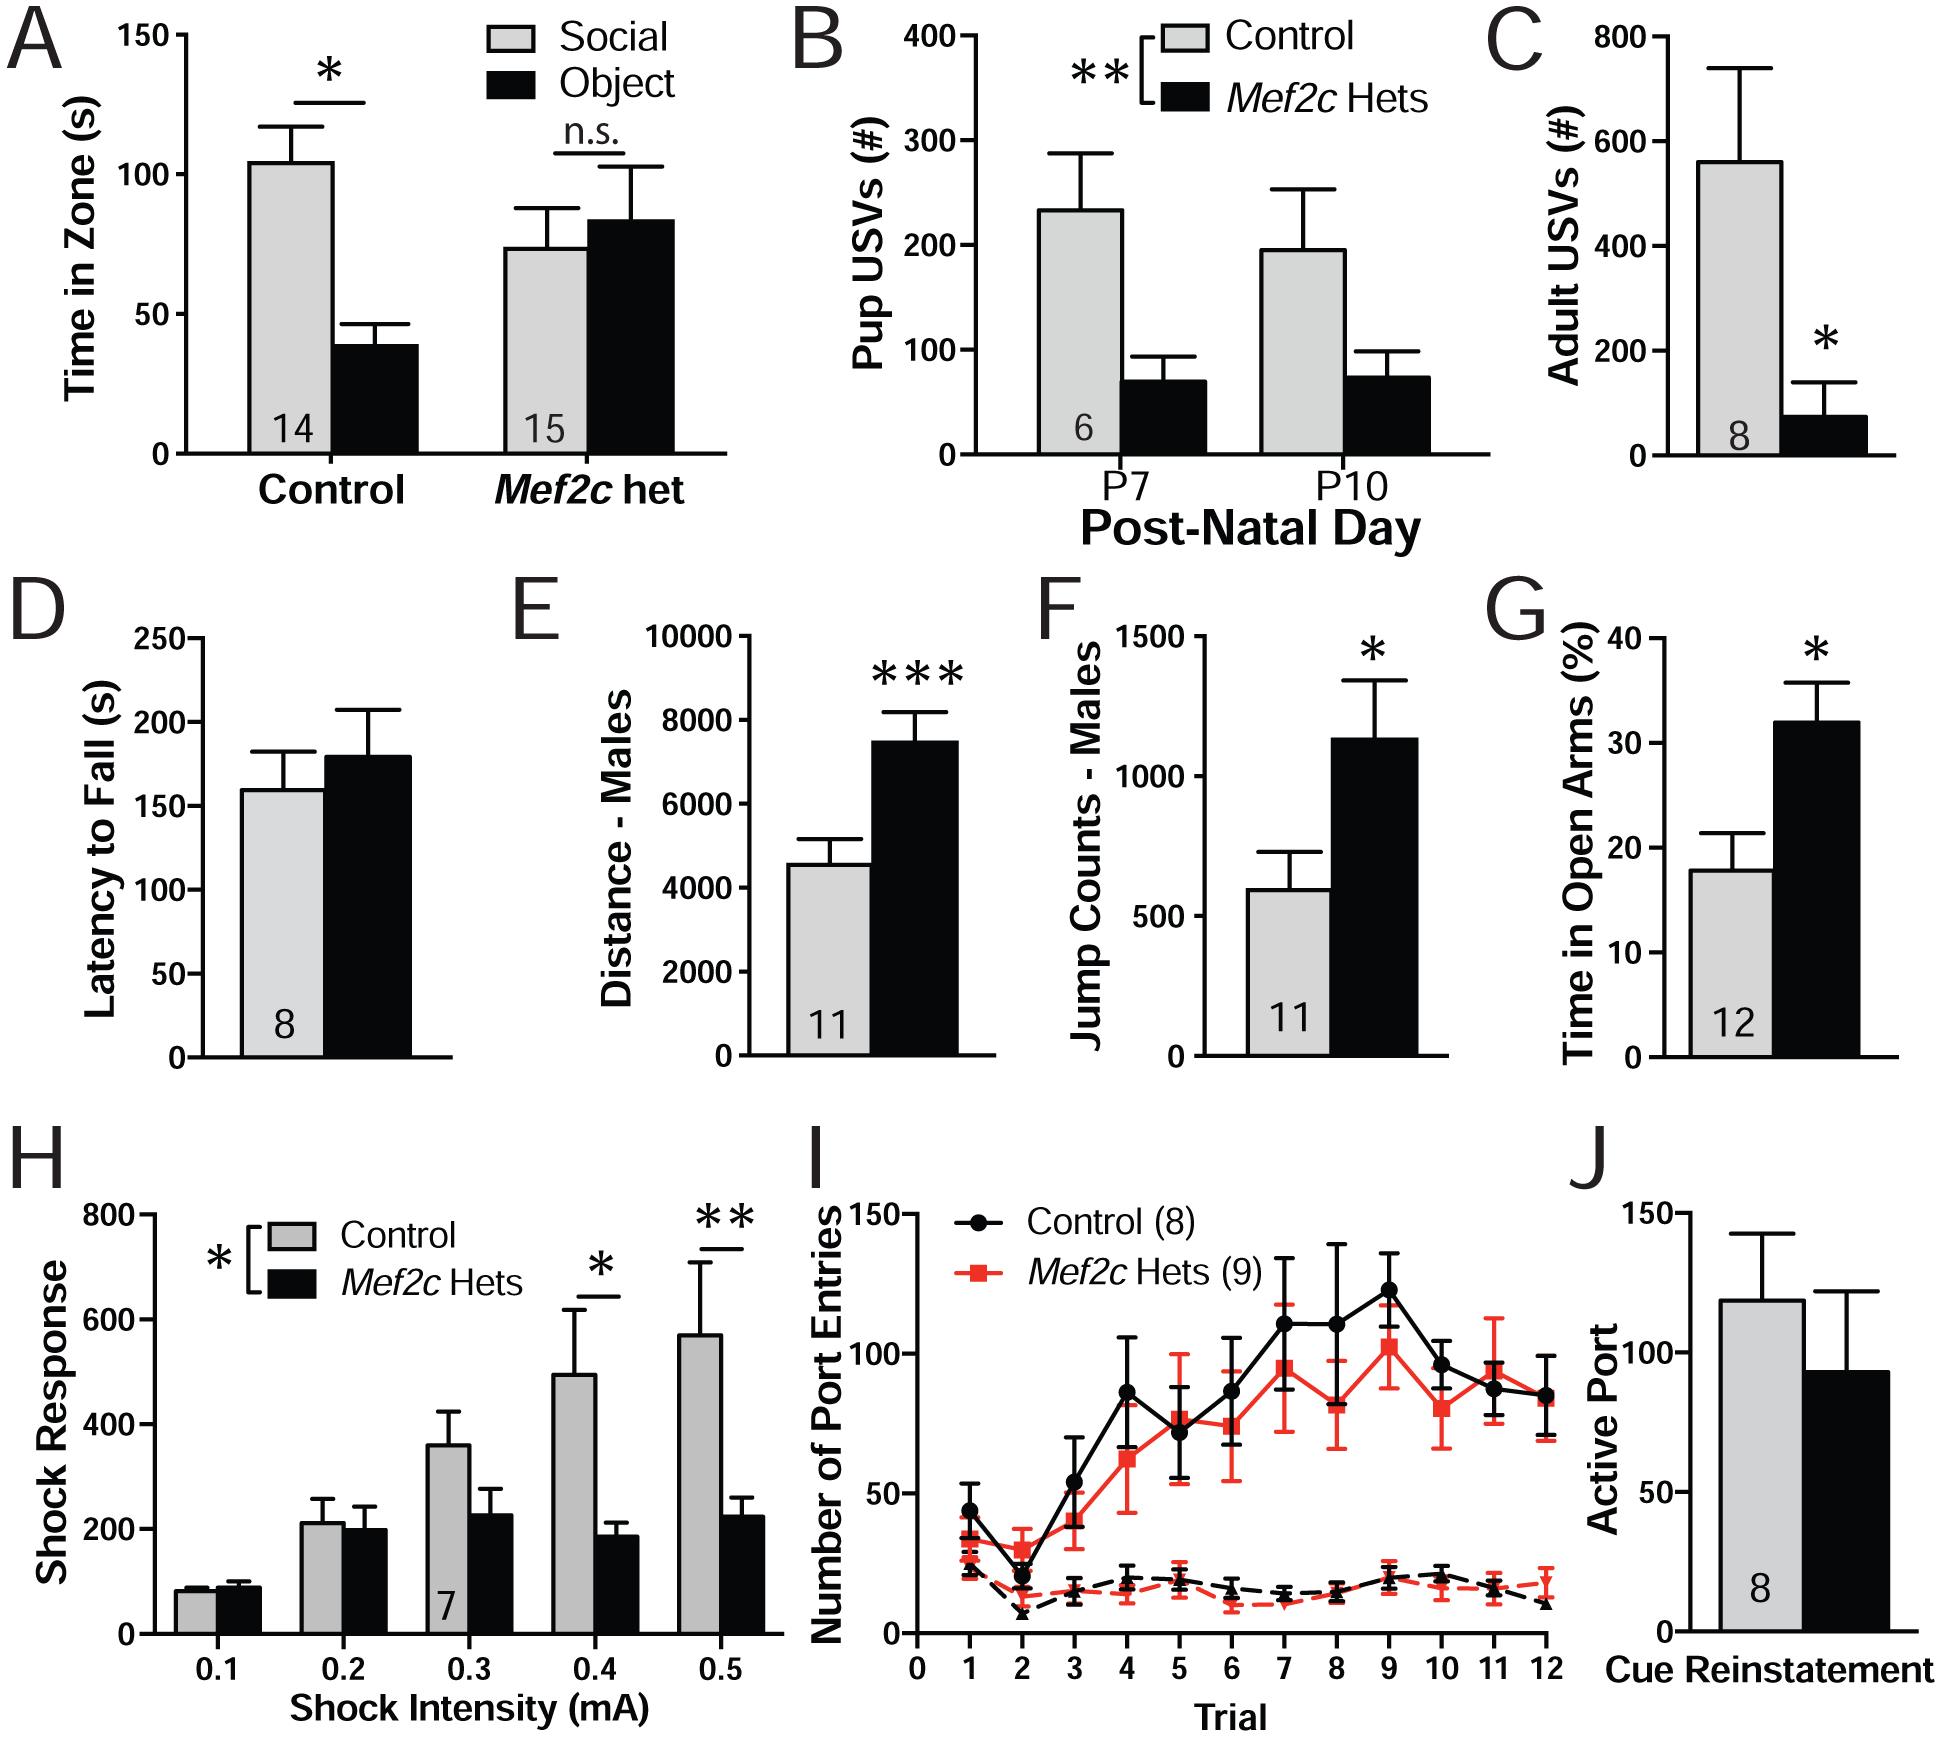
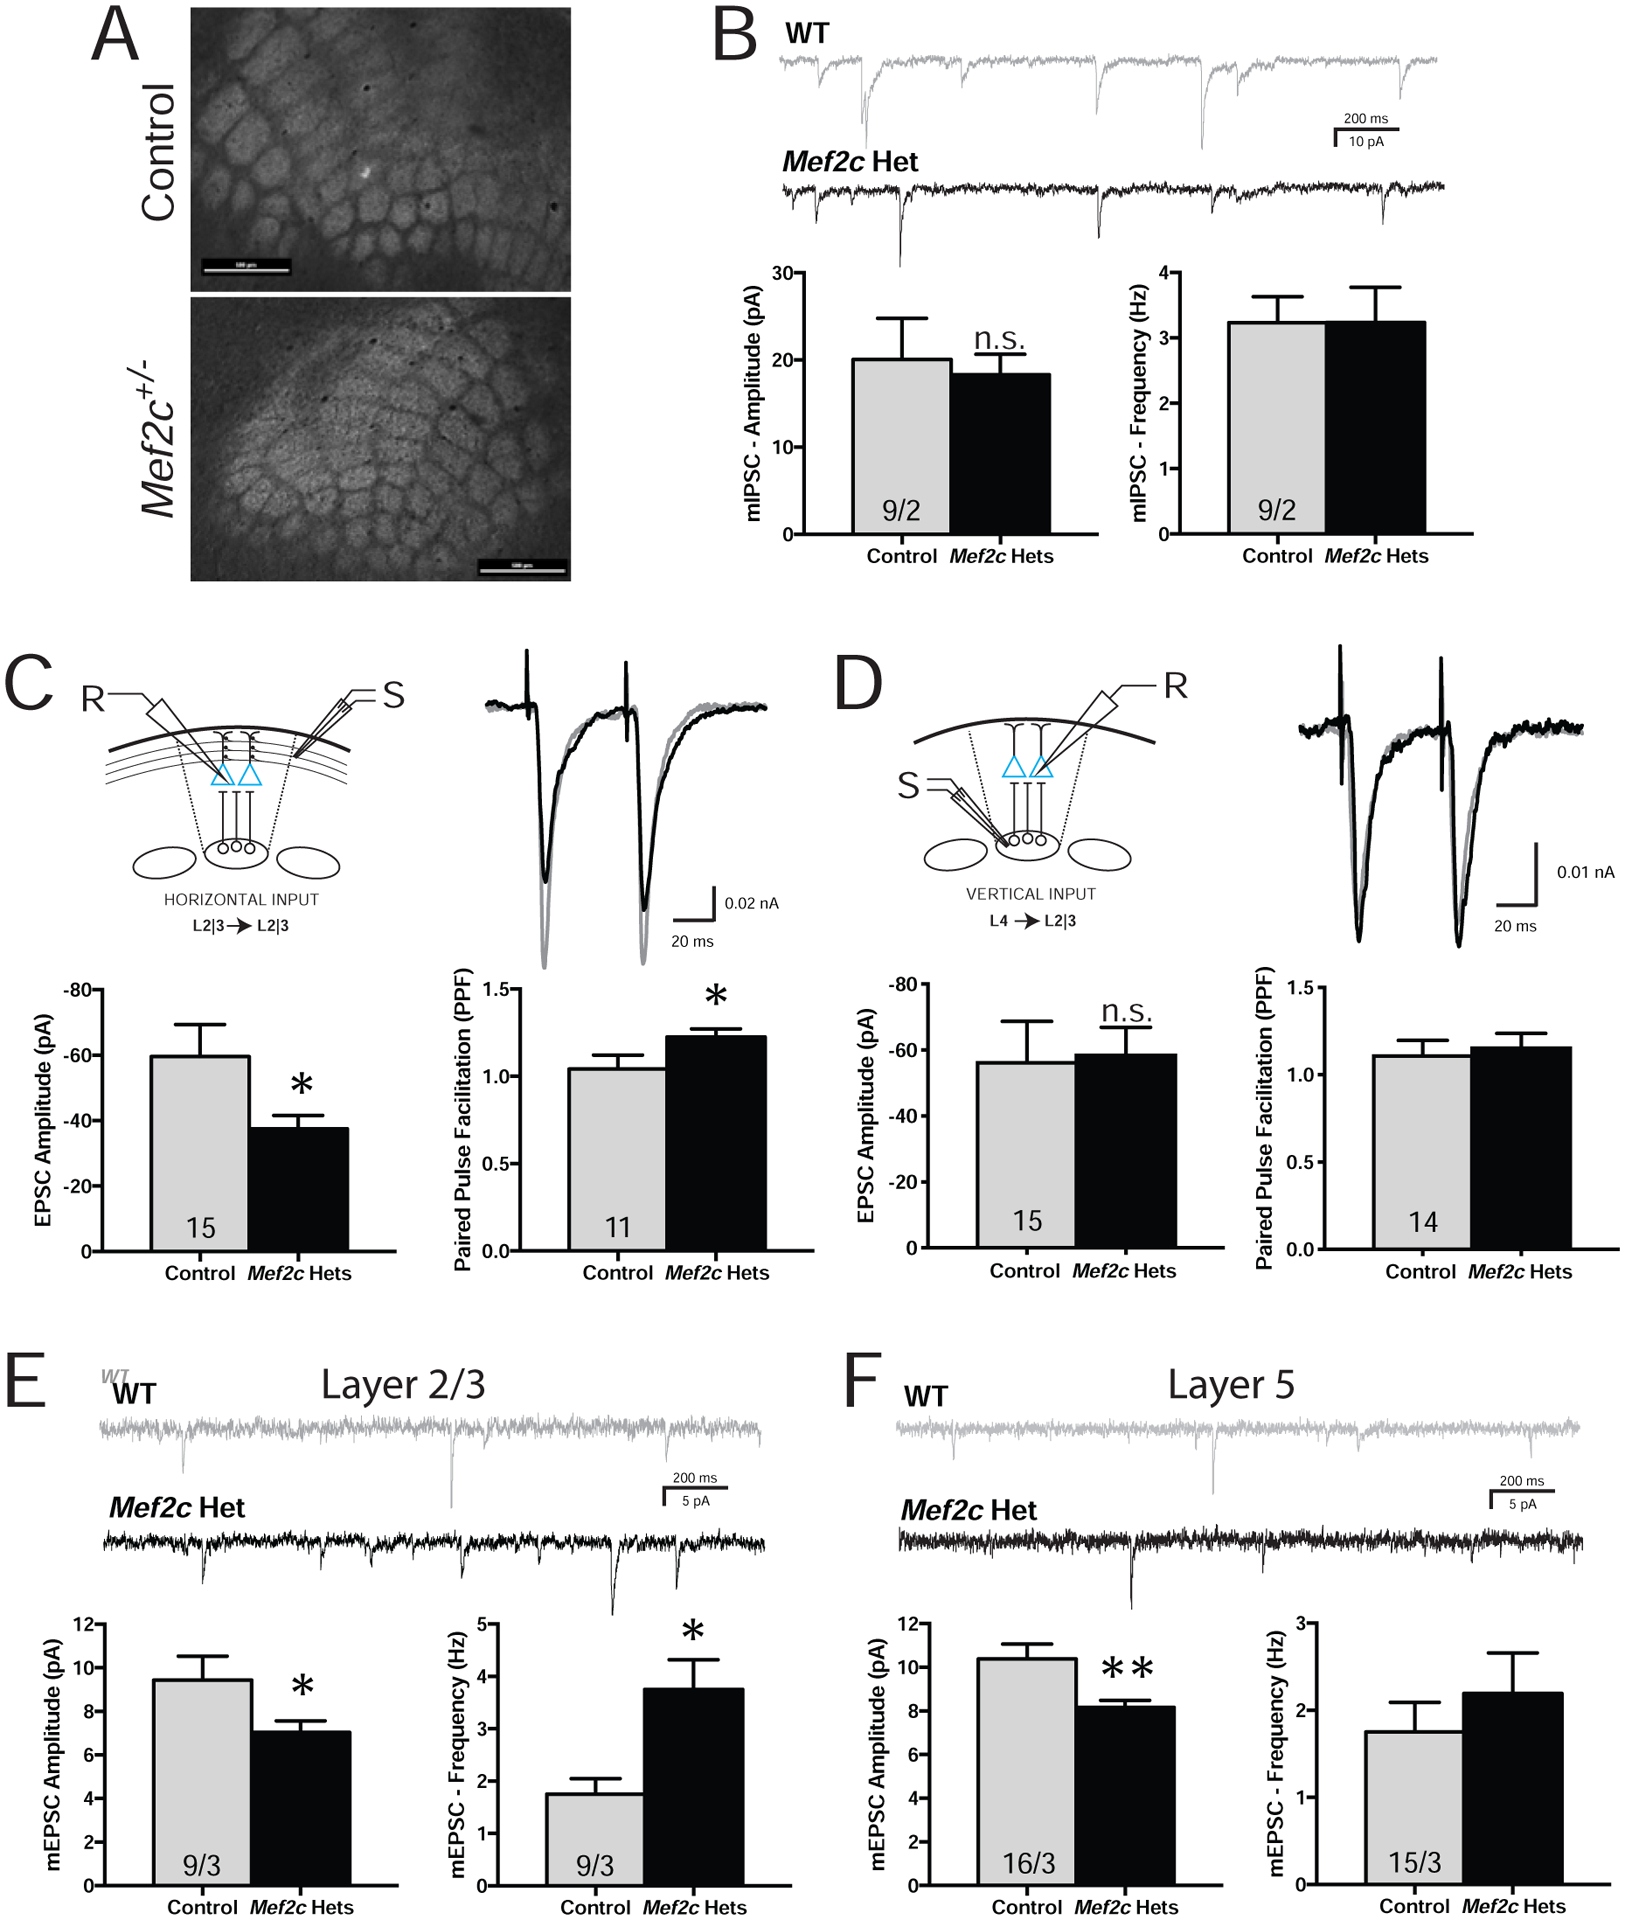
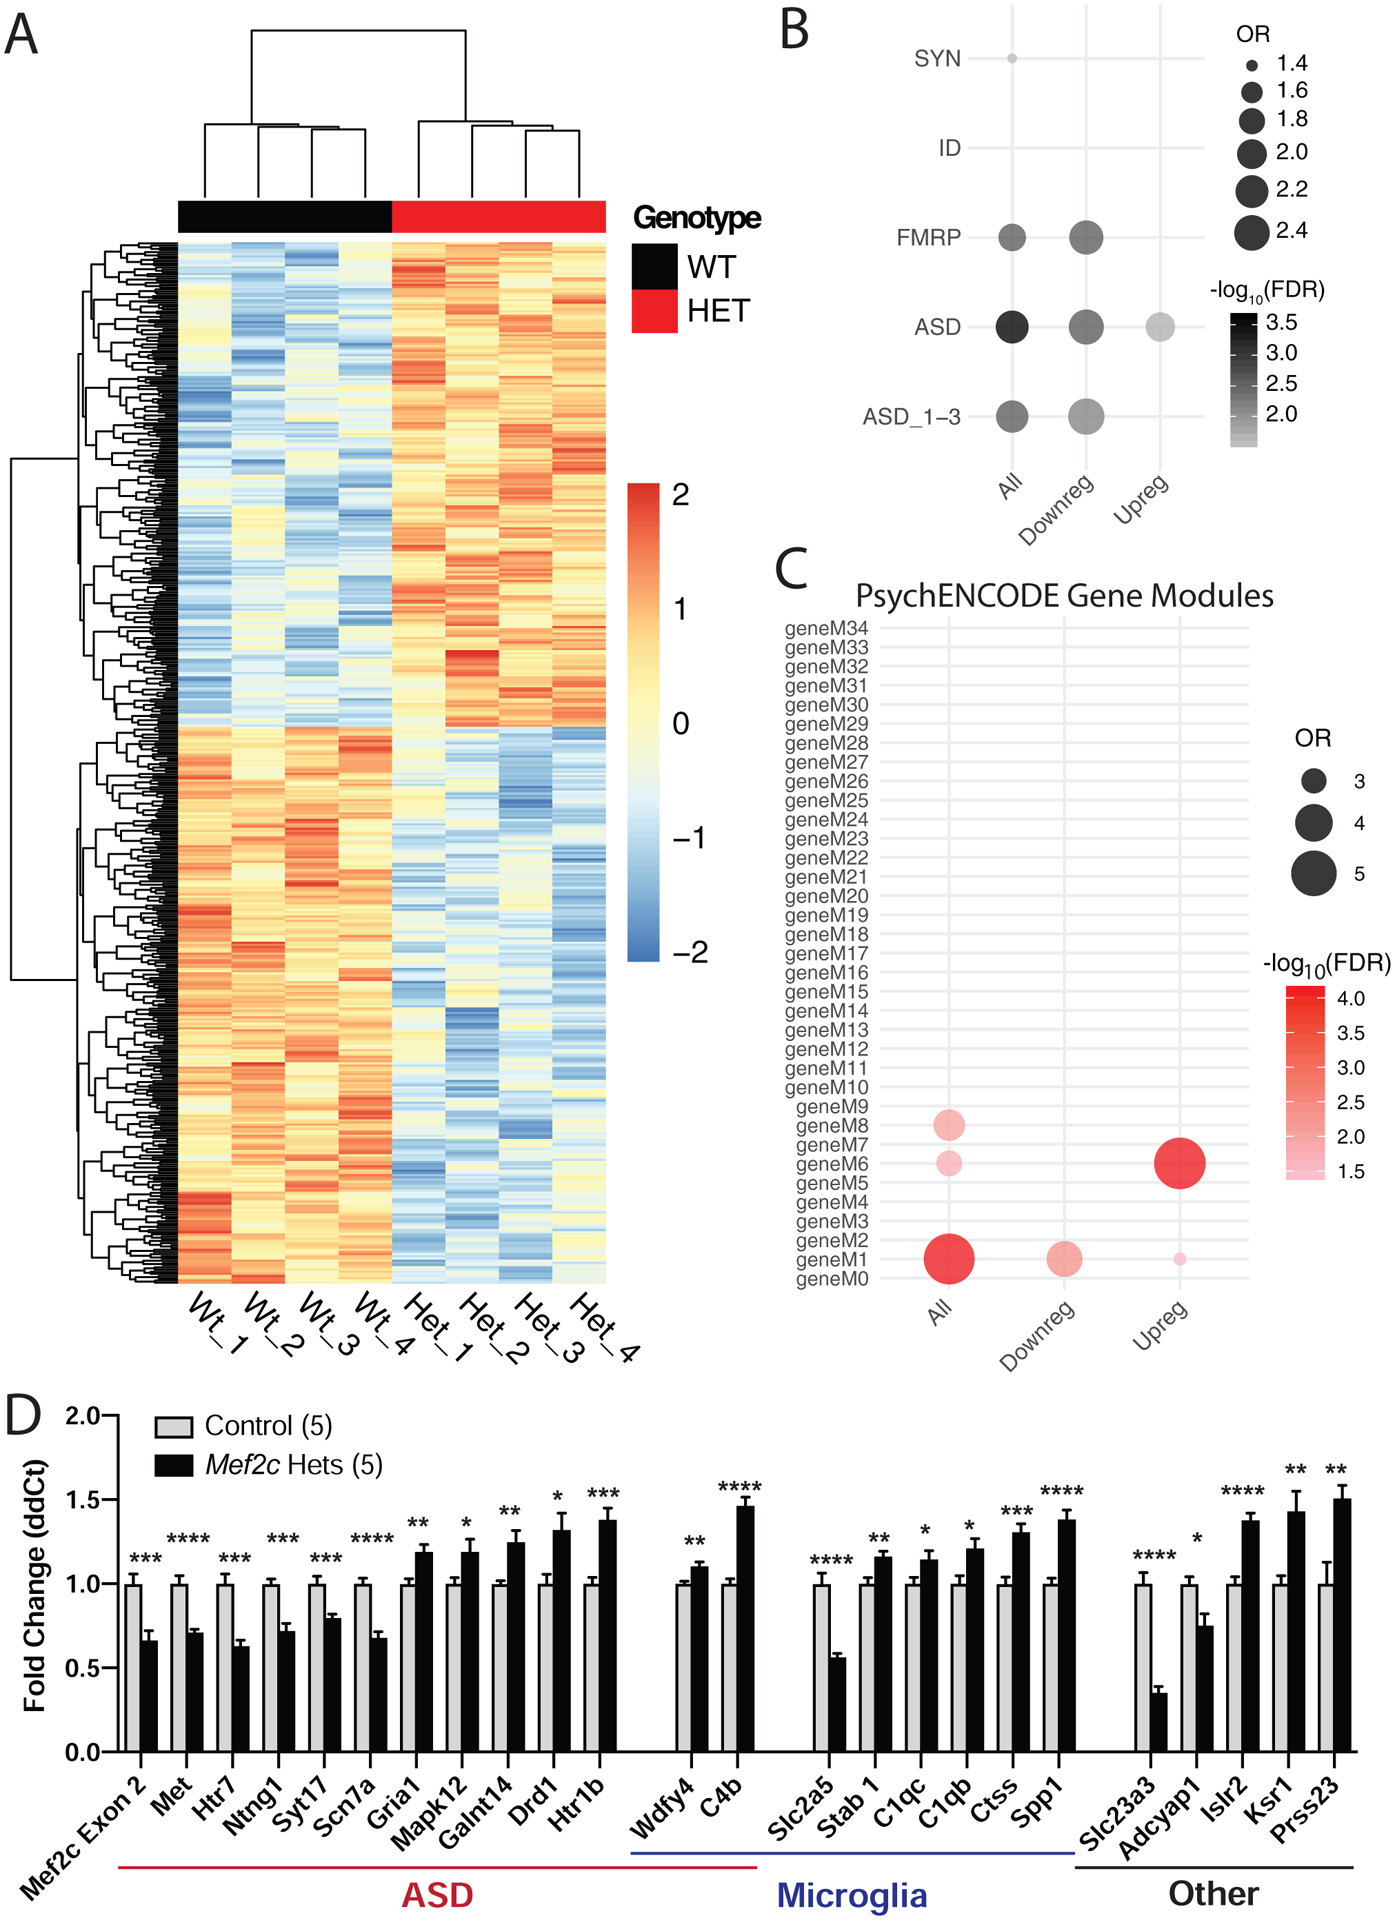
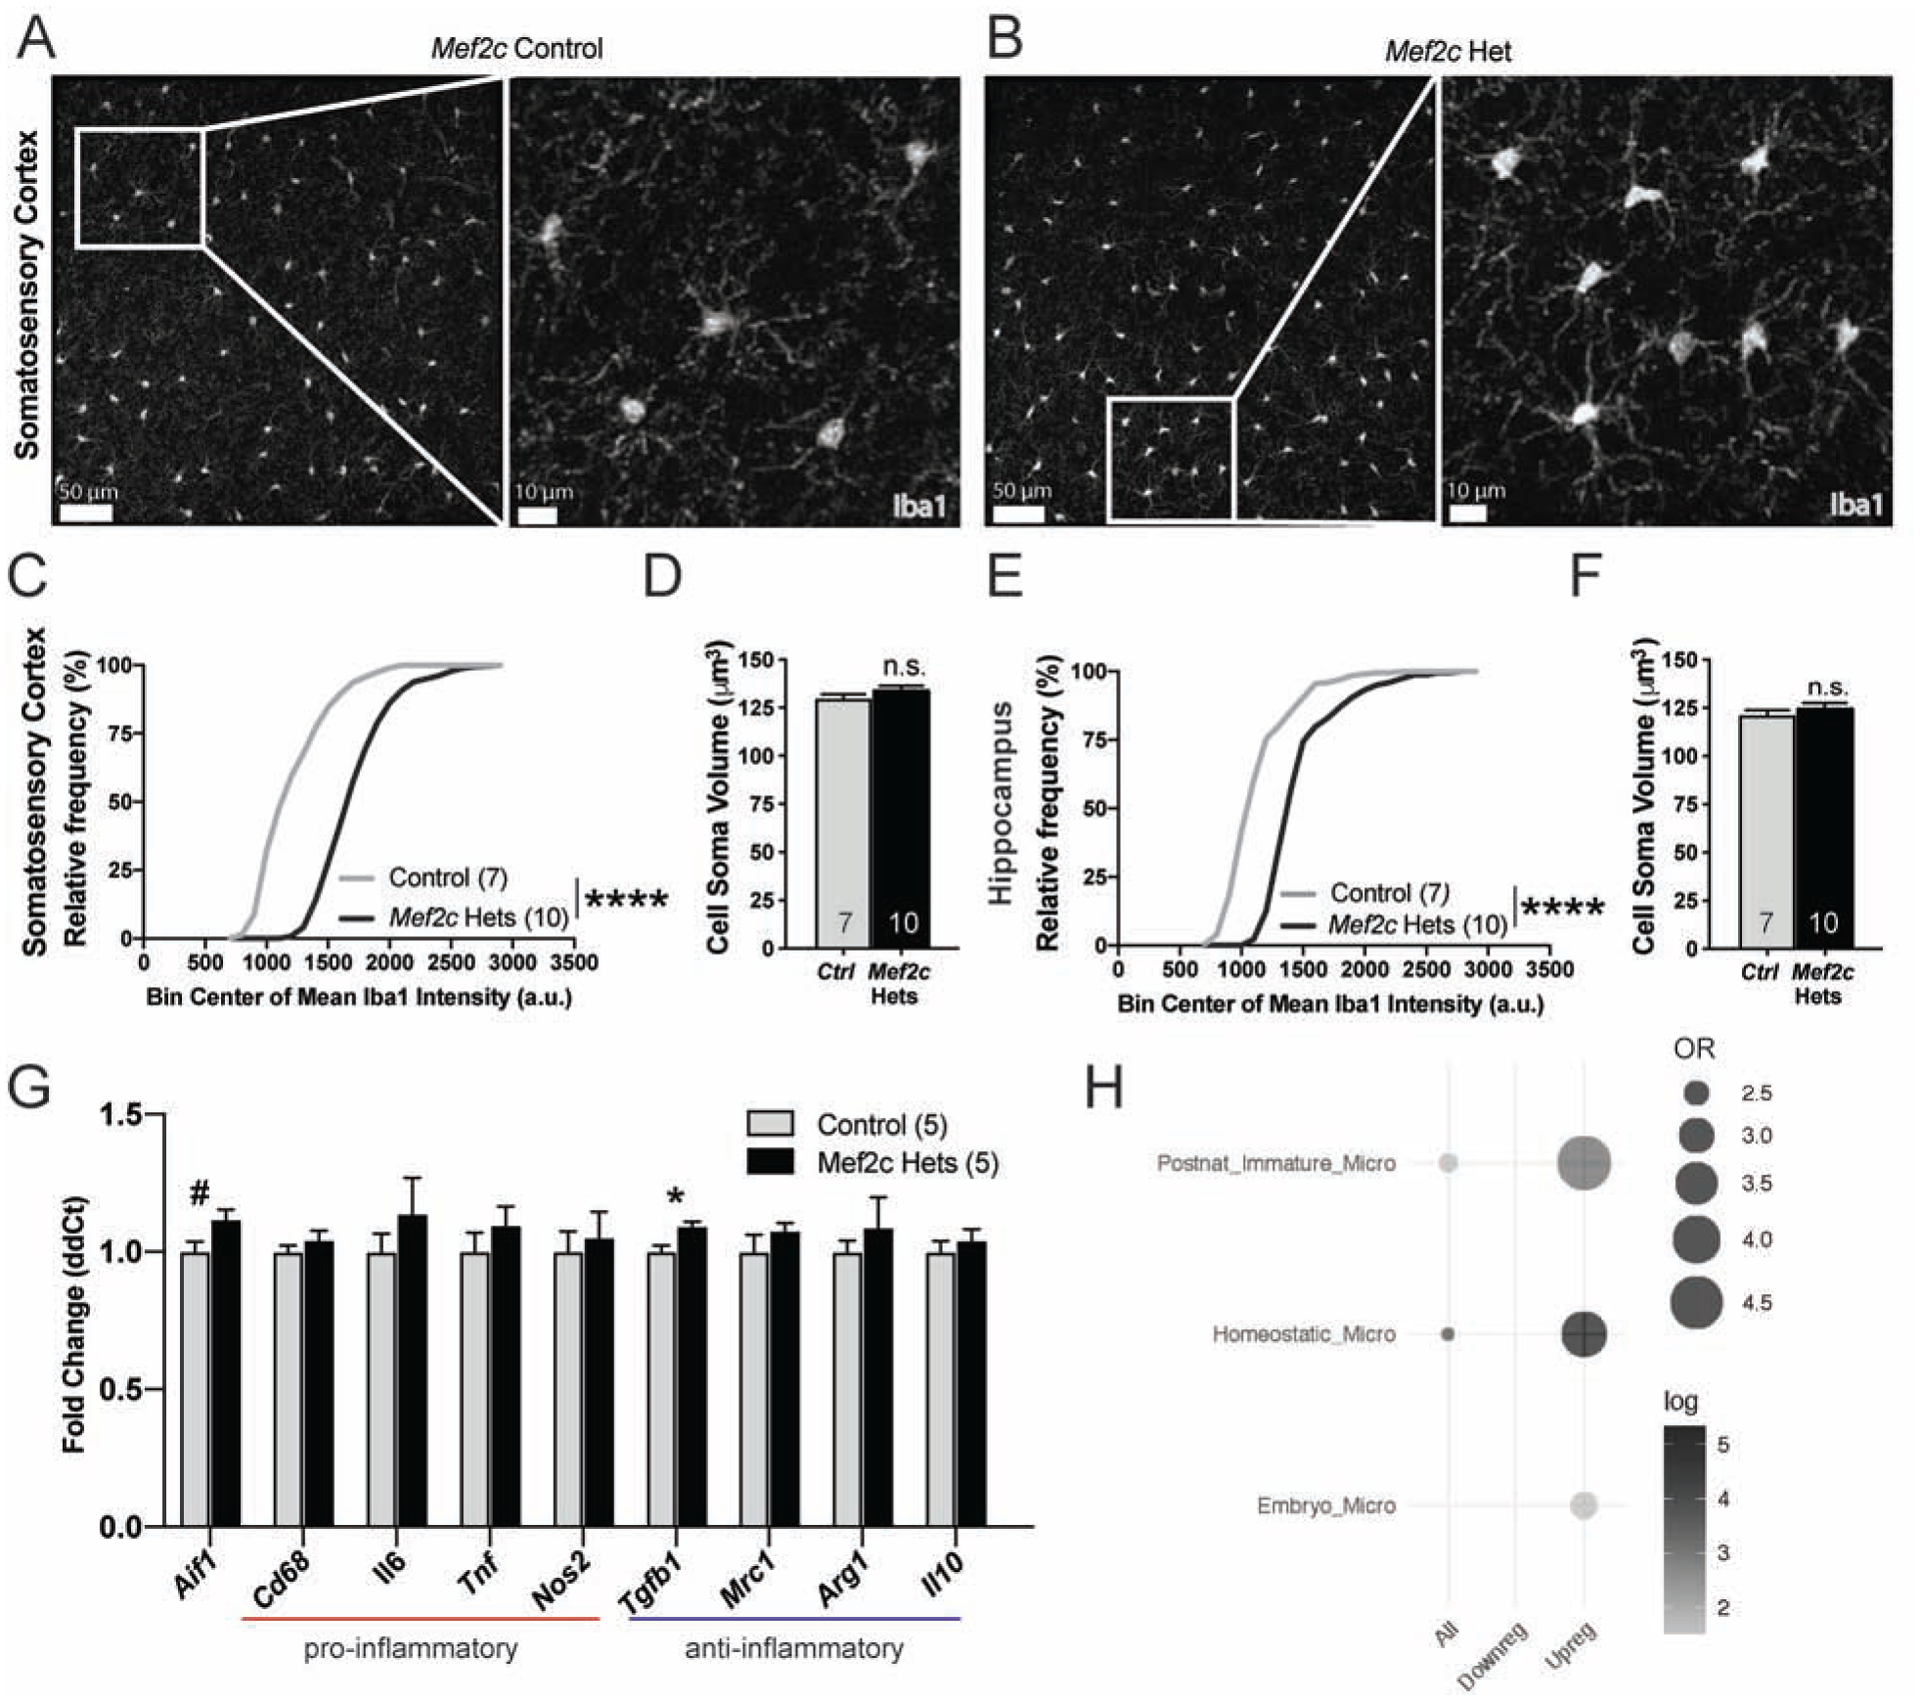
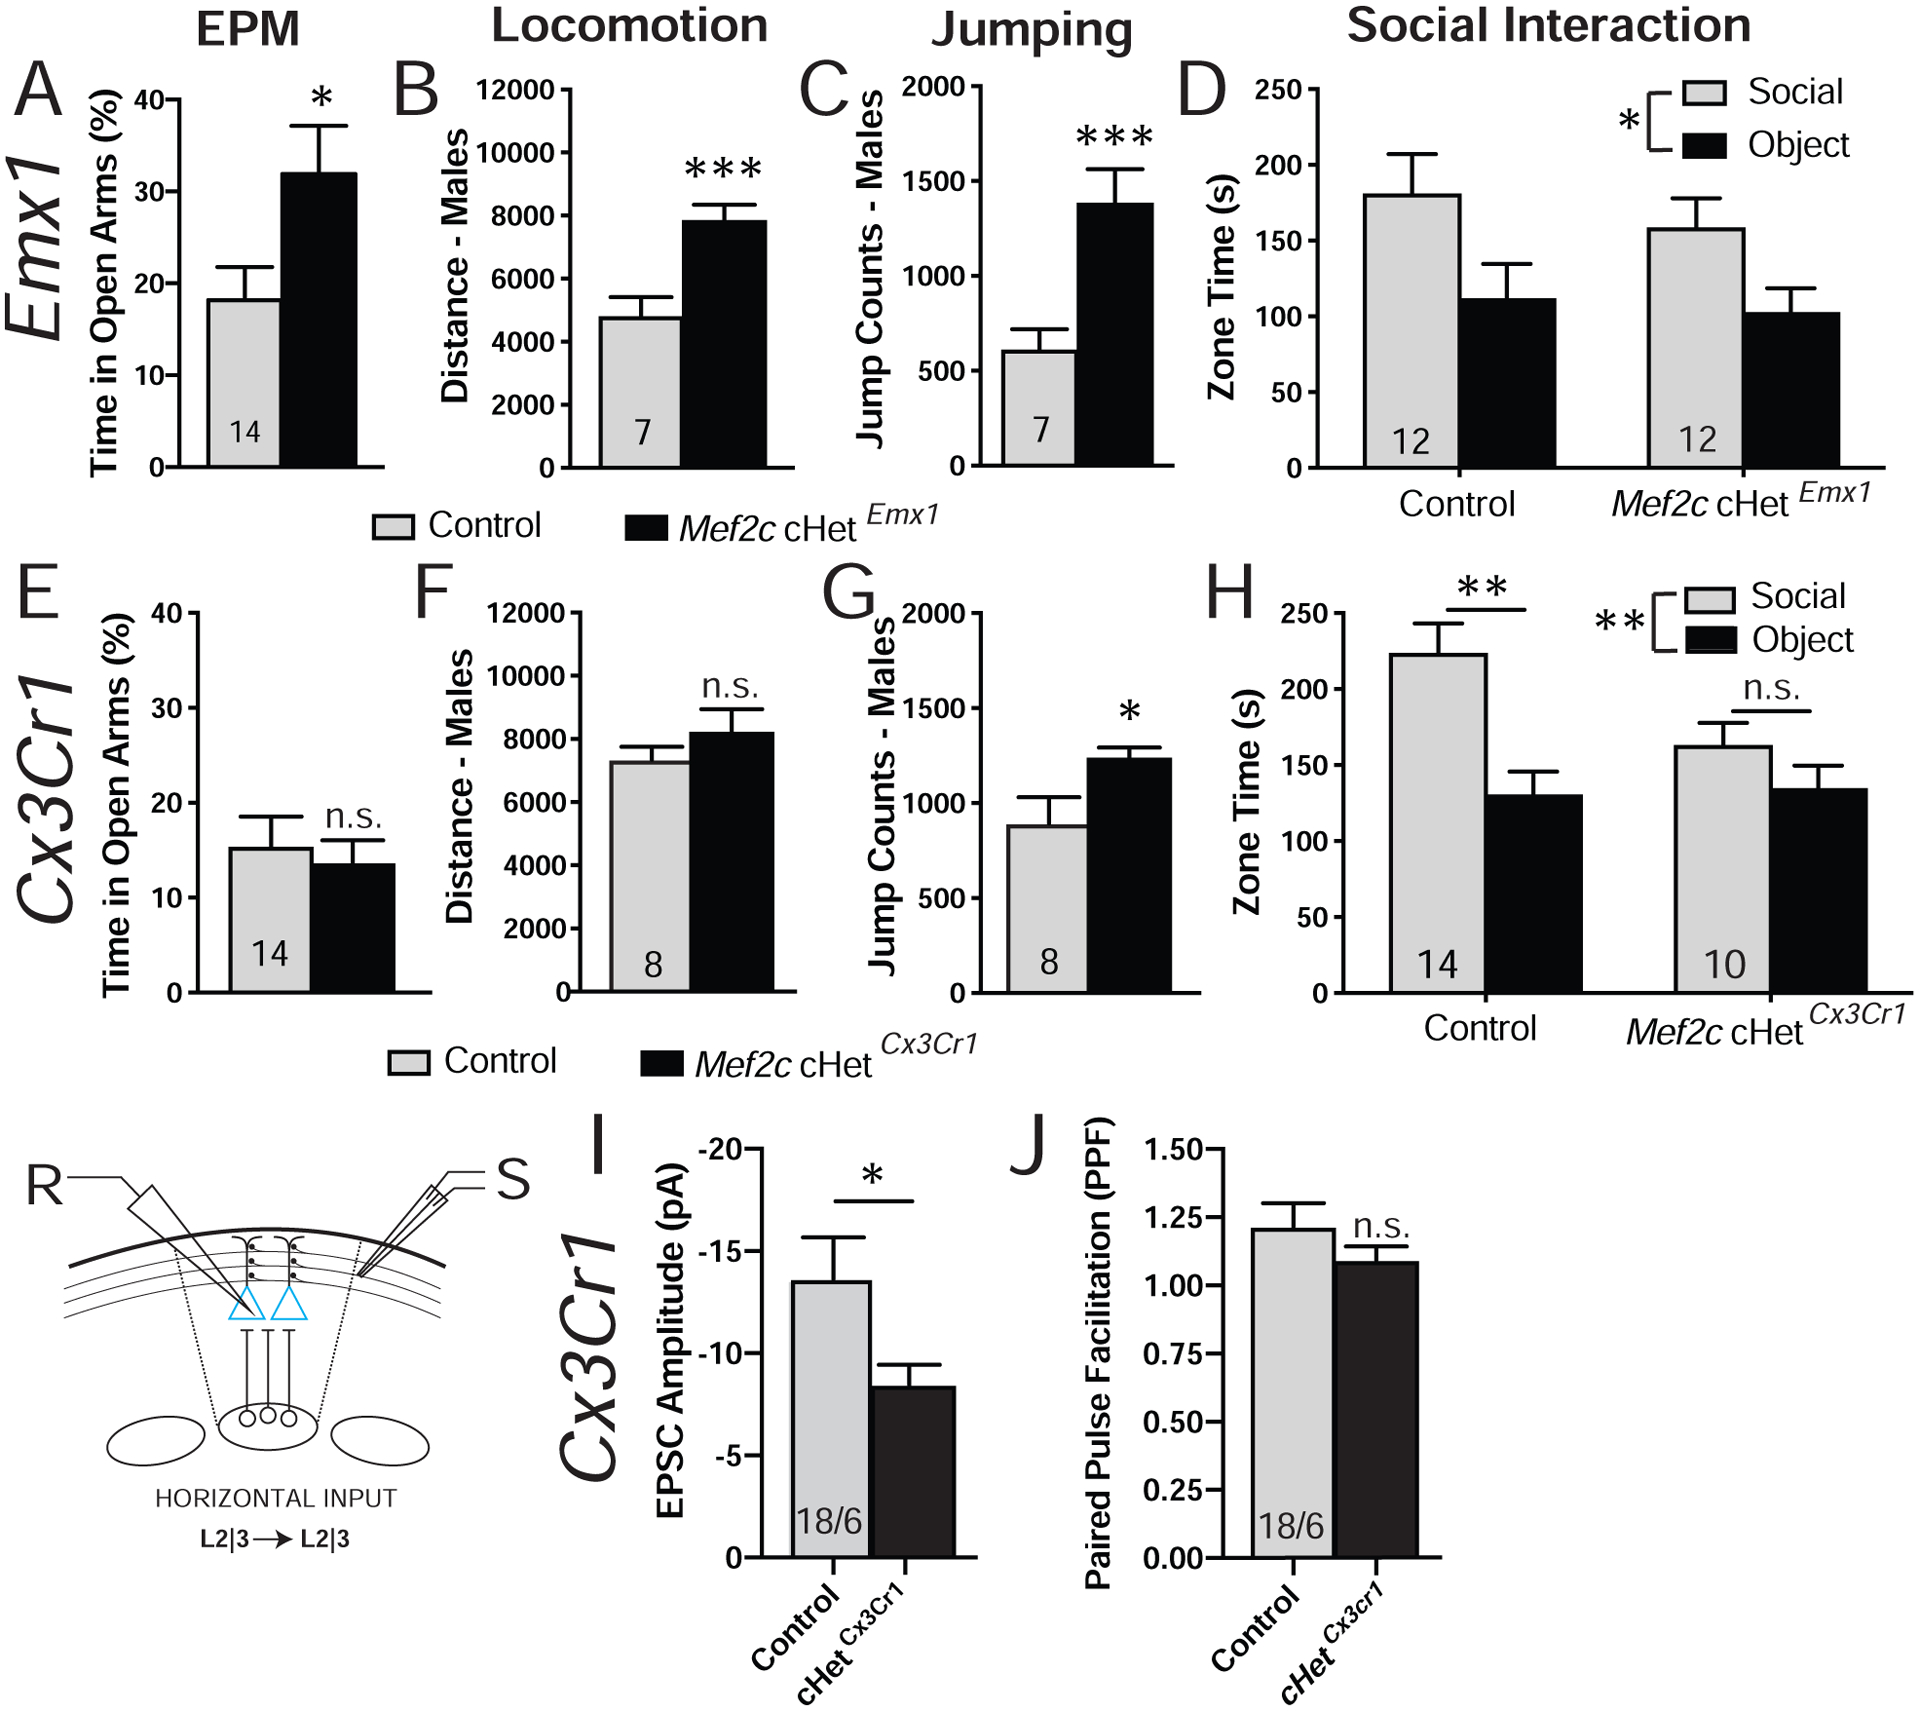
Results: We showed that MCHS-associated missense mutations cluster in the conserved DNA binding domain and disrupt MEF2C DNA binding. DNA binding-deficient global Mef2c heterozygous mice (Mef2c-Het) displayed numerous MCHS-related behaviors, including autism-related behaviors, changes in cortical gene expression, and deficits in cortical excitatory synaptic transmission. We detected hundreds of dysregulated genes in Mef2c-Het cortex, including significant enrichments of autism risk and excitatory neuron genes. In addition, we observed an enrichment of upregulated microglial genes, but this was not due to neuroinflammation in the Mef2c-Het cortex. Importantly, conditional Mef2c heterozygosity in forebrain excitatory neurons reproduced a subset of the Mef2c-Het phenotypes, while conditional Mef2c heterozygosity in microglia reproduced social deficits and repetitive behavior.

Conclusions: Taken together, our findings show that mutations found in individuals with MCHS disrupt the DNA-binding function of MEF2C, and DNA binding-deficient Mef2c global heterozygous mice display numerous MCHS-related phenotypes, including excitatory neuron and microglia gene expression changes. Our findings suggest that MEF2C regulates typical brain development and function through multiple cell types, including excitatory neuronal and neuroimmune populations.

Keywords: Autism; Mef2c; Microglia; Mouse; Neurodevelopmental disorder; Neuron.


Conflict of interest statement

Disclosures:

All authors report no biomedical financial interests or potential conflicts of interest.

Figures

Figure 1.
Figure 1.
MCHS associated mutations in MEF2C disrupt DNA binding. (A) Schematic of the MEF2C protein with locations of MCHS mutations. MCHS mutations in green are further characterized (B-C). MCHS mutations that are newly described in this manuscript are denoted with “ * ”. MCHS mutations not previously reported (personal communications) are denoted by “ ** “. The alternatively spliced beta (green) and gamma (blue) domains are shown. All MEF2C transcripts contain a C-terminal Nuclear Localization Sequence (NLS) that is disrupted by the frame-shift (fs) mutations. (B) Western blot of MEF2C wild-type (WT) and MCHS mutations in 293-T cells show that all MCHS mutations lead to protein expression. Arrows denote WT and mutant protein MEF2C bands. (C) Electrophoretic mobility shift assay (EMSA) using fluorescently labeled MEF2 response element (MRE) probe and MEF2C protein lysates from 293-T cells containing MEF2C mutations. MEF2C bound probe is shifted in the gel (denoted by “+”). Unbound fluorescent probe is denoted with a “−“. Only MEF2C WT binds to the fluorescently labeled MRE, while MCHS mutant proteins fail to bind the MRE probe (C). Quantification of bound probe is included (C). (D) Western blot of MEF2C from cortical lysates of control and Mef2c-Het mice. The black arrow denotes MEF2C WT and red arrows denote MEF2C DelEx2 (D,E). (E) Western blot of MEF2C WT and MEF2C DelEx2 from 293-T cells. (F) MEF2C DelEx2 fails to bind the MRE probe and does not interfere with MEF2C WT binding to MRE probes. “+” is bound probe. “−“ is unbound probe. Data are reported as mean ± SEM. Also see Figure S1.
Figure 2.
Figure 2.
Mef2c-Het mice display multiple MCHS-relevant behaviors. (A) Three chamber social interaction test. Control mice spent significantly more time interacting with a novel animal over a novel object while the Mef2c-Het mice showed no preference for the novel object or the novel animal. (B) Mef2c-Het pups emitted fewer ultrasonic vocalizations (USVs) during maternal separation in early post-natal development. (C) Adult male Mef2c-Het mice produced fewer USVs that control mice in the presence of a female mouse in estrous. (D) Both control and Mef2c-Het mice have similar latencies to fall on an accelerating rotarod. (E,F) Male Mef2c-Het mice are hyperactive (E) and show increased jump counts (F). (G) Mef2c-Het mice spend significantly more time on the open arms of the elevated-plus maze. (H) Mef2c-Het mice have reduced response to shock. (I) Both control and Mef2c-Het mice increase the number of active port entries (solid line) during sucrose self-administration. Dashed line represents inactive port entries. (J) Both control and Mef2c-Hets show similar active port entries during cue-induced reinstatement of sucrose seeking. Data are reported as mean ± SEM. Statistical significance was determined by 2-way ANOVA (A,B,H,I) or unpaired t-test (C-G,J). *p<0.05, **p<0.01, ***p<0.005, n.s. = not significant. Number of animals (n) are reported in each graph for respective experiment. Also see Figure S2.
Figure 3.
Figure 3.
Mef2c-Het mice have alterations in cortical synaptic transmission. (A) Both control and Mef2c-Het mice have normal barrel fields in the somatosensory cortex, as reflected by VGlut2 staining. Scale bar=500 μm. (B-F) Ex vivo recordings from organotypic slices were collected from pyramidal neurons within the barrel cortex field. (B) No changes were observed in mIPSC amplitude or frequency in the Mef2c-Het layer 2/3 pyramidal neurons. (C) Reduced EPSC amplitude and increased paired pulse facilitation (PPF) were observed in layer 2/3 Mef2c-Het neurons after stimulating input neurons from neighboring layer 2/3 neurons in adjacent barrel fields (horizontal inputs). (D) No changes in evoked EPSC amplitude or PPF were observed in layer 2/3 pyramidal neurons after stimulating input neurons from layer 4 (vertical inputs). “R” is recording electrode. “S” is stimulating electrode. (E,F) Mef2c-Het cortical pyramidal neurons have reduced mEPSC amplitude in layer 2/3 (E) and layer 5 (F), and increased mEPSC frequency in layer 2/3 (E). Data are reported as mean ± SEM. Statistical significance was determined by unpaired t-test. *p<0.05. Number of cells and animals, respectively, are reported in each graph. Also see Figure S3.
Figure 4.
Figure 4.
Differentially expressed genes in Mef2c-Het cortex. (A) Heatmap showing differentially expressed genes (DEGs) in Mef2c-Het cortex (p35-p40) compared with controls. In red, are genes with higher expression; in blue, are genes with lower expression. (B) Mef2c-Het DEGs are significantly enriched in genes associated with FMRP, ASD, or scored ASD (ASD_1–3; high-confidence ASD genes) (see Methods). (C) Mef2c-DEGs are enriched in gene modules dysregulated in neuropsychiatric disorders, specifically the M1 and M6 modules. (D) qPCR validation of select Mef2c-Het DEGs associated with autism, microglia, or other cellular functions. Data are reported as mean ± SEM (D). Statistical significance was determined by unpaired t-test (D). *p<0.05, **p<0.01, ***p<0.005, ****p<0.0005. See Methods for statistical analysis of A-C. Number of animals (n) is 4/genotype for RNA-Seq and 5/genotype for qPCR validation. Also see Figure S4.
Figure 5.
Figure 5.
Mef2c-Het mice exhibit increased Iba1 expression levels. (A,B) Representative images of Iba1-positive microglia in the SSCtx in control (A) and Mef2c-Het mice (B). (C,E) Mef2c-Het mice have a right-shifted cumulative frequency distribution of mean Iba1 intensities in Iba1-positive cells (microglia) in the SSCtx (C) and hippocampus (E) compared to controls. Gray line represents distribution of control cells and black line represents distribution of Mef2c-Het cells. (D,F) There is no difference in the cell soma volume of Iba1 positive cells (microglia) in the SSCtx (D) or hippocampus (F) between controls and Mef2c-Het mice. (G) Fold changes of genes associated with microglial activation in controls and Mef2c-Hets. (H) Mef2c-Hets have an upregulation of genes expressed in postnatal immature, homeostatic, and embryonic microglia. Unless specified, data are reported as mean ± SEM. Statistical significance determined by Kolmogorov–Smirnov test (C,E) or unpaired two-tailed nested t-test (D,F), unpaired two-tailed t-test (G). ****<0.0001. Sample sizes for each genotype are denoted on bars of or above each graph unless otherwise specified. Images (A,B) have contrast and brightness enhanced for ease of viewing. Images are modified equally for both genotypes. Also see Figure S5.
Figure 6.
Figure 6.
Cell type-selective phenotypes in Mef2c conditional heterozygous (Mef2c-cHet) mice. (A-D) Behaviors in Mef2c cHetEmx1 mice. (A) Mef2c cHetEmx1 mice spend more time on the open arms of the elevated plus maze. (B,C) Male Mef2c-cHet Emx1 mice are hyperactive (B) and show increased jump counts (C). (D) Mef2c cHetEmx1 mice have normal social interaction. (E-H) Behaviors in Mef2c cHetCx3cr1 mice. (E) Mef2c cHetCx3cr1 mice are similar to controls in elevated plus maze. (F,G) Male Mef2c cHetCx3cr1 mice have normal activity (F) but show increased jump counts (G) compared to control mice. (H) Mef2c cHetCx3cr1 mice have a lack of preference for interacting with a novel mouse (social) over the novel object. (I,J) Mef2c cHetCx3cr1 mouse layer 2/3 pyramidal neurons have decreased evoked EPSC amplitude (I) without a change in paired pulse facilitation (J). Data are reported as mean ± SEM. Statistical significance was determined by unpaired t-test (A-C, E-G, I-J) or 2-way ANOVA (D,H). n.s. = not significant, *p<0.05, **p<0.01, ***p<0.005, n.s. = not significant. Number of animals (A-H) or cells/animals (I-J), respectively, are reported in each graph for respective experiment. Also see Figure S6.

Similar articles

Cited by

References

    1. Assali A, Harrington AJ, Cowan CW (2019): Emerging roles for MEF2 in brain development and mental disorders. Current opinion in neurobiology. 59:49–58. - PMC - PubMed
    1. Harrington AJ, Raissi A, Rajkovich K, Berto S, Kumar J, Molinaro G, et al. (2016): MEF2C regulates cortical inhibitory and excitatory synapses and behaviors relevant to neurodevelopmental disorders. Elife. 5. - PMC - PubMed
    1. Morrow EM, Yoo SY, Flavell SW, Kim TK, Lin Y, Hill RS, et al. (2008): Identifying autism loci and genes by tracing recent shared ancestry. Science. 321:218–223. - PMC - PubMed
    1. Flavell SW, Kim TK, Gray JM, Harmin DA, Hemberg M, Hong EJ, et al. (2008): Genome-wide analysis of MEF2 transcriptional program reveals synaptic target genes and neuronal activity-dependent polyadenylation site selection. Neuron. 60:1022–1038. - PMC - PubMed
    1. Flavell SW, Cowan CW, Kim TK, Greer PL, Lin Y, Paradis S, et al. (2006): Activity-dependent regulation of MEF2 transcription factors suppresses excitatory synapse number. Science. 311:1008–1012. - PubMed

Publication types

Substances