. 2020 Jul;123(2):196-206.
doi: 10.1038/s41416-020-0881-z. Epub 2020 May 18.

Enrichment of the tumour immune microenvironment in patients with desmoplastic colorectal liver metastasis

Affiliations

Enrichment of the tumour immune microenvironment in patients with desmoplastic colorectal liver metastasis

Diederik J Höppener et al. Br J Cancer. 2020 Jul.

Abstract

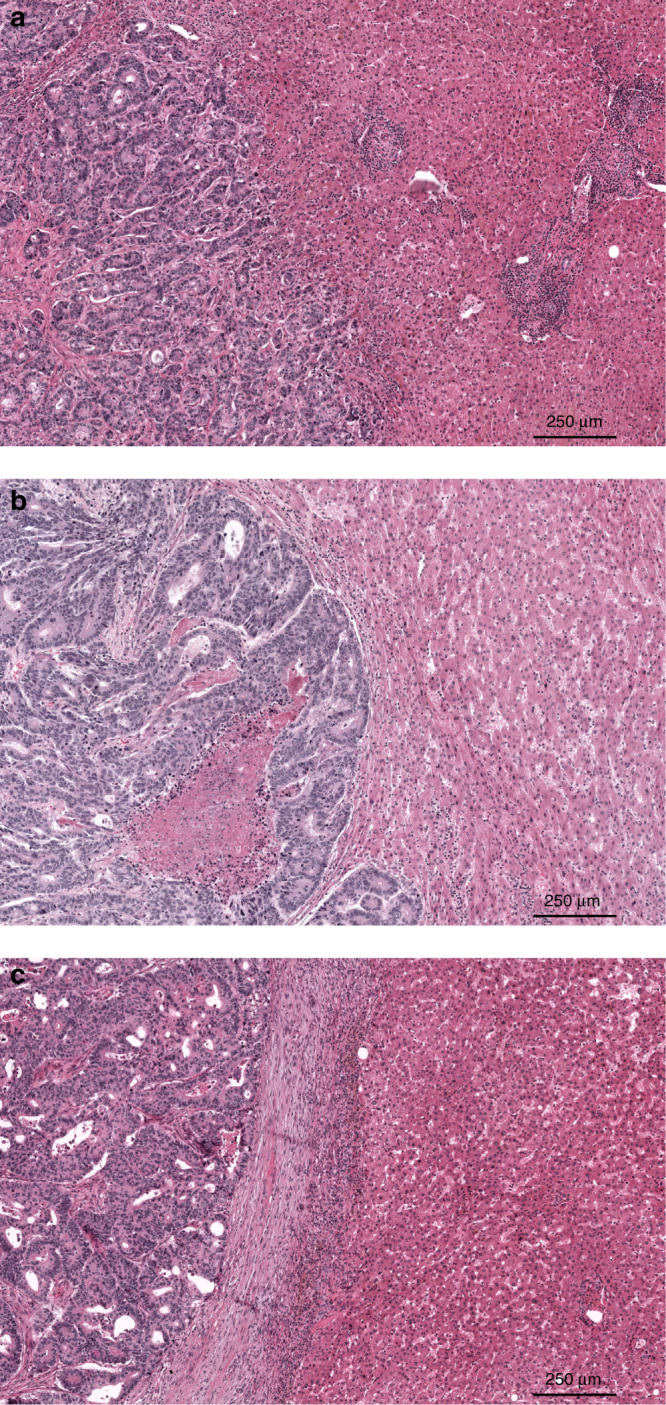
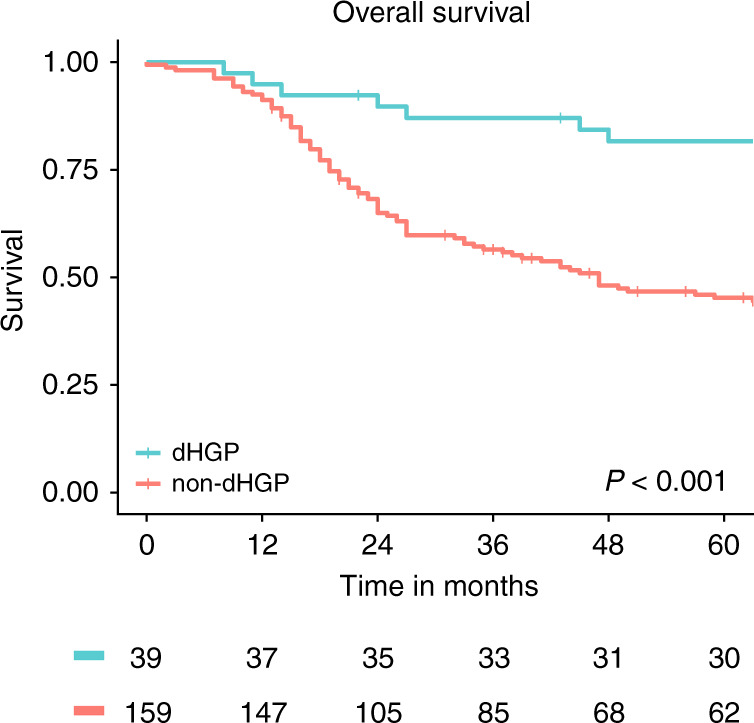
Background: Patients with resected colorectal liver metastasis (CRLM) who display only the desmoplastic histopathological growth pattern (dHGP) exhibit superior survival compared to patients with any non-desmoplastic growth (non-dHGP). The aim of this study was to compare the tumour microenvironment between dHGP and non-dHGP.

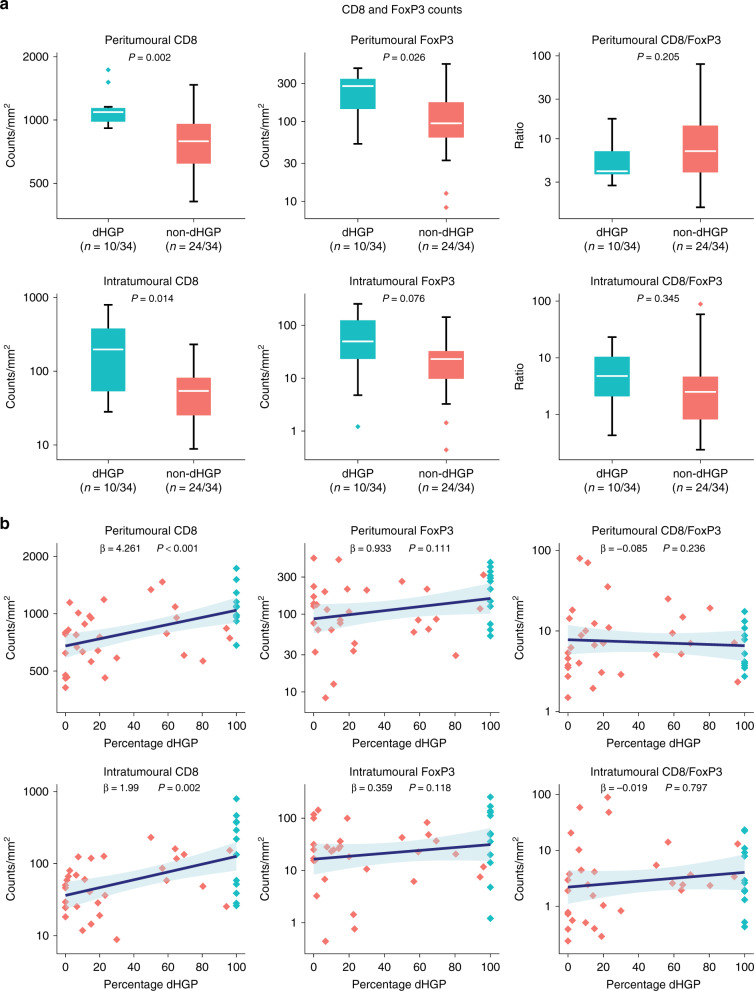
Methods: The tumour microenvironment was investigated in three cohorts of chemo-naive patients surgically treated for CRLM. In cohort A semi-quantitative immunohistochemistry was performed, in cohort B intratumoural and peritumoural T cells were counted using immunohistochemistry and digital image analysis, and in cohort C the relative proportions of individual T cell subsets were determined by flow cytometry.

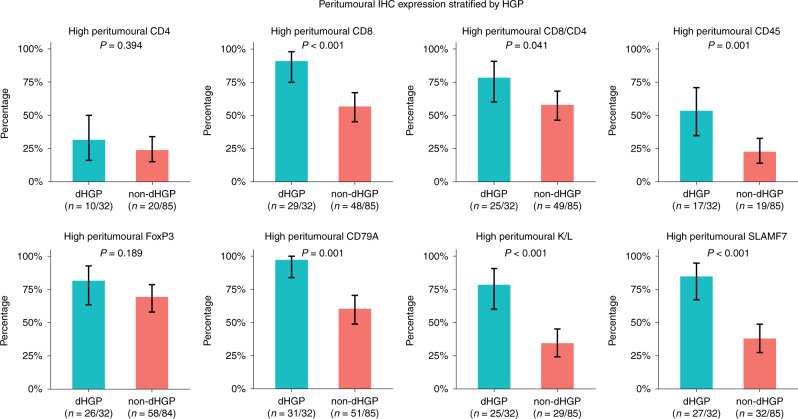
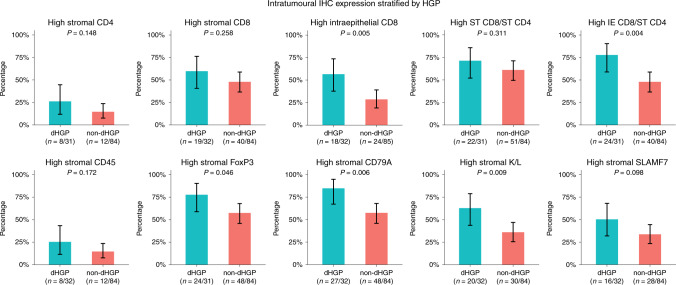
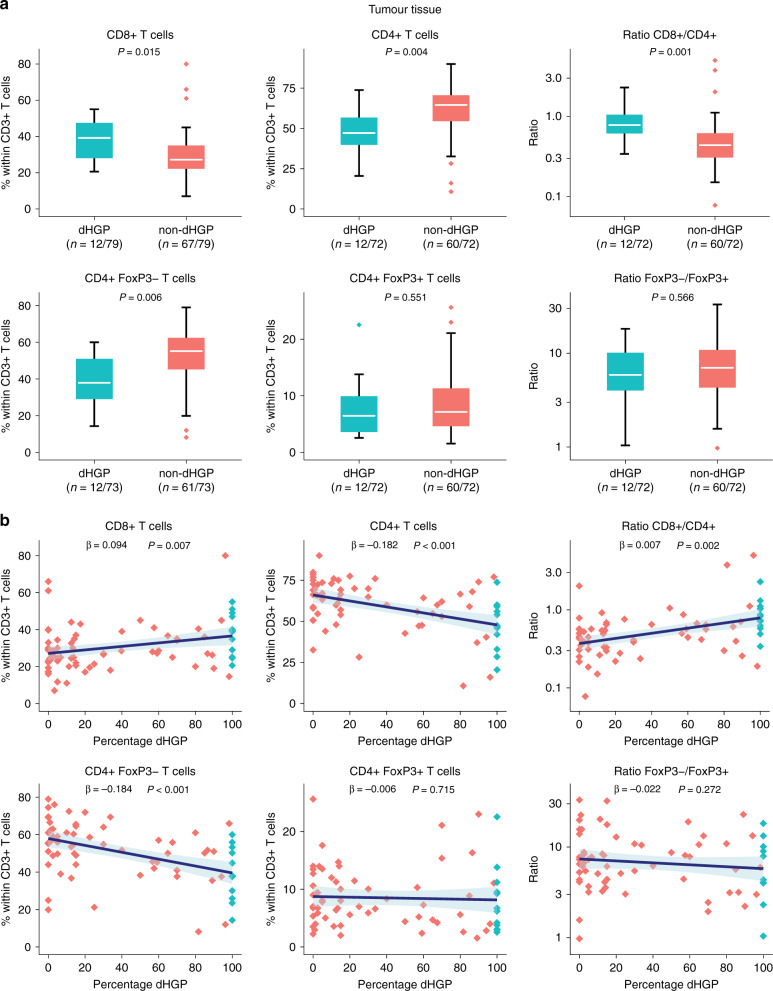
Results: One hundred and seventeen, 34, and 79 patients were included in cohorts A, B, and C, with dHGP being observed in 27%, 29%, and 15% of patients, respectively. Cohorts A and B independently demonstrated peritumoural and intratumoural enrichment of cytotoxic CD8+ T cells in dHGP, as well as a higher CD8+/CD4+ ratio (cohort A). Flow cytometric analysis of fresh tumour tissues in cohort C confirmed these results; dHGP was associated with higher CD8+ and lower CD4+ T cell subsets, resulting in a higher CD8+/CD4+ ratio.

Conclusion: The tumour microenvironment of patients with dHGP is characterised by an increased and distinctly cytotoxic immune infiltrate, providing a potential explanation for their superior survival.


Conflict of interest statement

The authors declare no competing interests.

Figures

Fig. 1
Fig. 1. The histopathological growth patterns (HGP) of colorectal liver metastasis on haematoxylin and eosin-stained tissue sections.
a The replacement HGP (rHGP), b the pushing HGP (pHGP), and c the desmoplastic HGP (dHGP).
Fig. 2
Fig. 2. Results of semi-quantitative immunohistochemistry (IHC) in cohort A: bar charts representing the proportion of patients with high peritumoural expression of individual markers stratified by histopathological growth pattern (HGP).
The black lines represent the binomial 95% confidence interval (Clopper–Pearson). K/L Kappa/Lambda.
Fig. 3
Fig. 3. Results of semi-quantitative immunohistochemistry (IHC) in cohort A: bar charts representing the proportion of patients with high intratumoural expression of individual markers stratified by histopathological growth pattern (HGP).
The black lines represent the binomial 95% confidence interval (Clopper–Pearson). ST stromal, IE intraepithelial, K/L Kappa/Lambda.
Fig. 4
Fig. 4. Results of quantitative immunohistochemistry in cohort B.
a Box and whisker plots of intratumoural and peritumoural counts/mm2 stratified by histopathological growth pattern (HGP) and displayed on a logarithmic scale. The white line represents the median, the box represents the interquartile range (IQR), and the whisker represents the range. Outliers are defined according to the 1.5 rule (i.e. outside [Q1 − 1.5 × IQR; Q3 + 1.5 × IQR]). b Linear regression models of intratumoural and peritumoural counts/mm2 (y-axis, logarithmic scale) and the percentage of the desmoplastic-type histopathological growth pattern (dHGP) scored at the tumour–liver interface (x-axis). The blue line represents the regression coefficient; the light blue ribbon represents the corresponding 95% confidence interval. Measurements of individual patients are displayed using dots. Red dots represent patients with non-dHGP (i.e. <100% dHGP), and blue dots represent patients with dHGP (i.e. 100% dHGP).
Fig. 5
Fig. 5. Results of flow cytometry of fresh tumour samples in cohort C.
a Box and whisker plots of the relative proportion of individual T cell subsets stratified by histopathological growth pattern (HGP). Ratios are displayed on a logarithmic scale. The white line represents the median, the box represents the interquartile range (IQR), and the whisker represents the range. Outliers are defined according to the 1.5 rule (i.e. outside [Q1 − 1.5 × IQR; Q3 + 1.5 × IQR]). b Linear regression models of the relative proportion of individual T cell subsets (y-axis) and the percentage of the desmoplastic-type histopathological growth pattern (dHGP) scored at the tumour–liver interface (x-axis). Ratios are displayed on a logarithmic scale. The blue line represents the regression coefficient; the light blue ribbon represents the corresponding 95% confidence interval. Measurements of individual patients are displayed using dots. Red dots represent patients with non-dHGP (i.e. <100% dHGP), and blue dots represent patients with dHGP (i.e. 100% dHGP).
Fig. 6
Fig. 6. Kaplan–Meier overall survival estimates stratified by histopathological growth pattern (HGP) in all the three cohorts combined.
The numbers at risk are displayed in the table below. p Value represents overall log-rank test.

References

    1. Brenner H, Kloor M, Pox CP. Colorectal cancer. Lancet. 2014;383:1490–1502. - PubMed
    1. Hackl C, Neumann P, Gerken M, Loss M, Klinkhammer-Schalke M, Schlitt HJ. Treatment of colorectal liver metastases in Germany: a ten-year population-based analysis of 5772 cases of primary colorectal adenocarcinoma. BMC Cancer. 2014;14:810. - PMC - PubMed
    1. Engstrand J, Nilsson H, Stromberg C, Jonas E, Freedman J. Colorectal cancer liver metastases - a population-based study on incidence, management and survival. BMC Cancer. 2018;18:78. - PMC - PubMed
    1. van der Geest LG, Lam-Boer J, Koopman M, Verhoef C, Elferink MA, de Wilt JH. Nationwide trends in incidence, treatment and survival of colorectal cancer patients with synchronous metastases. Clin. Exp. Metastasis. 2015;32:457–465. - PubMed
    1. Elferink MA, de Jong KP, Klaase JM, Siemerink EJ, de Wilt JH. Metachronous metastases from colorectal cancer: a population-based study in North-East Netherlands. Int. J. Colorectal Dis. 2015;30:205–212. - PubMed

Publication types

MeSH terms

Substances