

Dynamic prediction of competing risk events using landmark sub-distribution hazard model with multiple longitudinal biomarkers
- PMID: 32419611
- PMCID: PMC10469606
- DOI: 10.1177/0962280220921553
Dynamic prediction of competing risk events using landmark sub-distribution hazard model with multiple longitudinal biomarkers
Abstract
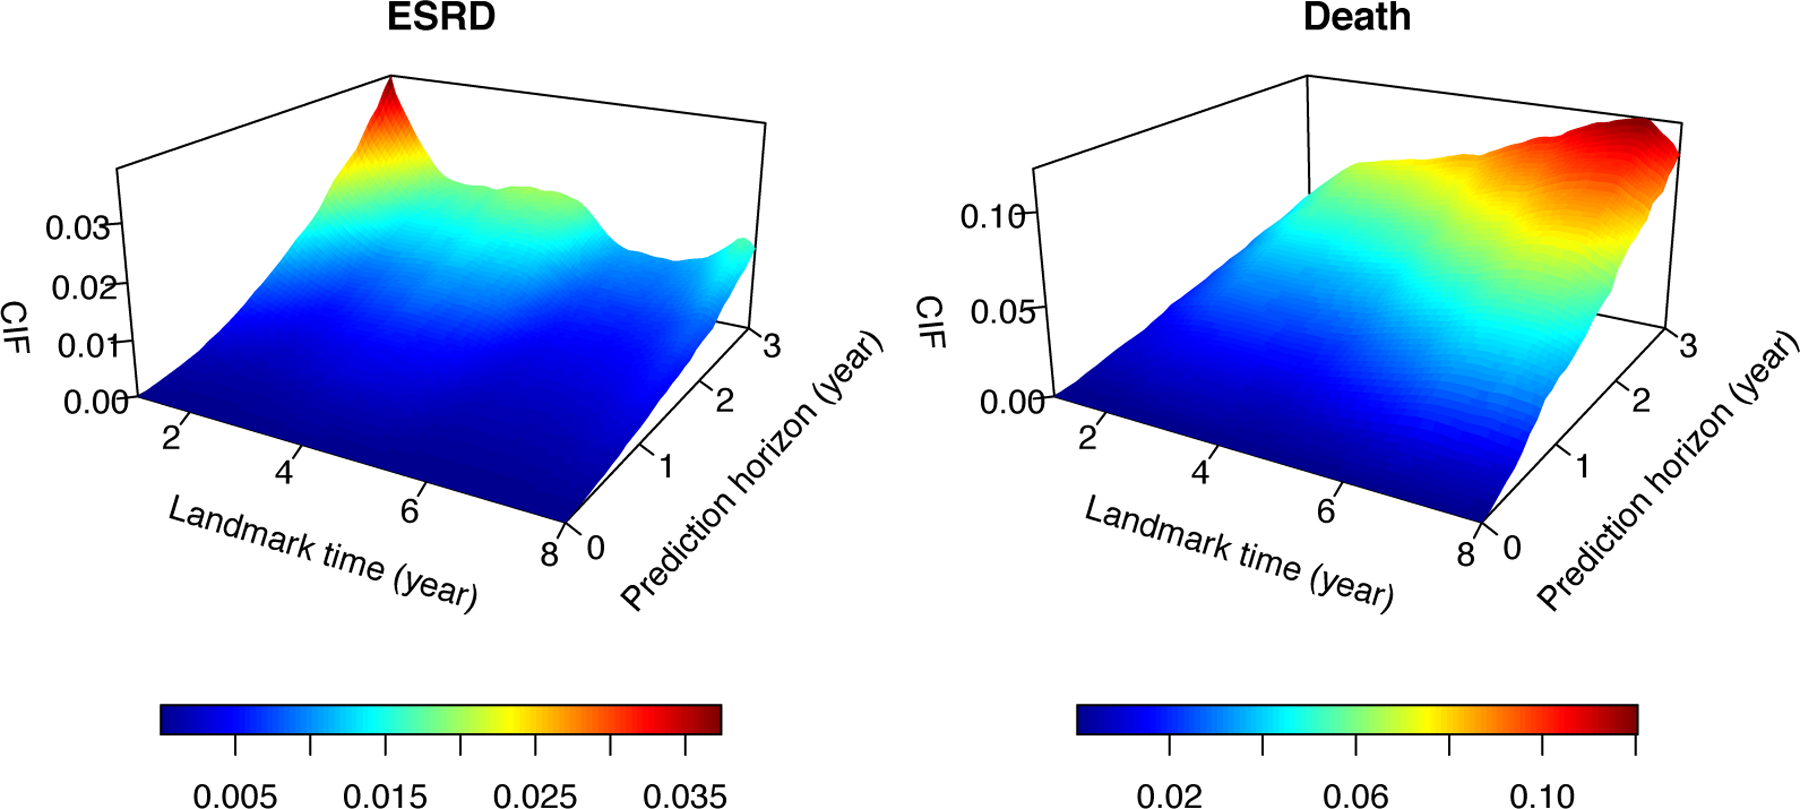
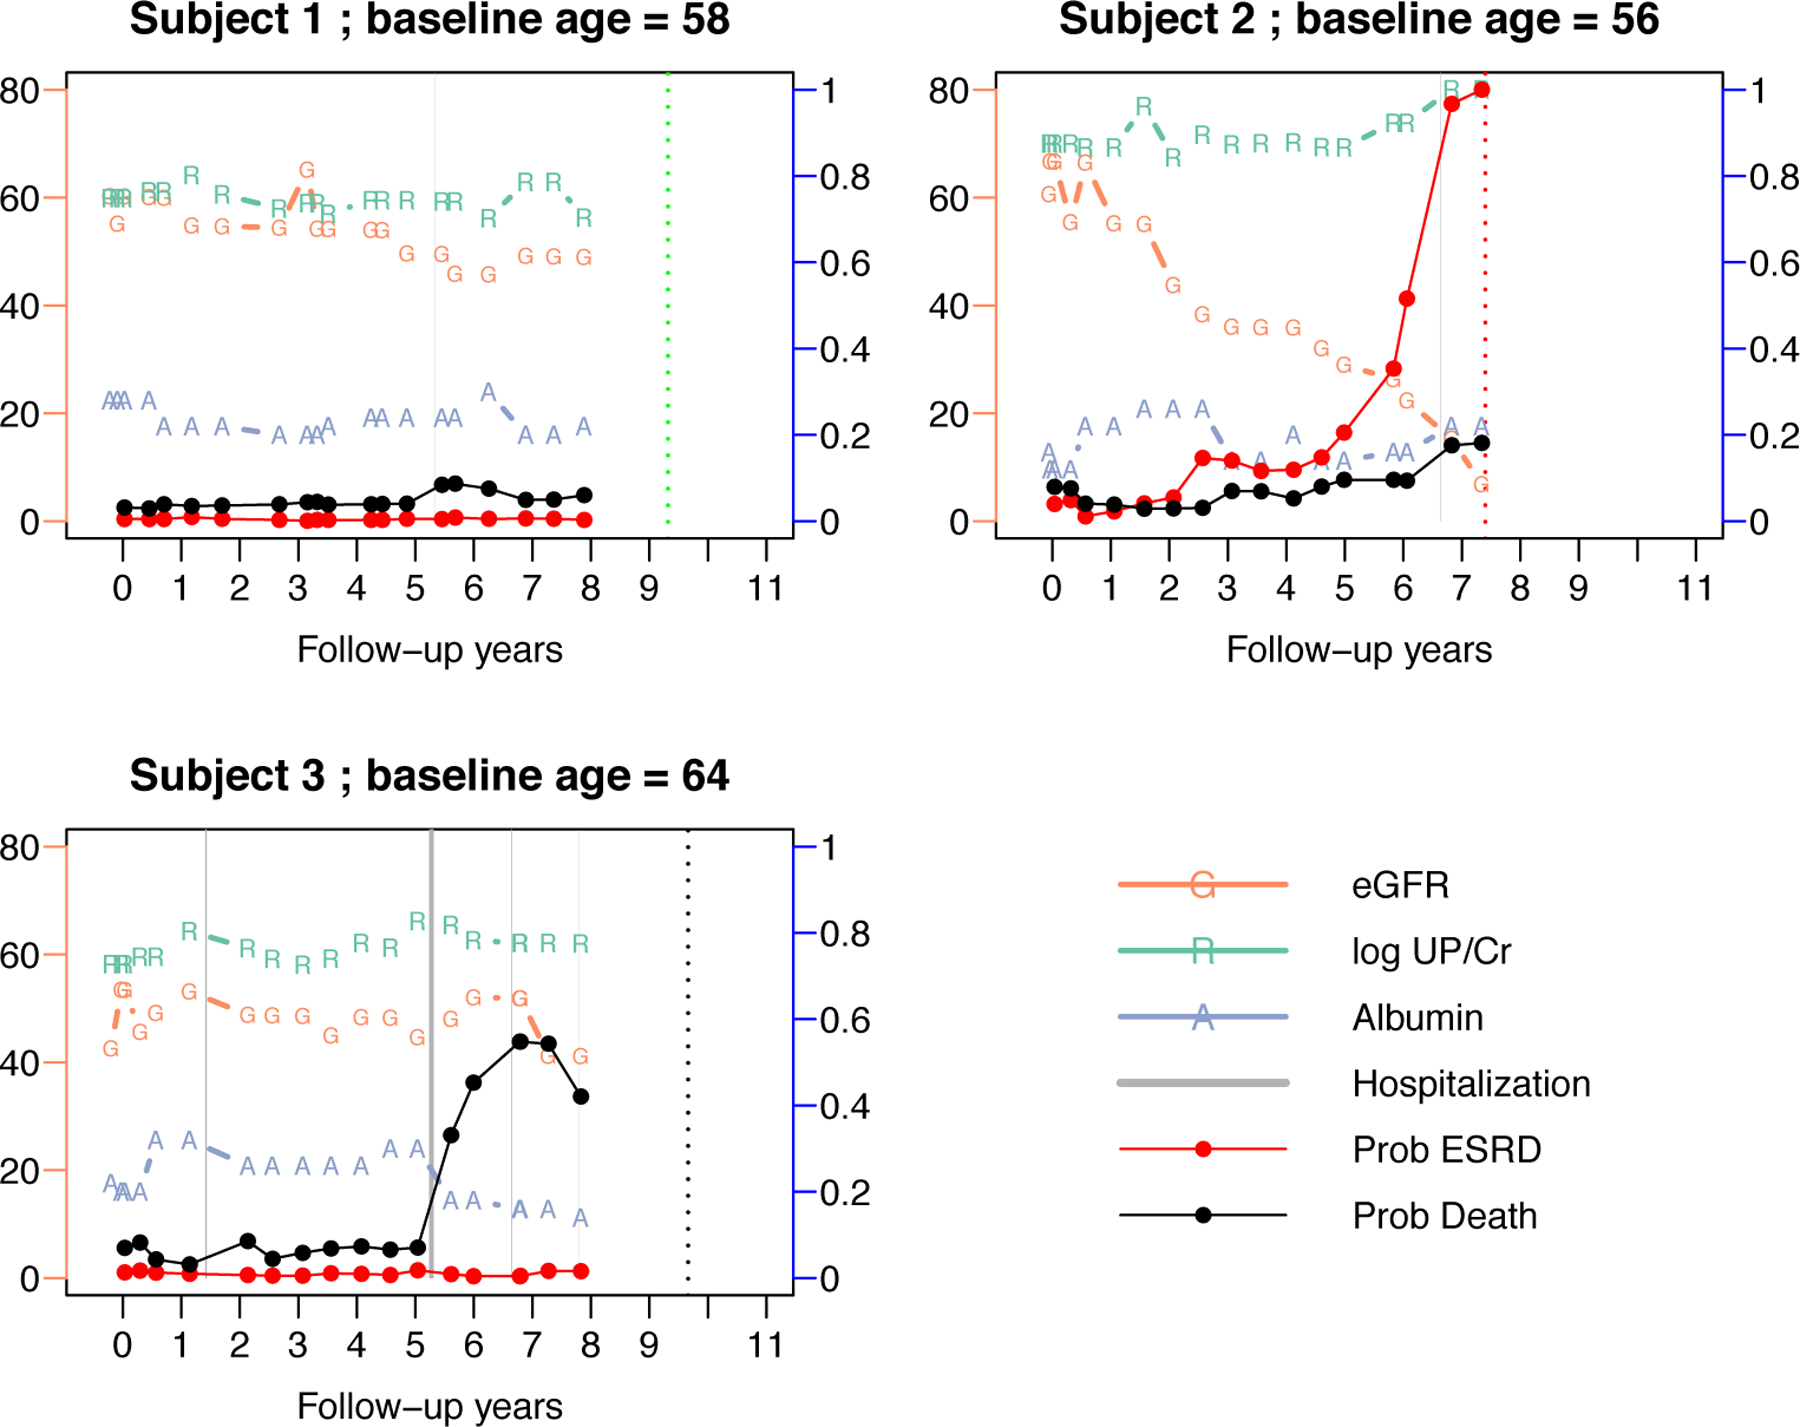
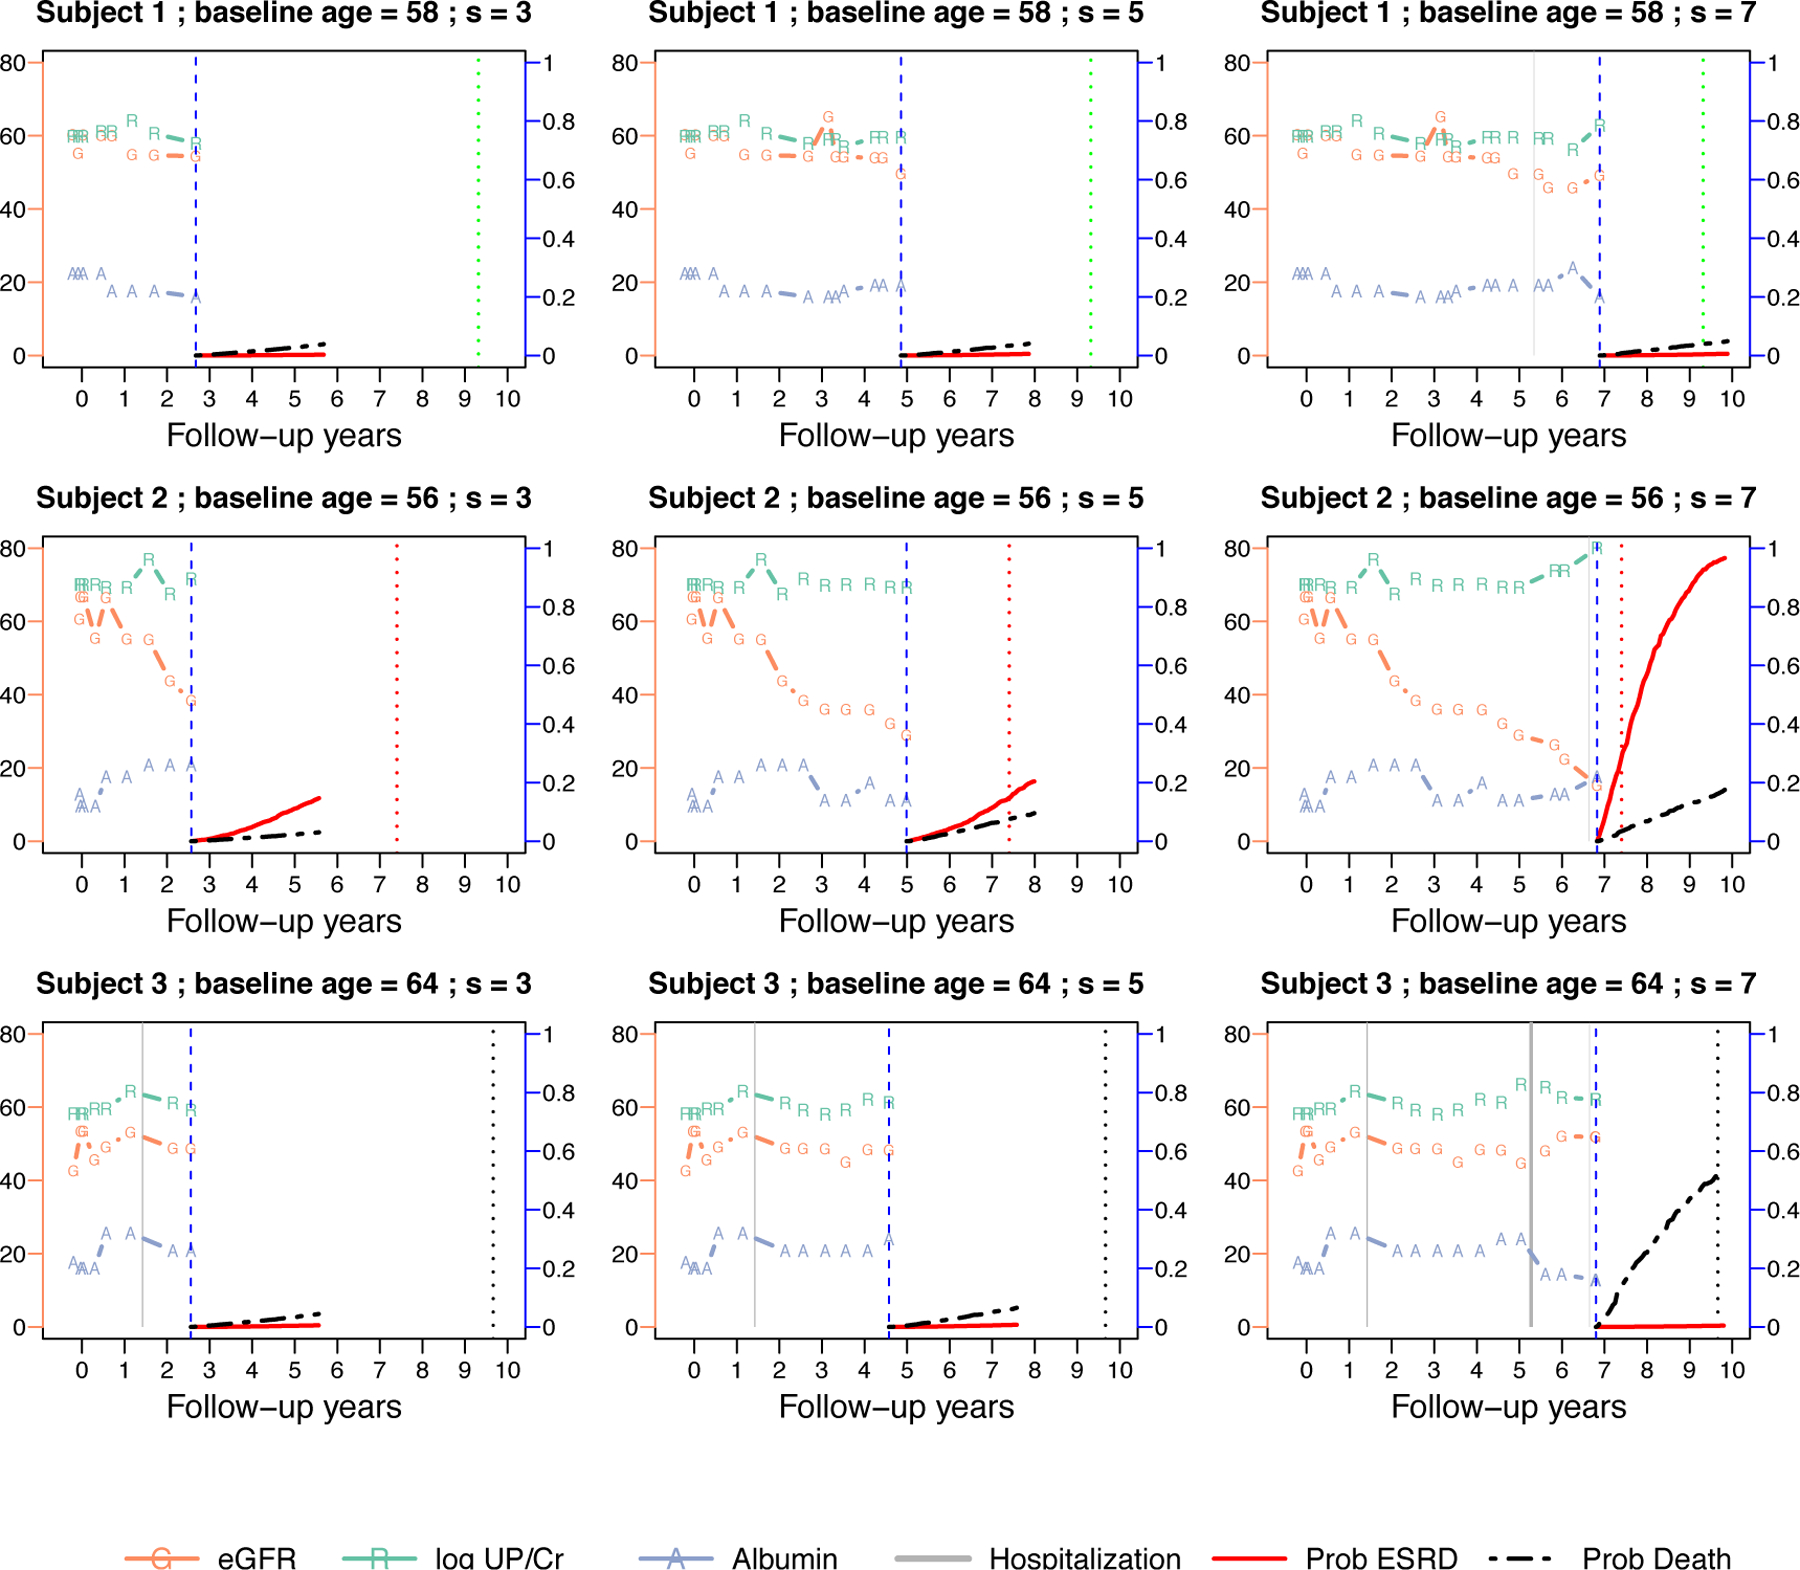
The cause-specific cumulative incidence function quantifies the subject-specific disease risk with competing risk outcome. With longitudinally collected biomarker data, it is of interest to dynamically update the predicted cumulative incidence function by incorporating the most recent biomarker as well as the cumulating longitudinal history. Motivated by a longitudinal cohort study of chronic kidney disease, we propose a framework for dynamic prediction of end stage renal disease using multivariate longitudinal biomarkers, accounting for the competing risk of death. The proposed framework extends the local estimation-based landmark survival modeling to competing risks data, and implies that a distinct sub-distribution hazard regression model is defined at each biomarker measurement time. The model parameters, prediction horizon, longitudinal history and at-risk population are allowed to vary over the landmark time. When the measurement times of biomarkers are irregularly spaced, the predictor variable may not be observed at the time of prediction. Local polynomial is used to estimate the model parameters without explicitly imputing the predictor or modeling its longitudinal trajectory. The proposed model leads to simple interpretation of the regression coefficients and closed-form calculation of the predicted cumulative incidence function. The estimation and prediction can be implemented through standard statistical software with tractable computation. We conducted simulations to evaluate the performance of the estimation procedure and predictive accuracy. The methodology is illustrated with data from the African American Study of Kidney Disease and Hypertension.
Keywords: Competing risks; Fine-Gray model; dynamic prediction; landmark analysis; longitudinal biomarkers; prediction model.
Figures
References
-
- Tangri N, Stevens LA, Griffith J et al. A predictive model for progression of chronic kidney disease to kidney failure. Journal of the American Medical Association 2011; 305(15): 1553–1559. - PubMed
-
- Greene T and Li L. From static to dynamic risk prediction: time is everything. American Journal of Kidney Diseases 2017; 69(4): 492–494. - PubMed
-
- van Houwelingen HC and Putter H. Dynamic Prediction in Clinical Survival Analysis. Chapman & Hall/CRC Press, 2011.
-
- Van Houwelingen HC. Dynamic prediction by landmarking in event history analysis. Scandinavian Journal of Statistics 2007; 34(1): 70–85.
Publication types
MeSH terms
Substances
Grants and funding
LinkOut - more resources
Full Text Sources
