

Assessing differential impacts of COVID-19 on black communities
- PMID: 32419766
- PMCID: PMC7224670
- DOI: 10.1016/j.annepidem.2020.05.003
Assessing differential impacts of COVID-19 on black communities
Abstract
Purpose: Given incomplete data reporting by race, we used data on COVID-19 cases and deaths in U.S. counties to describe racial disparities in COVID-19 disease and death and associated determinants.
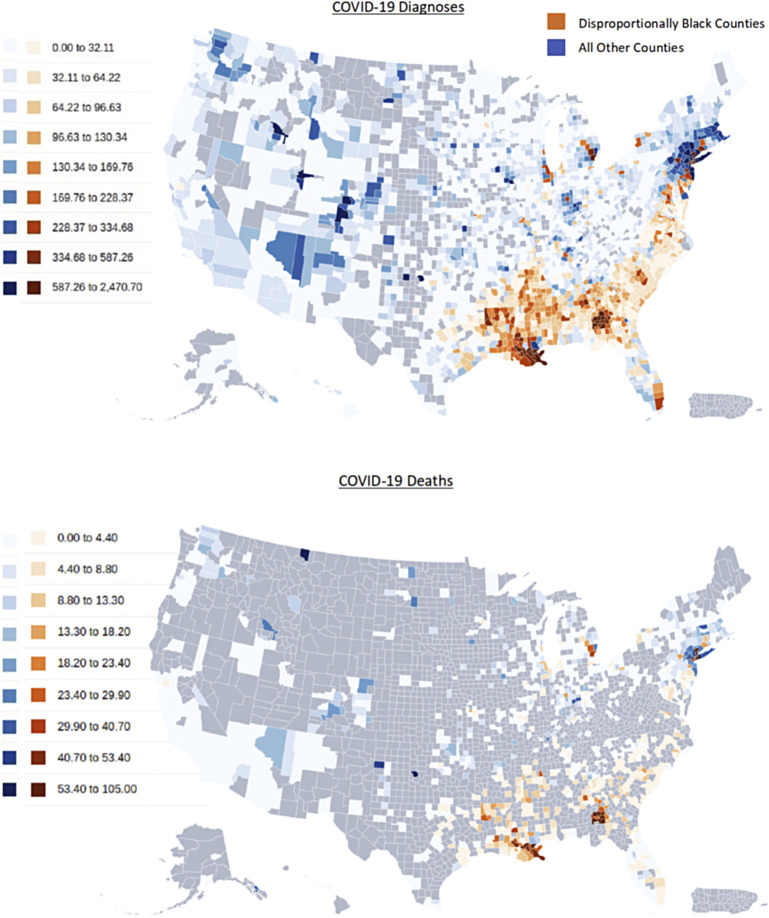
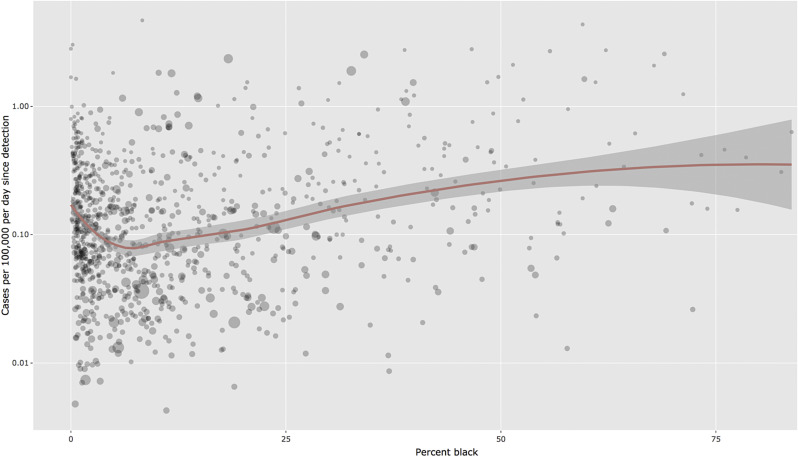
Methods: Using publicly available data (accessed April 13, 2020), predictors of COVID-19 cases and deaths were compared between disproportionately (≥13%) black and all other (<13% black) counties. Rate ratios were calculated, and population attributable fractions were estimated using COVID-19 cases and deaths via zero-inflated negative binomial regression model. National maps with county-level data and an interactive scatterplot of COVID-19 cases were generated.
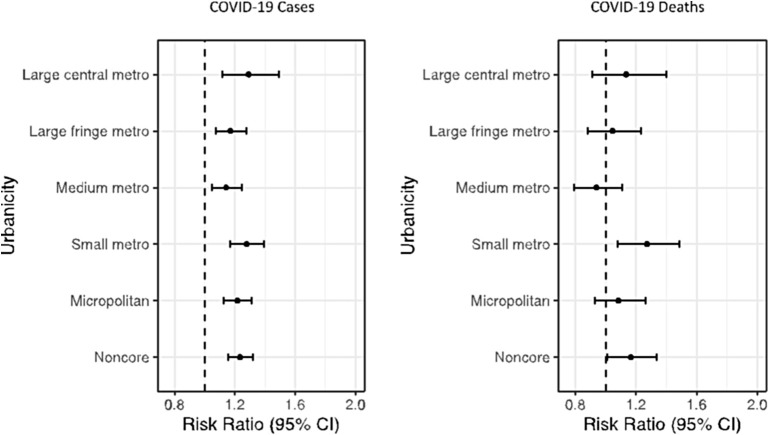
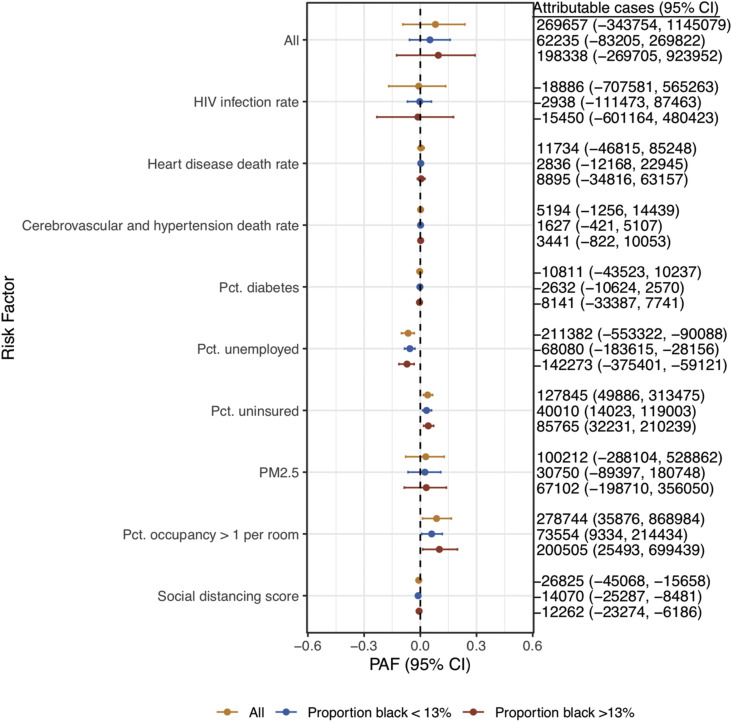
Results: Nearly 90% of disproportionately black counties (656/677) reported a case and 49% (330/677) reported a death versus 81% (1987/2465) and 28% (684/2465), respectively, for all other counties. Counties with higher proportions of black people have higher prevalence of comorbidities and greater air pollution. Counties with higher proportions of black residents had more COVID-19 diagnoses (Rate Ratio (RR): 1.24, 95% confidence interval: 1.17-1.33) and deaths (RR: 1.18, 95% confidence interval: 1.00-1.40), after adjusting for county-level characteristics such as age, poverty, comorbidities, and epidemic duration. COVID-19 deaths were higher in disproportionally black rural and small metro counties. The population attributable fraction of COVID-19 diagnosis due to lack of health insurance was 3.3% for counties with less than 13% black residents and 4.2% for counties with greater than or equal to 13% black residents.
Conclusions: Nearly 20% of U.S. counties are disproportionately black, and they accounted for 52% of COVID-19 diagnoses and 58% of COVID-19 deaths nationally. County-level comparisons can both inform COVID-19 responses and identify epidemic hot spots. Social conditions, structural racism, and other factors elevate risk for COVID-19 diagnoses and deaths in black communities.
Keywords: African-American; Black; COVID-19; Disparity; Race.
© 2020 The Author(s).
Figures
References
-
- Johns Hopkins University COVID-19 Dashboard. Center for Systems Science and Engineering (CSSE). Johns Hopkins University. 2020. https://coronavirus.jhu.edu/map.html
-
- Virginia Department of Health COVID-19 in Virginia. 2020. http://www.vdh.virginia.gov/coronavirus
-
- Mississippi State Department of Health Coronavirus Disease 2019 (COVID-19) 2020. https://msdh.ms.gov/msdhsite/_static/14,0,420.html
-
- Illinois Department of Public Health COVID-19 statistics, 2020. 2020. https://www.dph.illinois.gov/covid19/covid19-statistics
-
- New York State Department of Health COVID-19: fatalities. 2020. https://covid19tracker.health.ny.gov/views/NYS-COVID19-Tracker/NYSDOHCOV...
MeSH terms
LinkOut - more resources
Full Text Sources
Medical
Miscellaneous
