. 2020 Mar 4;4(5):99-113.
doi: 10.15698/cst2020.05.220.

HIF1α-dependent mitophagy facilitates cardiomyoblast differentiation

Affiliations

HIF1α-dependent mitophagy facilitates cardiomyoblast differentiation

Jin-Feng Zhao et al. Cell Stress. .

Abstract

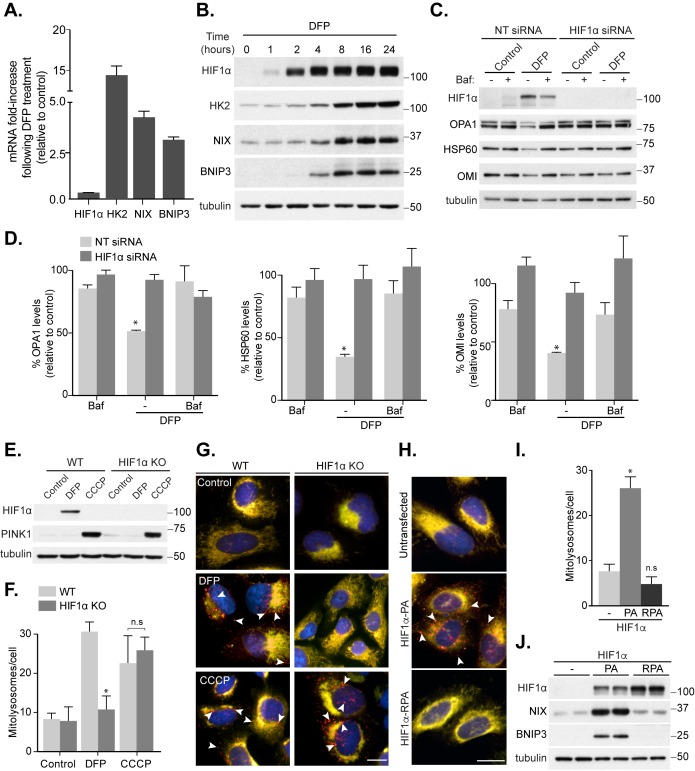
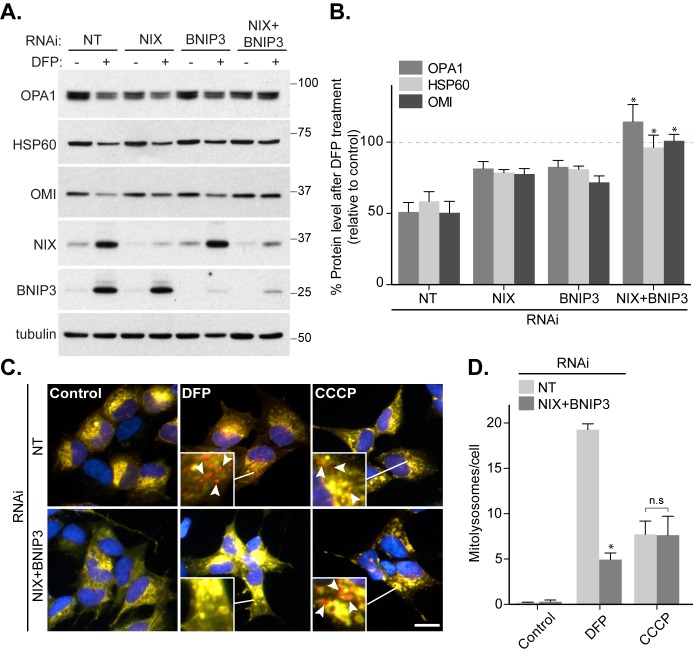
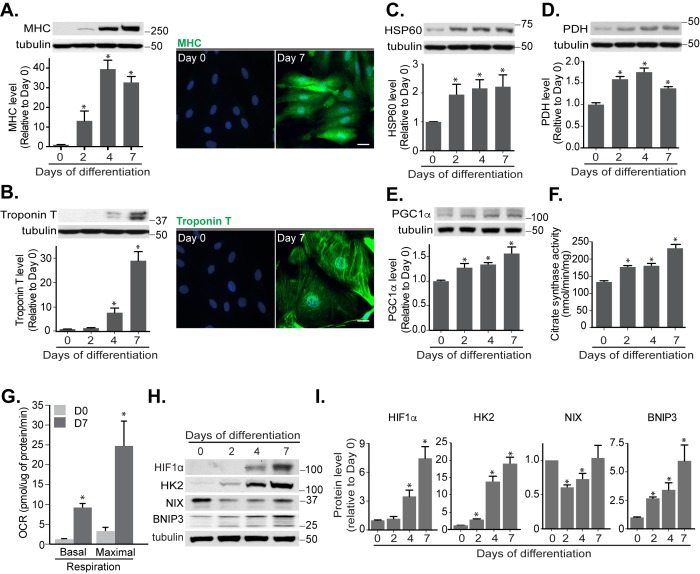
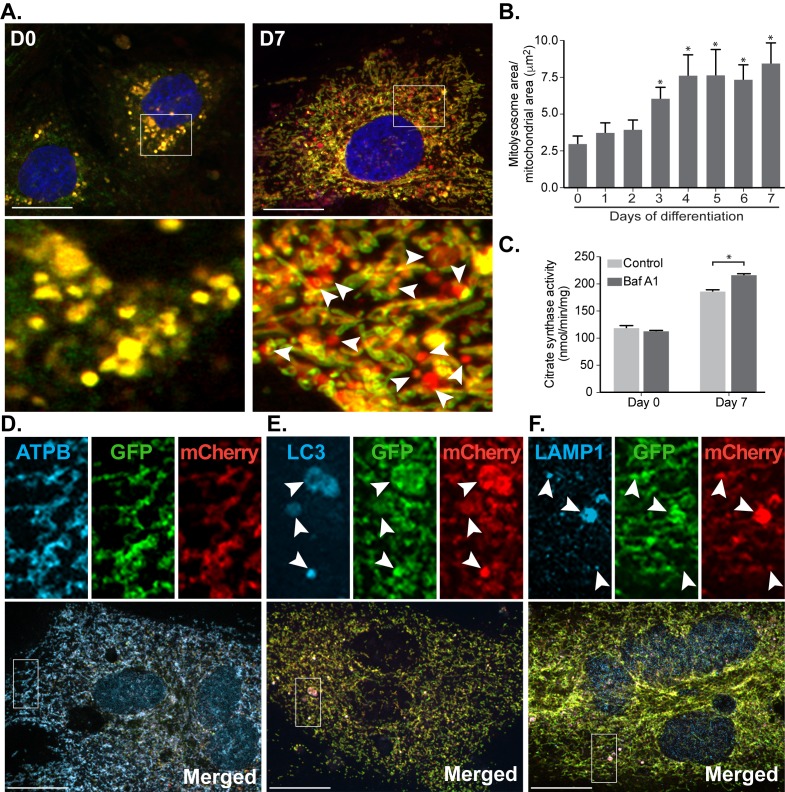
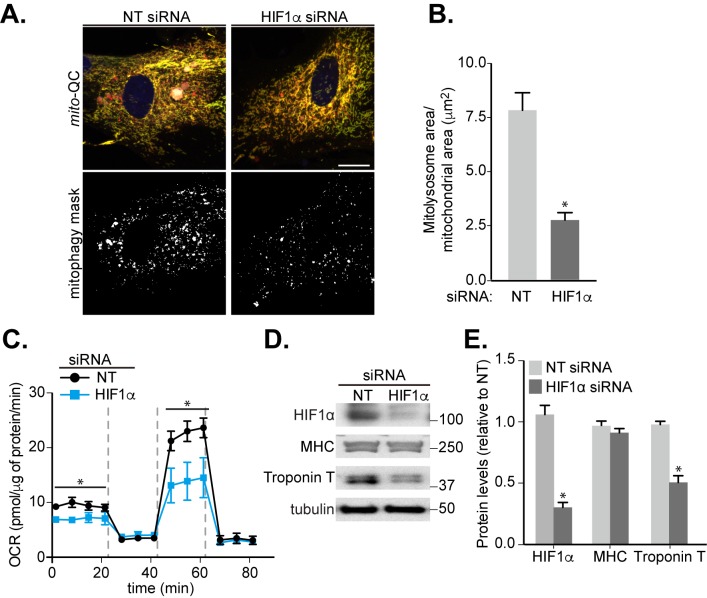
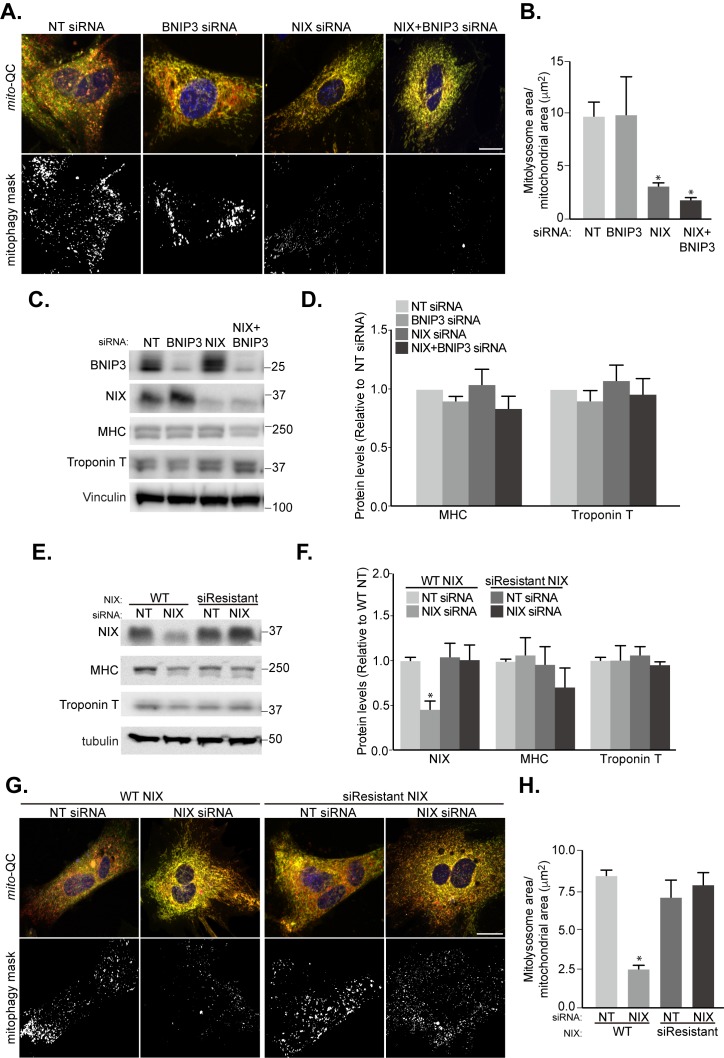
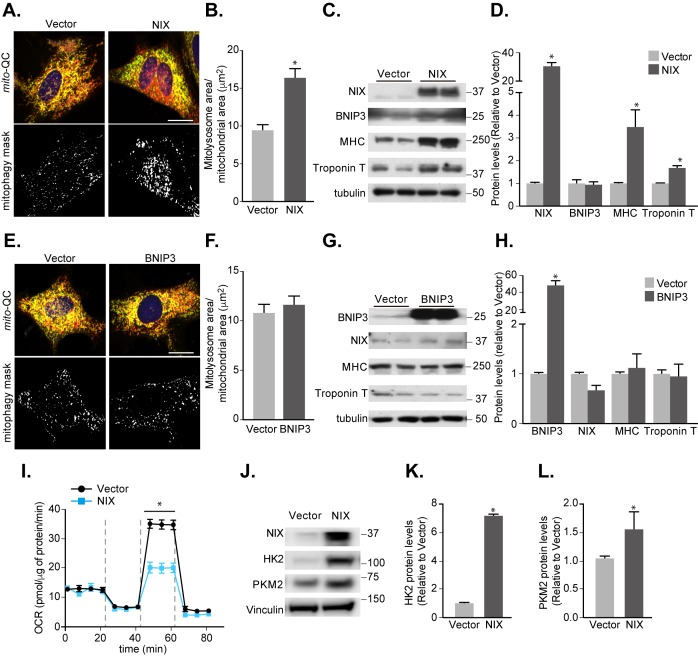
Mitophagy is thought to play a key role in eliminating damaged mitochondria, with diseases such as cancer and neurodegeneration exhibiting defects in this process. Mitophagy is also involved in cell differentiation and maturation, potentially through modulating mitochondrial metabolic reprogramming. Here we examined mitophagy that is induced upon iron chelation and found that the transcriptional activity of HIF1α, in part through upregulation of BNIP3 and NIX, is an essential mediator of this pathway in SH-SY5Y cells. In contrast, HIF1α is dispensable for mitophagy occurring upon mitochondrial depolarisation. To examine the role of this pathway in a metabolic reprogramming and differentiation context, we utilised the H9c2 cell line model of cardiomyocyte maturation. During differentiation of these cardiomyoblasts, mitophagy increased and required HIF1α-dependent upregulation of NIX. Though HIF1α was essential for expression of key cardiomyocyte markers, mitophagy was not directly required. However, enhancing mitophagy through NIX overexpression, accelerated marker gene expression. Taken together, our findings provide a molecular link between mitophagy signalling and cardiomyocyte differentiation and suggest that although mitophagy may not be essential per se, it plays a critical role in maintaining mitochondrial integrity during this energy demanding process.

Keywords: BNIP3; HIF1α; NIX; cardiomyocyte; differentiation; iron chelation; mitophagy.


Conflict of interest statement

Conflict of interest: The authors declare they have no conflict of interest.

Figures

Figure 1
Figure 1. FIGURE 1: HIF1α is essential for mitophagy induced by loss of iron.
SH-SY5Y cells were treated with 1 mM DFP for 24 h (A) or the indicated length of time (B) prior to lysis. (C) SH-SY5Y cells were transfected with non-targeting (NT) siRNA or siRNA targeting HIF1α. After 48 h of knockdown, cells were treated with 1 mM DFP for an additional 24 h with/without the addition of 50 nM bafilomycin A1 (Baf A1) for the final 16 h of treatment. (D) Quantitation from (C) of mitochondrial proteins relative to control condition. Mitophagy reporter (mito-QC) WT or HIF1α KO U2OS cells were treated with 1 mM DFP or 20 μM CCCP for 24 h prior to lysis (E) or fixation (F-G). (F) Quantitation from (G) of mean mitolysosome (red-only) puncta per cell as indicated. (H) Representative images from mito-QC U2OS cells in combination with either Flag-HIF1α P402A/P564A (PA) or Flag- HIF1α P402A/P564A/R27G (RPA). (I) Quantitation from (H) of mean mitolysosome puncta per cell as indicated. (J) Control U2OS cells or U2OS cells stably expressing either Flag-HIF1α-PA or Flag-HIF1α-RPA were lysed and subject to immunoblot analysis. All quantitative data are mean ± SEM from 3 independent experiments. Arrows highlight mitolysosomes. Scale bar, 10 μm. * P < 0.05, n.s, not significant.
Figure 2
Figure 2. FIGURE 2: NIX and BNIP3 redundancy in DFP-induced mitophagy.
(A) Control SH-SY5Y cells or SH-SY5Y cells stably expressing BNIP3 shRNA were either transfected with non-targeting (NT) siRNA or NIX siRNA. 48 h post-transfection cells were treated with 1 mM DFP for a further 24 h. (B) Quantitation from (A) of OPA1, HSP60 and OMI levels relative to control condition. Dotted line represents control value (100%). (C) Control SH-SY5Y cells were transfected with NT siRNA and SH-SY5Y cells stably expressing BNIP3 shRNA were transfected with an equal amount of NIX siRNA. Cells were treated with 1 mM DFP or 20 μM CCCP for 24 h. Arrows highlight examples of mitolysosomes. Scale bar, 10 μm. (D) Quantitation from (C) of mitolysosomes per cell as indicated. All quantitative data are mean ± SEM from 3 independent experiments. * P < 0.05, n.s, not significant.
Figure 3
Figure 3. FIGURE 3: Mitochondrial functions increase during cardiomyoblast differentiation.
Protein levels and immunofluorescence staining of myosin heavy chain (MHC) (A) and cardiac Troponin T (B) were performed in H9c2 cells following differentiation for 0, 2, 4 and 7 days. HSP60 (C), PDH (D), PGC1α (E) protein levels and citrate synthase activity (F) were determined during this period. (G) Oxygen consumption rate (OCR) was measured in H9c2 cells following 7 days differentiation. (H-I) HIF1α, Hexokinase 2 (HK2), NIX and BNIP3 protein levels were examined and quantified in H9c2 cells during the indicated days of differentiation. α-tubulin was used as a loading control. All quantitative data are mean ± SEM from 3 independent experiments. Scale bar, 20 μm. * P < 0.05.
Figure 4
Figure 4. FIGURE 4: Mitophagy increases progressively during cardiomyocyte differentiation.
(A) Representative images from mito-QC reporter H9c2 cells during differentiation. (B) Quantitation of total mitolysosome area per mitochondrial content was analysed during cardiomyocyte differentiation. (C) H9c2 cells were cultured in differentiation medium for 7 days and 50 nM Baf A1 was added into medium for the last 16 h prior to lysis. Immunostaining of beta subunit of ATP synthase (ATPB) (D), LC3 (E) and LAMP1 (F) were performed in H9c2 cells differentiated for 7 days prior to fixation. Arrows indicate structures positive for both red-puncta and LC3 or LAMP1. Scale bar, 20 μm. All quantitative data are mean ± SEM from 3 independent experiments. * P < 0.05.
Figure 5
Figure 5. FIGURE 5: Involvement of HIF1α in mitophagy and cardiomyocyte differentiation.
H9c2 cells were cultured in differentiation medium for 7 days. (A) Representative images of mito-QC H9c2 cells transfected with non-targeting (NT) siRNA or HIF1α siRNA at day 4 of differentiation. Mitophagy mask represented as the mCherry/GFP ratio intensity above the mean of mCherry intensity. (B) Quantitation from (A) of total mitolysosome area per mitochondrial content as indicated. (C) OCR was measured following 7 days H9c2 differentiation with cells transfected with NT siRNA or HIF1α siRNA at day 4. 1 μM oligomycin A, 1 μM FCCP and 1/2 μM rotenone/antimycin A were injected at the indicated times to determine the proportion of oxygen consumption due to ATP turnover, maximal rate of respiration and amount of proton leak respectively. (D-E) HIF1α, MHC and cardiac Troponin T protein levels were examined in 7 days-differentiated H9c2 cells transfected with NT or HIF1α siRNA at day 4. α-tubulin was used as a loading control. Scale bar, 20 μm. All quantitative data are mean ± SEM from 3 independent experiments. * P < 0.05.
Figure 6
Figure 6. FIGURE 6: NIX-mediated mitophagy is not essential for cardiomyocyte differentiation.
H9c2 cells were cultured in differentiation medium for 7 days. (A) Representative images of mito-QC H9c2 cells transfected with non-targeting (NT), BNIP3, or NIX siRNA as well as NIX and BNIP3 (NIX/BNIP3) siRNA in combination at day 4 differentiation. Mitophagy mask represented as the mCherry/GFP ratio intensity above the mean of mCherry intensity. (B) Quantitation from (A) of total mitolysosome area per mitochondrial content as indicated. (C-D) BNIP3, NIX, MHC and cardiac Troponin T protein levels were examined after H9c2 cells transfected with NT, BNIP3, NIX or NIX/BNIP3 siRNAs at day 4 differentiation. Vinculin was used as a loading control. (E) H9c2 cells stably expressing WT or siRNA resistant NIX were cultured in differentiation medium for 7 days. NT siRNA or NIX siRNA was applied into medium at day 4 differentiation. NIX, MHC and cardiac Troponin T protein levels were examined after 7 days differentiation. Quantitation from (E) of indicated proteins was shown in (F). α-tubulin was used as a loading control. (G) Representative images of NIX WT or siRNA-resistant cells transfected with NT siRNA or NIX siRNA at day 4. (H) Quantitation from (G) of total mitolysosome area per mitochondrial content as indicated. Scale bar, 20 μm. All quantitative data are mean ± SEM from 3 independent experiments. * P < 0.05.
Figure 7
Figure 7. FIGURE 7: Increasing NIX-dependent mitophagy promotes cardiomyocyte differentiation.
(A) Representative images from mito-QC H9c2 vector control cells or cells overexpressing NIX cultured following 7 days differentiation. Mitophagy mask represented as the mCherry/GFP ratio intensity above the mean of mCherry intensity. (B) Quantitation from (A) of total mitolysosome area per mitochondrial content as indicated. (C) Representative immunoblot of NIX, BNIP3, MHC and cardiac Troponin T protein levels from 7 days differentiated H9c2 cells stably overexpressing NIX. (D) Quantitation of data from (C). (E) Representative images from mito-QC H9c2 cells overexpressing vector or BNIP3 cultured in differentiation medium for 7 days. (F) Quantitation from (E) of total mitolysosome area per mitochondrial content as indicated. (G) Representative immunoblot of NIX, BNIP3, MHC and cardiac Troponin T protein levels from 7 days differentiated H9c2 cells stably overexpressing BNIP3. (H) Quantitation of data from (G). (I) Oxygen consumption rate (OCR) was measured after H9c2 cells stably overexpressing vector or NIX following 7 days differentiation. (J) Immunoblot of HK2 and Pyruvate kinase (PKM2) from H9c2 cells stably overexpressing vector or NIX cultured in differentiation medium for 7 days. Quanitation of HK2 (K) and PKM2 (L) is shown. Scale bar, 20 μm. All quantitative data are mean ± SEM from 3 independent experiments. * P < 0.05.
None

Comment in

References

    1. He C, Klionsky DJ. Regulation mechanisms and signaling pathways of autophagy. Annu Rev Genet. 2009;43:67–93. doi: 10.1146/annurev-genet-102808-114910. - DOI - PMC - PubMed
    1. Noda NN, Inagaki F. Mechanisms of Autophagy. Annu Rev Biophys. 2015;44:101–122. doi: 10.1146/annurev-biophys-060414-034248. - DOI - PubMed
    1. Choi AM, Ryter SW, Levine B. Autophagy in human health and disease. N Engl J Med. 2013;368(7):651–662. doi: 10.1056/NEJMra1205406. - DOI - PubMed
    1. Montava-Garriga L, Ganley IG. Outstanding Questions in Mitophagy: What We Do and Do Not Know. J Mol Biol. 2019;432(1):206–230. doi: 10.1016/j.jmb.2019.06.032. - DOI - PubMed
    1. Rodger CE, McWilliams TG, Ganley IG. Mammalian mitophagy - from in vitro molecules to in vivo models. FEBS J. 2018;285(7):1185–1202. doi: 10.1111/febs.14336. - DOI - PMC - PubMed

LinkOut - more resources