

Temperature and preeclampsia: Epidemiological evidence that perturbation in maternal heat homeostasis affects pregnancy outcome
- PMID: 32421729
- PMCID: PMC7234374
- DOI: 10.1371/journal.pone.0232877
Temperature and preeclampsia: Epidemiological evidence that perturbation in maternal heat homeostasis affects pregnancy outcome
Abstract
Introduction: This study aims to determine the association between temperature and preeclampsia and whether it is affected by seasonality and rural/urban lifestyle.
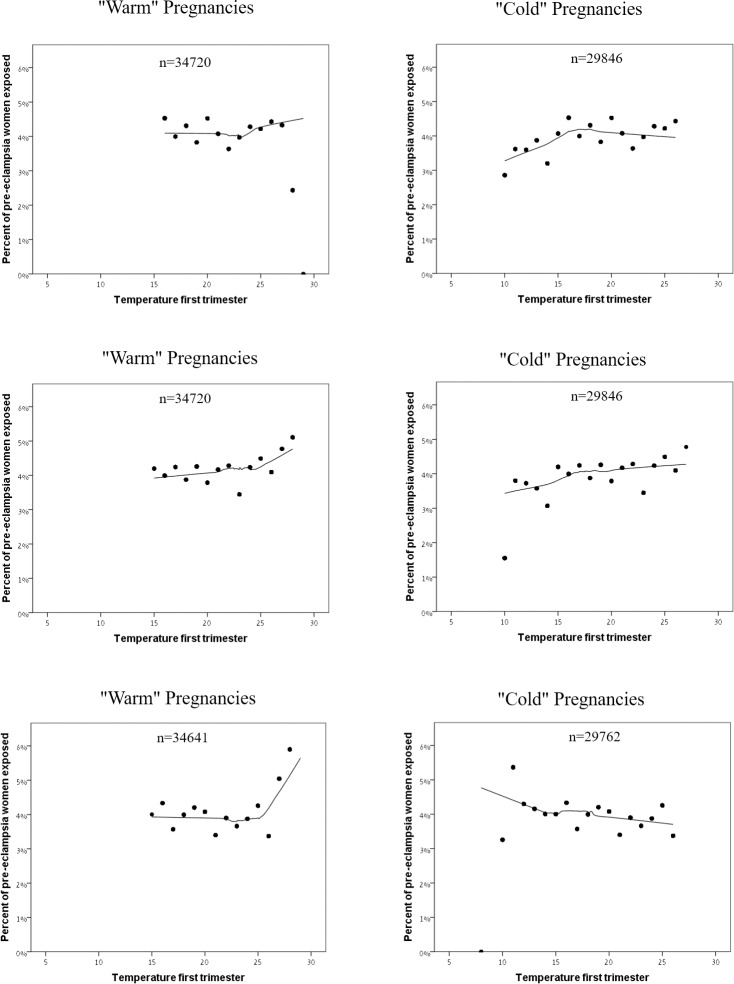
Methods: This cohort study included women who delivered at our medical center from 2004 to 2013 (31,101 women, 64,566 deliveries). Temperature values were obtained from a spatiotemporally resolved estimation model performing predictions at a 1×1km spatial resolution. In "Warm" pregnancies >50% of gestation occurred during the spring-summer period. In cold pregnancies >50% of gestation occurred during the fall and winter. Generalized estimating equation multivariable models were used to estimate the association between temperature and incidence of preeclampsia.
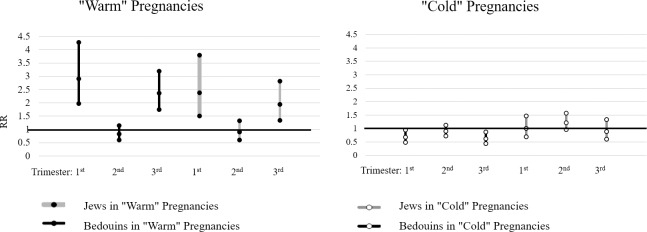
Results: 1) The incidence of preeclampsia in at least one pregnancy was 7% (2173/64,566); 2) during "warm" pregnancies, an elevation of one IQR of the average temperature in the 1st or the 3rd trimesters was associated with an increased risk to develop preeclampsia [patients with Jewish ethnicity: 1st trimester: relative risk (RR) of 2.38(95%CI 1.50; 3.80), 3rd trimester 1.94(95%CI 1.34;2.81); Bedouins: 1st trimester: RR = 2.91(95%CI 1.98;4.28), 3rd trimester: RR = 2.37(95%CI 1.75;3.20)]; 3) In "cold" pregnancies, an elevation of one IQR of average temperature was associated with a lower risk to develop preeclampsia among patients with Bedouin-Arab ethnicity RR = 0.68 (95% CI 0.49-0.94) for 1st trimester and RR = 0.62 (95% CI 0.44-0.87) for 3rd trimester.
Conclusions: 1) Elevated averaged temperature during the 1st or 3rd trimesters in "warm" pregnancies confer an increased risk for the development of preeclampsia, especially in nomadic patients; 2) Of interest, during cold pregnancies, elevated averaged temperature was associated with a lower risk to develop preeclampsia for nomadic patients. 3) These findings suggest temperature might be associated with perturbations in maternal heat homeostasis resulting in reallocation of energy resources and their availability to the fetus that may increase the risk for preeclampsia. This observation is especially relevant in the context of global warming and its effects on maternal/fetal reproductive health.
Conflict of interest statement
The authors have declared that no competing interests exist.
Figures
Similar articles
-
Placental growth factor and soluble fms-like tyrosine kinase-1 are useful markers for the prediction of preeclampsia but not for small for gestational age neonates: a longitudinal study.Eur J Obstet Gynecol Reprod Biol. 2013 Dec;171(2):225-30. doi: 10.1016/j.ejogrb.2013.08.040. Epub 2013 Sep 4. Eur J Obstet Gynecol Reprod Biol. 2013. PMID: 24035323
-
[Cardio-metabolic risk and adverse pregnancy outcomes in the first trimester: findings from the Shenzhen birth cohort study].Zhonghua Xin Xue Guan Bing Za Zhi. 2024 Feb 24;52(2):158-164. doi: 10.3760/cma.j.cn112148-20230816-00086. Zhonghua Xin Xue Guan Bing Za Zhi. 2024. PMID: 38326067 Chinese.
-
Receipt of Proton-Pump Inhibitors during Pregnancy and Risk for Preeclampsia.Am J Perinatol. 2021 Dec;38(14):1519-1525. doi: 10.1055/s-0040-1713864. Epub 2020 Jul 3. Am J Perinatol. 2021. PMID: 32620021
-
First-trimester placental thickness and the risk of preeclampsia or SGA.Placenta. 2017 Sep;57:123-128. doi: 10.1016/j.placenta.2017.06.016. Epub 2017 Jun 17. Placenta. 2017. PMID: 28864000
-
[Pre-eclampsia screening in first and second trimester].Ther Umsch. 2008 Nov;65(11):663-6. doi: 10.1024/0040-5930.65.11.663. Ther Umsch. 2008. PMID: 18979429 Review. German.
Cited by
-
Extreme temperature and out-of-hospital-cardiac-arrest. Nationwide study in a hot climate country.Environ Health. 2021 Apr 5;20(1):38. doi: 10.1186/s12940-021-00722-1. Environ Health. 2021. PMID: 33820550 Free PMC article.
-
Understanding the physiological and biological response to ambient heat exposure in pregnancy: protocol for a systematic review and meta-analysis.BMJ Open. 2024 Jul 5;14(7):e085314. doi: 10.1136/bmjopen-2024-085314. BMJ Open. 2024. PMID: 38969375 Free PMC article.
-
Variability in the Length of Stay and Daily Medical Expenses in Inpatient Care in Korea, 2010-2019: Hypertension and Pneumonia.J Korean Med Sci. 2025 Apr 7;40(13):e120. doi: 10.3346/jkms.2025.40.e120. J Korean Med Sci. 2025. PMID: 40195927 Free PMC article.
-
Ambient temperature-related sex ratio at birth in historical urban populations: the example of the city of Poznań, 1848-1900.Sci Rep. 2024 Jun 18;14(1):14001. doi: 10.1038/s41598-024-64799-7. Sci Rep. 2024. PMID: 38890431 Free PMC article.
-
Identifying the impact and critical windows of extreme temperatures on the risk of gestational diabetes mellitus in twin pregnancies.J Endocrinol Invest. 2025 Jul 31. doi: 10.1007/s40618-025-02632-2. Online ahead of print. J Endocrinol Invest. 2025. PMID: 40742516
References
Publication types
MeSH terms
LinkOut - more resources
Full Text Sources
