. 2020 Jun 19;48(11):5859-5872.
doi: 10.1093/nar/gkaa334.

Transcriptome-wide organization of subcellular microenvironments revealed by ATLAS-Seq

Affiliations

Transcriptome-wide organization of subcellular microenvironments revealed by ATLAS-Seq

Danielle A Adekunle et al. Nucleic Acids Res. .

Abstract

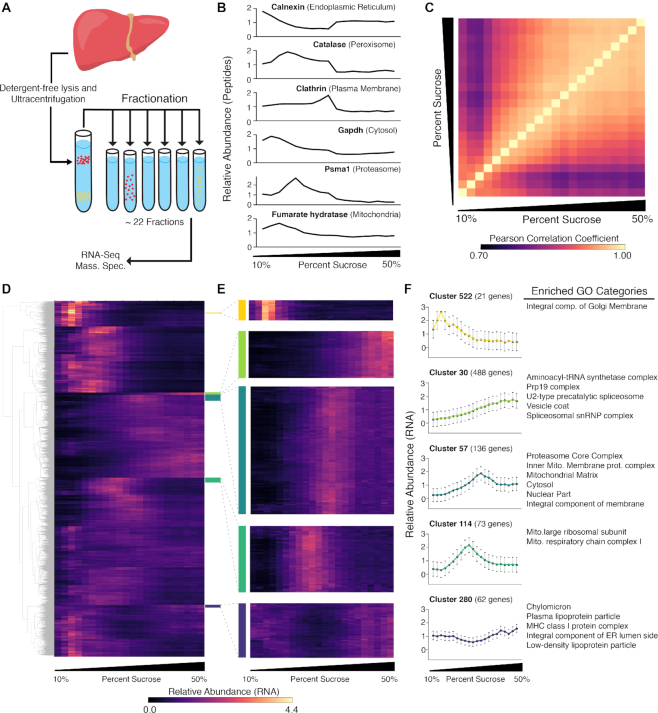
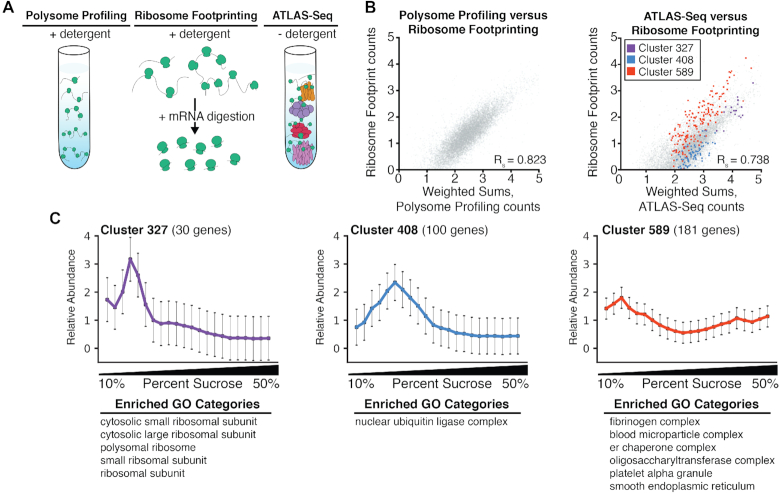
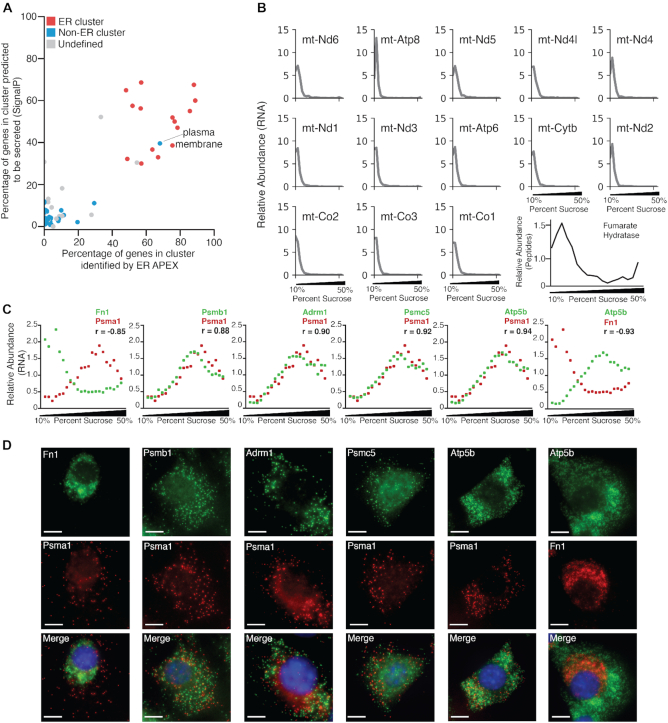
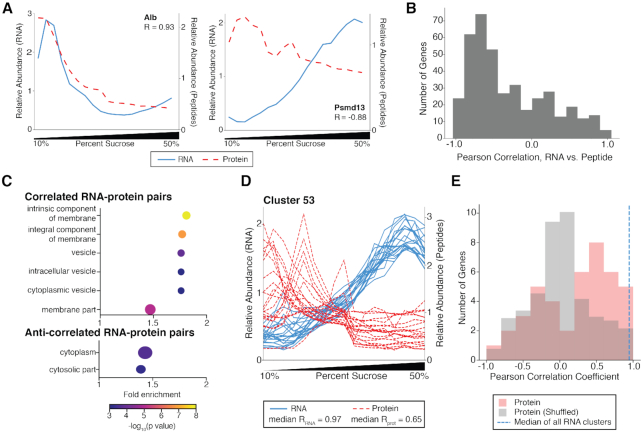
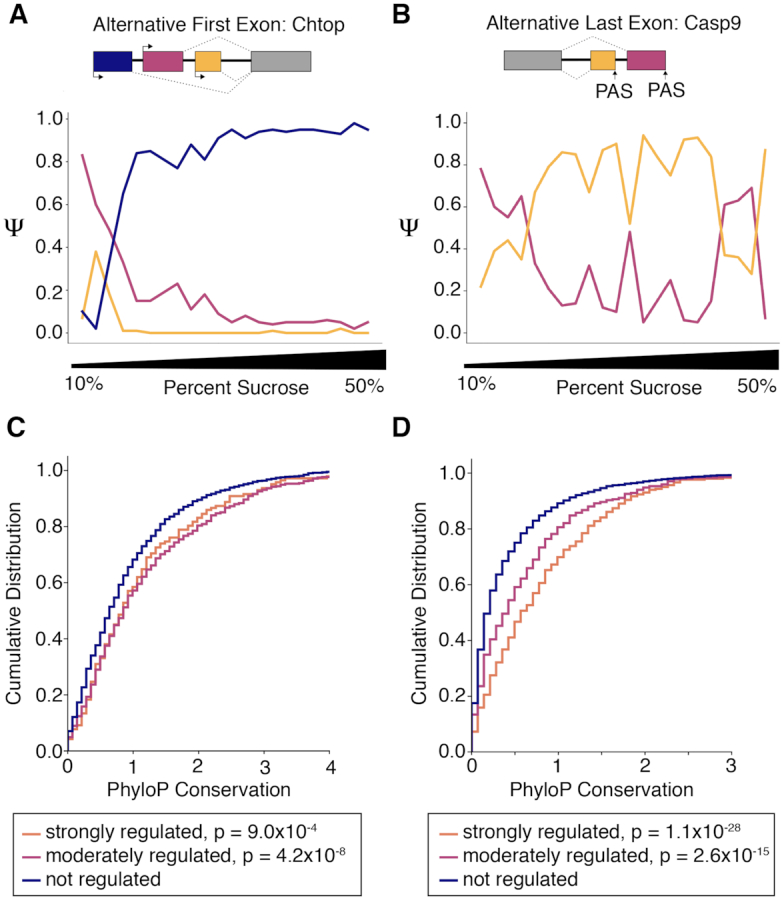
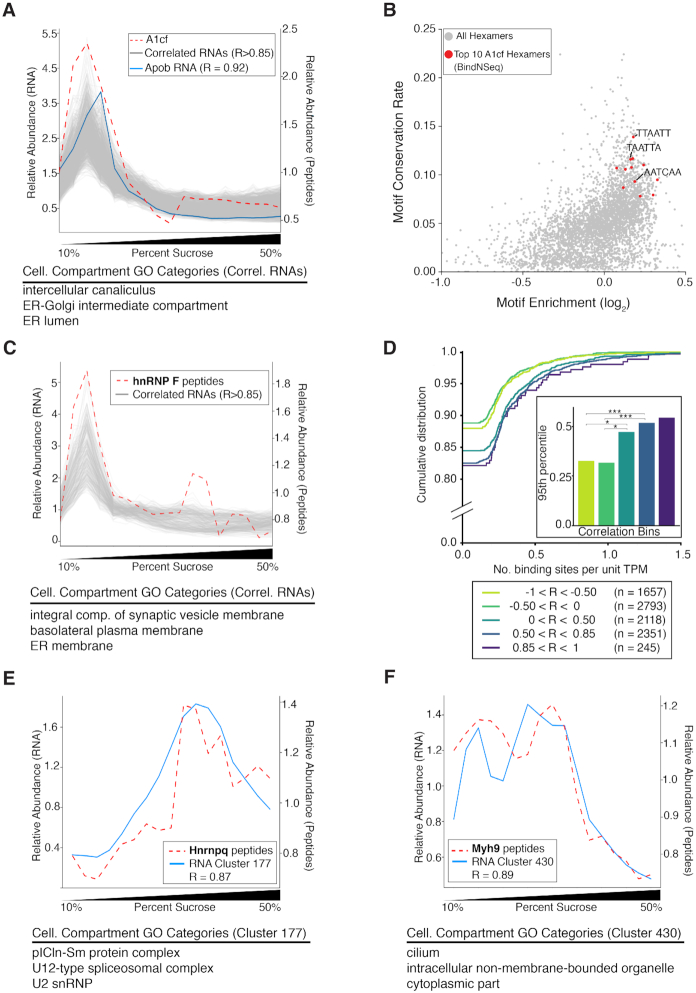
Subcellular organization of RNAs and proteins is critical for cell function, but we still lack global maps and conceptual frameworks for how these molecules are localized in cells and tissues. Here, we introduce ATLAS-Seq, which generates transcriptomes and proteomes from detergent-free tissue lysates fractionated across a sucrose gradient. Proteomic analysis of fractions confirmed separation of subcellular compartments. Unexpectedly, RNAs tended to co-sediment with other RNAs in similar protein complexes, cellular compartments, or with similar biological functions. With the exception of those encoding secreted proteins, most RNAs sedimented differently than their encoded protein counterparts. To identify RNA binding proteins potentially driving these patterns, we correlated their sedimentation profiles to all RNAs, confirming known interactions and predicting new associations. Hundreds of alternative RNA isoforms exhibited distinct sedimentation patterns across the gradient, despite sharing most of their coding sequence. These observations suggest that transcriptomes can be organized into networks of co-segregating mRNAs encoding functionally related proteins and provide insights into the establishment and maintenance of subcellular organization.


Figures

Figure 1.
Figure 1.
ATLAS-Seq generates transcriptome- and proteome-wide profiles across a density centrifugation gradient. (A) Schematic of ATLAS-Seq procedure from mouse liver homogenate depleted of nuclei. (B) Relative protein abundance across a single ATLAS-Seq gradient for specific protein organelle markers as assessed by mass spectrometry. (C) Heatmap showing Pearson correlation coefficients of gene expression between all pairs of sucrose fractions from a single ATLAS-Seq gradient. (D) Heatmap of relative gene expression across a single ATLAS-Seq gradient, organized by hierarchical clusters, where rows are genes and columns are successively denser sucrose fractions. (E) Selected clusters from (D) enlarged. (F) Mean relative expression profiles across a single ATLAS-Seq gradient for clusters highlighted in (D), with corresponding Gene Ontology (GO) categories enriched within each cluster (right panel).
Figure 2.
Figure 2.
ATLAS-Seq profiles reflect a combination of subcellular microenvironment and ribosome occupancy. (A) Schematic illustrating sample preparation differences between polysome profiling, ribosome footprint profiling, and ATLAS-Seq. (B) Scatter plot of weighted sums of polysome profiling counts (see Methods) versus ribosome footprint profiling transcript per million (TPM) counts in HEK293T cells (top panel). Scatter plot of weighted sums of ATLAS-Seq counts (see Methods) and ribosome footprint profiling TPM counts in mouse liver (bottom panel). All genes are shown in gray, and genes in three clusters identified by hierarchical clustering of one ATLAS-Seq gradient (Figure 1D) are shown in red, purple, and blue. (C) Normalized ATLAS-Seq profiles for each of the three clusters highlighted in (B), along with GO categories for which they are enriched.
Figure 3.
Figure 3.
ATLAS-Seq reveals subcellular localization of RNAs in a manner consistent with other established techniques. (A) Gene clusters identified by ATLAS-Seq, plotted as a function of the proportion of genes within each cluster identified by ER APEX-RIP (x-axis) and the proportion of genes within each cluster predicted to be secreted by SignalP (y-axis). Clusters significantly enriched as determined by Fisher's exact test, in ER-related GO categories are shown in red, clusters with significant non-ER GO enrichment are shown in blue, and clusters with no significant GO enrichment are shown in gray. (B) Distribution of normalized TPMs across the ATLAS-Seq gradient for 13 genes identified to be mitochondrially-associated by APEX-RIP. Normalized mass spectrometry peptide counts for fumarate hydratase across the ATLAS-Seq gradient are shown in black. Pearson correlation coefficients between TPMs for each RNA and fumarate hydratase peptide counts are shown. (C) Normalized TPM profiles across one ATLAS-Seq gradient for RNAs encoding fibronectin 1 (Fn1), proteasomal subunit A1 (Psma1), proteasomal subunit B1 (Psmb1), Proteasomal ubiquitin receptor (Adrm1), 26s proteasome regulatory subunit 8 (Psmc5), and ATP synthase subunit beta (Atp5b) in green or red as labeled. Pearson correlation coefficients between each pair of RNAs are also listed. (D) smiFISH for RNAs encoding Fn1, Psma1, and Psmb1, Adrm1, Psmc5, Atp5b in NIH 3T3 cells. Fn1 exhibits a perinuclear pattern, whereas Psma1 and Psmb1 are distributed throughout the cytoplasm. Nuclei were stained by DAPI (blue), and the same scale bar applies to all images (10 μm).
Figure 4.
Figure 4.
Most RNAs are anti-correlated with the proteins they encode in the ATLAS-Seq gradient. (A) Normalized TPM (blue line) and peptide counts (red line) across the ATLAS-Seq gradient for Albumin (Alb, top panel), and 26S proteasome non-ATPase regulatory subunit 2 (Psmd2, bottom panel). Pearson correlation coefficients between RNA and protein are shown. (B) Distribution of Pearson correlation coefficients between RNAs and the proteins they encode across the ATLAS-Seq gradient for 404 genes. (C) Cellular compartment GO categories enriched in genes whose RNAs are strongly correlated with the proteins they encode. The size of each dot is determined by the number of genes (also listed next to point) found in that GO category. Fold enrichment was calculated by the observed number of genes in a GO category divided by the expected number of genes in that category (see Methods) (top panel). Cellular compartment GO categories enriched in genes whose RNAs strongly anti-correlate with the proteins they encode (bottom panel). (D) Normalized TPM (blue lines) and peptide counts (red lines) across the ATLAS-Seq gradient for genes with both ATLAS-Seq and mass spectrometry data in Cluster 53, which is enriched for proteasome genes. The median pairwise correlation among all RNAs and among all proteins in the cluster are listed. (E) Histogram of median pairwise correlations of protein profiles (red) for all clusters containing at least two proteins. Median pairwise correlations were also computed using shuffled RNA-protein assignments and plotted (gray). For reference, the median of all median pairwise RNA correlations across all RNA clusters is indicated in blue dashed line.
Figure 5.
Figure 5.
Alternative first and last exons exhibit differential profiles across the ATLAS-Seq gradient. (A) Ψ values across one ATLAS-Seq gradient for AFE isoforms of Chromatin target of PRMT1 protein, Chtop. (B) Ψ values across one ATLAS-Seq gradient for ALE isoforms of Caspase-9, Casp9. (C) Cumulative distribution of PhyloP conservation scores for AFE isoforms, separated by strongly regulated (ΔΨ > 0.5), moderately regulated (0.5 < ΔΨ > 0.25), and non-regulated (ΔΨ < 0.25) isoforms. P values were determined by Wilcoxon rank-sum test, comparing each regulated group to the non-regulated group. (D) Cumulative distribution of PhyloP conservation scores for ALE isoforms, similar to (C).
Figure 6.
Figure 6.
ATLAS-Seq reveals associations between RNA binding proteins and their RNA targets. (A) Distribution across the ATLAS-Seq gradient of relative peptide counts of APOBEC1 Complementation Factor (A1cf, red dashes), and normalized TPMs for apolipoprotein B (Apob, blue line). Pearson's R between A1cf and Apob = 0.92. Also shown are normalized TPMs for 894 RNAs correlating with a Pearson's R > 0.85 (gray). Shown below are GO Cellular Compartment terms associated with these RNAs. (B) Hexamers plotted by log2(foreground / background counts) on the x-axis and conservation rate on the y-axis, where foreground counts were obtained from 3′ UTRs in the set of 894 RNAs correlating > 0.85 from (A) and background counts were obtained from all other RNAs in the gradient. Conservation rate was computed across all mouse Refseq 3′ UTRs as fraction of instances showing full conservation across mouse, human, rat, and dog multi-alignments. The top 10 BindNSeq A1cf hexamers are highlighted in red. (C) Relative peptide counts for heterogeneous nuclear ribonucleoprotein F (hnRNP F, red dashes) and normalized TPMs for RNAs correlating with Pearson's R > 0.85 (gray). (D) Cumulative distribution of the number of hnRNP F CLIP binding sites per unit TPM for groups of RNAs separated by Pearson's correlation to relative abundance of hnRNP F peptides. *P < 0.05, **P < 0.001 as assessed by Wilcoxon rank-sum test. (E) Relative peptide counts for heterogeneous nuclear ribonucleoprotein Q (hnRNP Q/Syncrip, red dashes) and mean TPM profile for the RNA cluster best correlating with hnRNP Q peptide counts (blue line). Shown below are GO Cellular Compartment terms enriched in that cluster. (F) Relative peptide counts for Myosin-9 (Myh9, red dashes) and mean TPM profile for the RNA cluster best correlating with Myh9 peptide counts (blue). Shown below are GO Cellular Compartment terms enriched in that cluster.

References

    1. Diehn M., Bhattacharya R., Botstein D., Brown P.O.. Genome-scale identification of membrane-associated human mRNAs. PLos Genet. 2006; 2:e11. - PMC - PubMed
    1. Pyhtila B., Zheng T., Lager P.J., Keene J.D., Reedy M.C., Nicchitta C.V.. Signal sequence- and translation-independent mRNA localization to the endoplasmic reticulum. RNA. 2008; 14:445–453. - PMC - PubMed
    1. Mili S., Moissoglu K., Macara I.G.. Genome-wide screen identifies localized RNAs anchored at cell protrusions through microtubules and APC. Nature. 2008; 453:115–119. - PMC - PubMed
    1. Hengst U., Jaffrey S.R.. Function and translational regulation of mRNA in developing axons. Semin. Cell Dev. Biol. 2007; 18:209–215. - PMC - PubMed
    1. Steward O., Schuman E.M.. Protein synthesis at synaptic sites on dendrites. Annu. Rev. Neurosci. 2001; 24:299–325. - PubMed

Publication types