

doi: 10.1083/jcb.201910089.
Fam20C regulates protein secretion by Cab45 phosphorylation
Affiliations
- PMID: 32422653
- PMCID: PMC7265331
- DOI: 10.1083/jcb.201910089
Item in Clipboard
Fam20C regulates protein secretion by Cab45 phosphorylation
J Cell Biol.
.
Abstract
The TGN is a key compartment for the sorting and secretion of newly synthesized proteins. At the TGN, soluble proteins are sorted based on the instructions carried in their oligosaccharide backbones or by a Ca2+-mediated process that involves the cargo-sorting protein Cab45. Here, we show that Cab45 is phosphorylated by the Golgi-specific protein kinase Fam20C. Mimicking of phosphorylation translocates Cab45 into TGN-derived vesicles, which goes along with an increased export of LyzC, a Cab45 client. Our findings demonstrate that Fam20C plays a key role in the export of Cab45 clients by fine-tuning Cab45 oligomerization and thus impacts Cab45 retention in the TGN.
© 2020 Hecht et al.
Figures
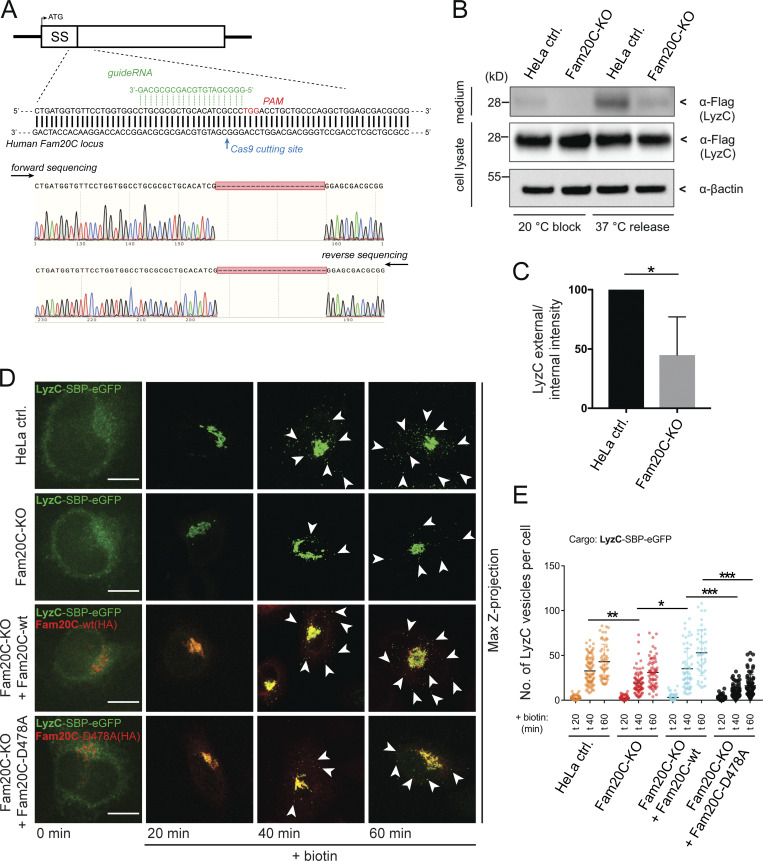
Depletion of endogenous Fam20C impairs sorting and secretion of LyzC. (A) HeLa Fam20C KO cells were generated using the CRISPR/Cas9 technique. Fam20C was targeted downstream of the signal sequence (SS) with gRNA next to Cas9 cutting site PAM. Sequencing of a Fam20C-KO clone highlight the deletion of 22 bp. (B) Western blot analysis of the secretion of LyzC-Flag in HeLa control (ctrl.) and Fam20C-KO cells after 20°C block and 37°C release. β-Actin was used as loading control. (C) Western blots of four independent experiments (B) were quantified by densitometry with ImageJ. The bar graph represents the means ± SD of densitometric values of external LyzC-Flag, normalized to internal levels in percentage. Statistical test, Kolmogorov–Smirnov. (D) Representative immunofluorescence images of the LyzC-RUSH experiments, showing LyzC transport in different cell lines. Cells were fixed at 0, 20, 40, and 60 min after biotin addition and costained with anti-HA antibody. Arrowheads indicate post-Golgi vesicles. Scale bars, 10 µm. (E) LyzC vesicle formation was quantified from RUSH experiments (D), analyzing z-stack images (d = 0.35 µm). A scatter dot plot represents the means (± SD) of at least three independent experiments (n > 45 cells per condition). Statistical test, Kruskal–Wallis. *, P < 0.05; **, P < 0.01.; ***, P < 0.001.
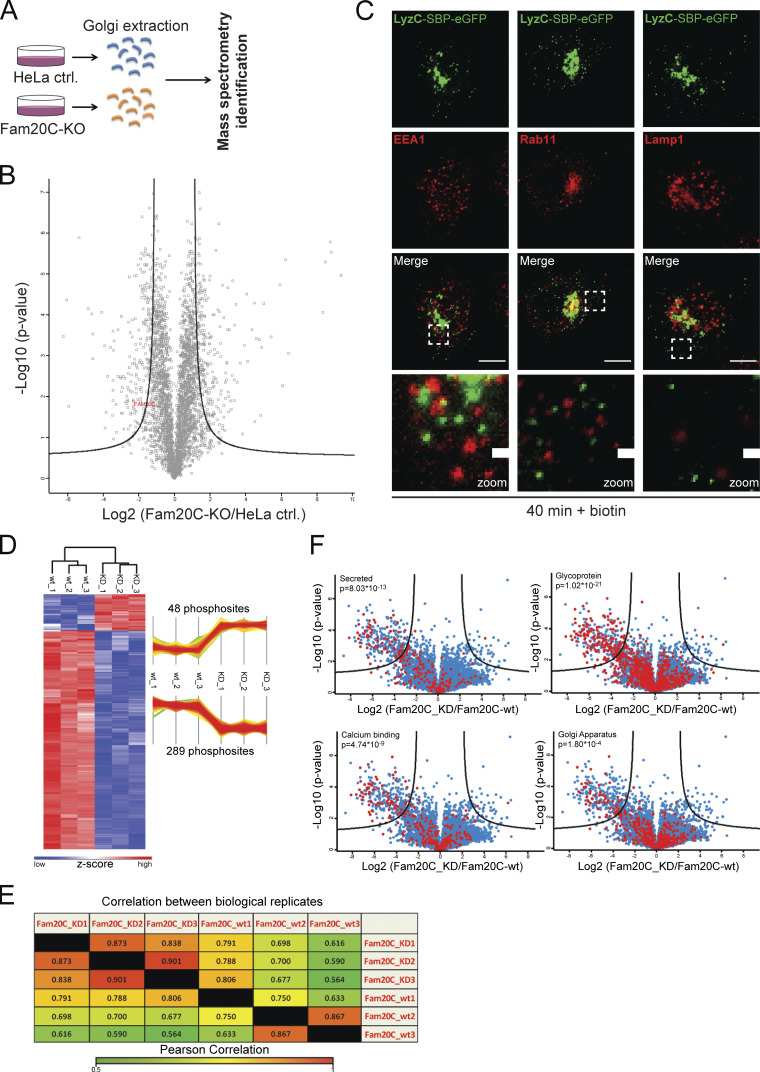
MS analysis confirming Fam20C protein KO and Fam20C-dependent phosphorylation sites of Cab45 (related to Figs. 1 and 3). (A) Scheme of the MS approach used to identify Fam20C protein KO. Golgi fractions of HeLa control and Fam20C-KO cells were isolated by sucrose gradient centrifugation. Equal protein amounts were separated by SDS PAGE and analyzed by MS (n = 3). (B) Volcano plot of the identified proteins of HeLa control cells versus Fam20C-KO cells. Fam20C was identified in HeLa-WT cells by MS/MS (indicated in red), but not in Fam20C-KO cells. (C) Colocalization of vesicular LyzC-SBP-EGFP against endosomal and lysosomal markers was analyzed using immunofluorescence microscopy. HeLa cells were transfected with RUSH construct LyzC-SBP-EGFP and incubated for 40 min with biotin. Cells were fixed and stained with α-EEA1 antibody (early endosomes), α-Rab11 antibody (recycling endosomes), and α-Lamp1 antibody (lysosomes). Scale bars, 10 µm. The magnification of the inset is shown in the lowest panel (scale bars, 1 µm). (D) Heatmap and profile plot illustrating hits that were significantly phosphorylated in the kinase-dead (KD) Fam20C samples (48 phosphosites) or Fam20C-WT samples (289 phosphosites). Red and blue represent the high and low z-scores, respectively. (E) Quantification of the analyzed Fam20C-WT and Fam20C-KD samples using Pearson correlation analysis. Hits from each sample were compared with hits from samples of the same group (biological replicates) as well as with hits from samples from the other group (Fam20C-WT vs. Fam20C-KD). High and low correlations between samples are indicated by red and green, respectively. (F) Categorization of the detected protein hits into subgroups (red dots). The phosphorylated proteins were analyzed for similarities (secreted, glycosylated, calcium-binding, and Golgi-localized proteins). P values describe the amount of enriched phosphorylated proteins in each subgroup.
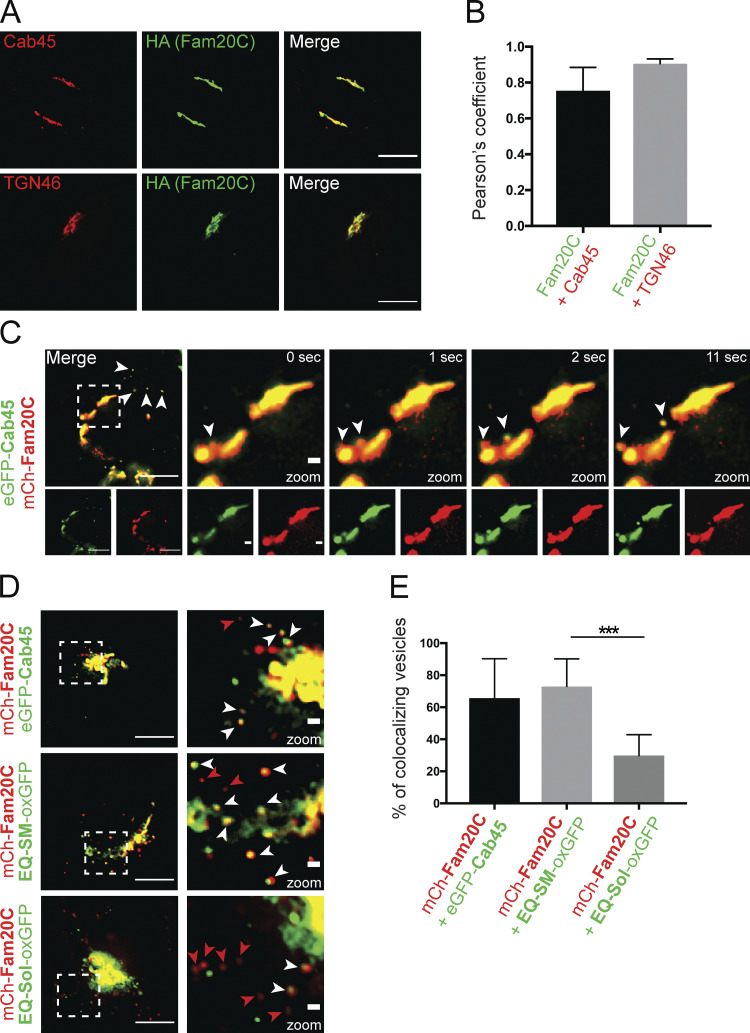
Fam20C buds with Cab45 in TGN-derived vesicles. (A) Colocalization of Fam20C-HA, Cab45, and TGN46 in stable Fam20C cell lines was demonstrated by using immunofluorescence microscopy. Scale bars, 10 µm. (B) Pearson’s correlation coefficients were determined from A using ImageJ. The bar graph represents the means ± SD (n > 8 cells per condition). (C) The budding of Fam20C vesicles from the Golgi was observed in living cells expressing mCherry-Fam20C and EGFP-Cab45. Time-lapse movies were acquired. Scale bars, 10 µm. Arrowheads indicate colocalizing vesicles. Higher magnification shows Golgi (inset; scale bars, 1 µm). (D) Example micrographs are showing the Fam20C vesicle budding in living cells that expressed mCherry-Fam20C with EGFP-Cab45, EQ-SM-oxGFP, or EQ-Sol-oxGFP. Scale bars, 10 µm. Higher magnification shows Golgi (inset; scale bars, 1 µm). White arrowheads indicate colocalizing vesicles, and red arrowheads indicate Fam20C-only vesicles. (E) The numbers of colocalizing vesicles (D) were quantified. Data were collected from three independent experiments (n > 230 vesicles per condition). The bar graph illustrates the means (± SD) of colocalizing vesicles in percentage. Statistical test, Mann–Whitney. ***, P < 0.001.
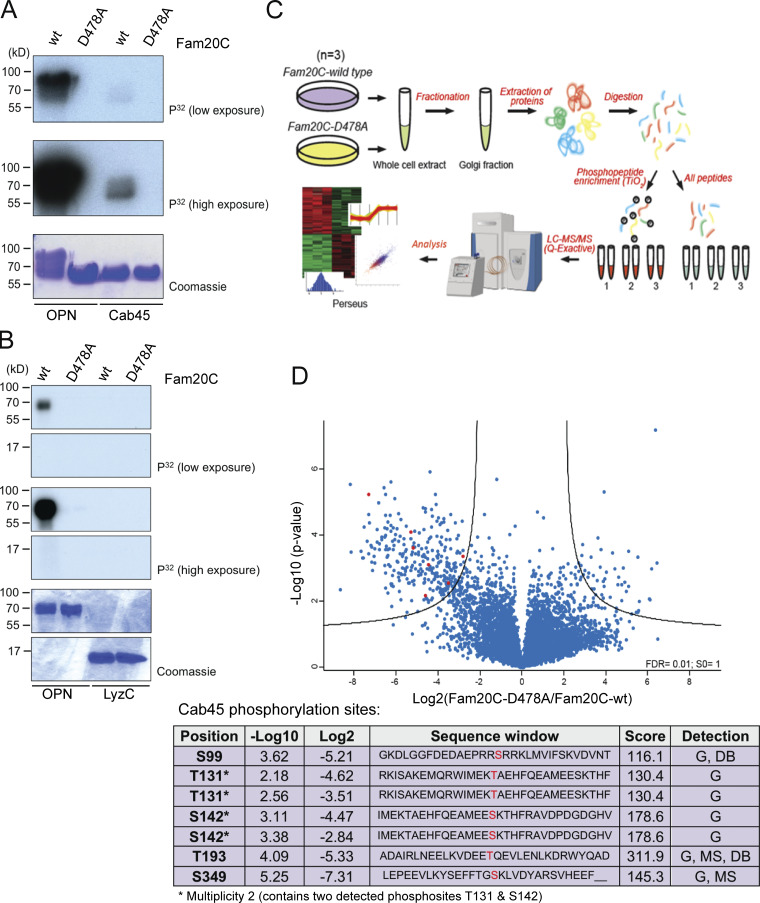
Fam20C phosphorylates Cab45 on five distinct residues. (A and B) In vitro Fam20C kinase assays. Recombinant Cab45-WT and LyzC were incubated with Fam20C-WT or Fam20C-D478A in the presence of [γ-32P]ATP. 32P incorporation was tested by SDS-PAGE and autoradiography. OPN was used as positive control. (C) Scheme of the MS approach used to identify Fam20C-dependent Cab45 phosphorylation in vivo. (D) Volcano plot is showing the phosphorylation change of phosphosites, detected in Golgi fractions of Fam20C-WT and D478A cells (C). Cab45 phosphorylation sites (red) are listed in Table 1. Abbreviations used: DB, database (www.phosphosites.org ); G, sites detected in the Golgi fractions (C and D); MS, MS after kinase assay (A).
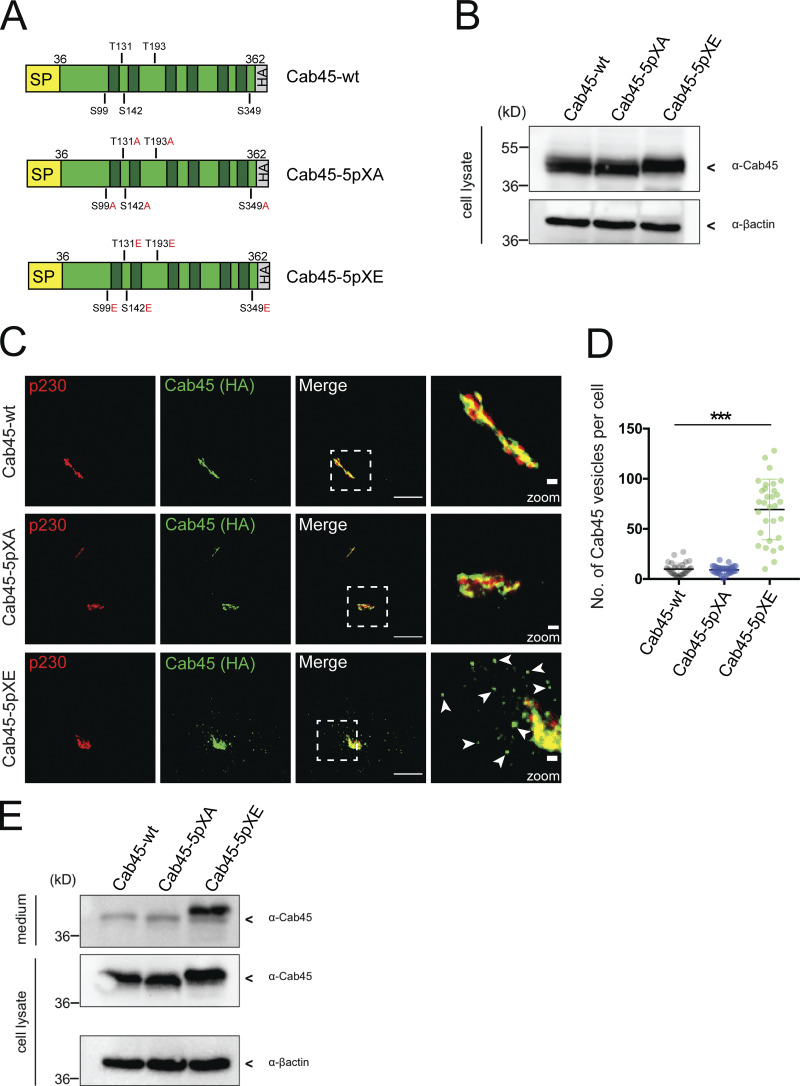
Phospho-mimicking Cab45 localizes in post-Golgi vesicles. (A) Schemes of WT and phosphomutant Cab45-HA constructs with signal peptide (SP). Identified phosphorylation sites (serine [S] and threonine [T]) were replaced by alanine (A) or glutamic acid (E). The constructs were stably transduced in Cab45-KO cells. (B) Western blot shows Cab45 expression levels of stable Cab45-WT and phosphomutant cell lines. β-Actin was used as a loading control. (C) Steady-state localization of Cab45-WT, Cab45-5pXA, and Cab45-5pXE was analyzed by immunofluorescence microscopy. Stable cell lines were stained with α-p230 and α-HA antibody (Cab45). Scale bars, 10 µm. Higher magnification (insets) show Golgi (scale bars, 1 µm). (D) The numbers of Cab45 vesicles (C) were quantified by analyzing z-stack images (d = 0.35 µm), n > 30 cells. A scatter dot plot represents mean ± SD of counted vesicles per cell. Statistical test, Kruskal–Wallis. (E) The post-Golgi origin of Cab45 vesicles was confirmed by Western blotting after performing a 20°C block in stable cell lines. β-Actin was used as loading control. ***, P < 0.001.
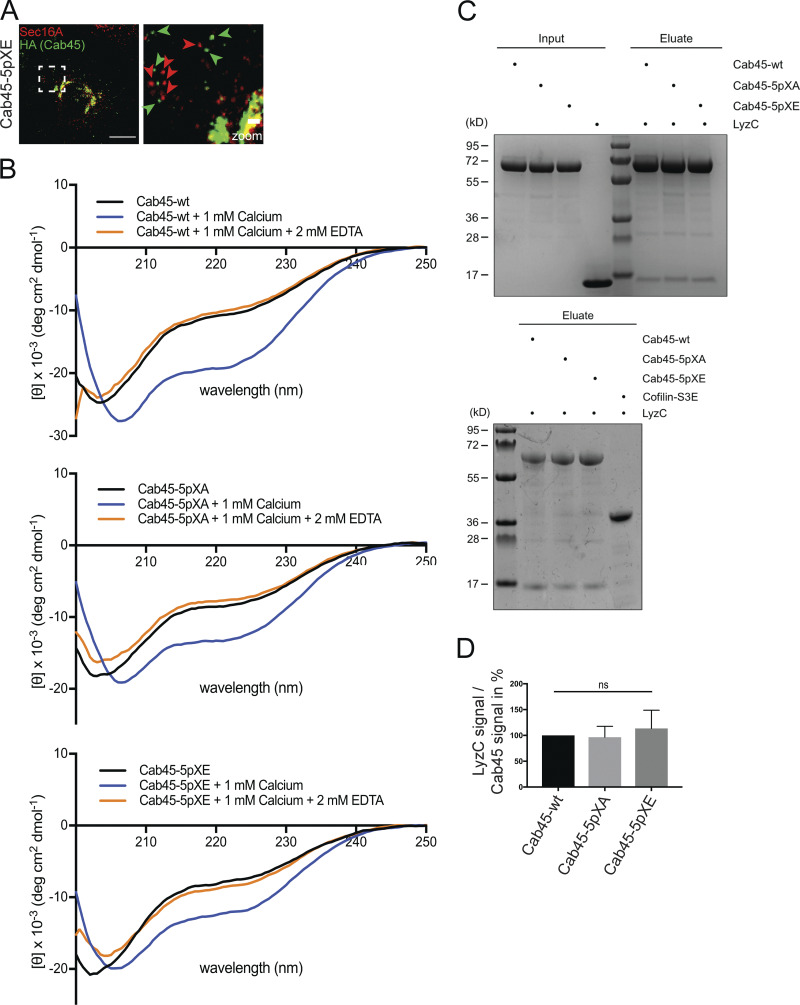
Mutation of Cab45 phosphorylation sites alters the localization, but not the secondary structure or cargo-binding ability, of the protein (related to Fig. 4). (A) Representative immunofluorescence images of cells that stably expressed Cab45-5pXE, stained against Cab45-5pXE (α-HA) and ER exit sites (α-Sec16A). Scale bar, 10 µm. The magnification of the inset is shown in the right panel (scale bar, 1 µm). The green arrowheads indicate Cab45-5pXE vesicles, and the red arrowheads indicate Sec16A-positive ER exit sites. (B) Far-ultraviolet CD spectroscopy measurements of recombinant Cab45-WT, Cab45-5pXA, and Cab45-5pXE. The secondary structures of the proteins were analyzed only in the buffer after adding 1 mM Ca2+ and followed by 2 mM EDTA. (C) Coimmunoprecipitation of recombinant LyzC with Cab45-WT and phosphomutants analyzed by Coomassie staining. Recombinant Cab45 proteins were enriched by Ni2+ beads, washed, and incubated with recombinant LyzC (upper blot). Cofilin-S3E was used as a negative control (lower blot). (D) Coomassie gels of three independent experiments described in C were quantified by densitometry with ImageJ software. The bar graph represents the means ± SD of densitometric values of LyzC signal normalized to Cab45 signal in percent. Statistical test, Kruskal–Wallis.
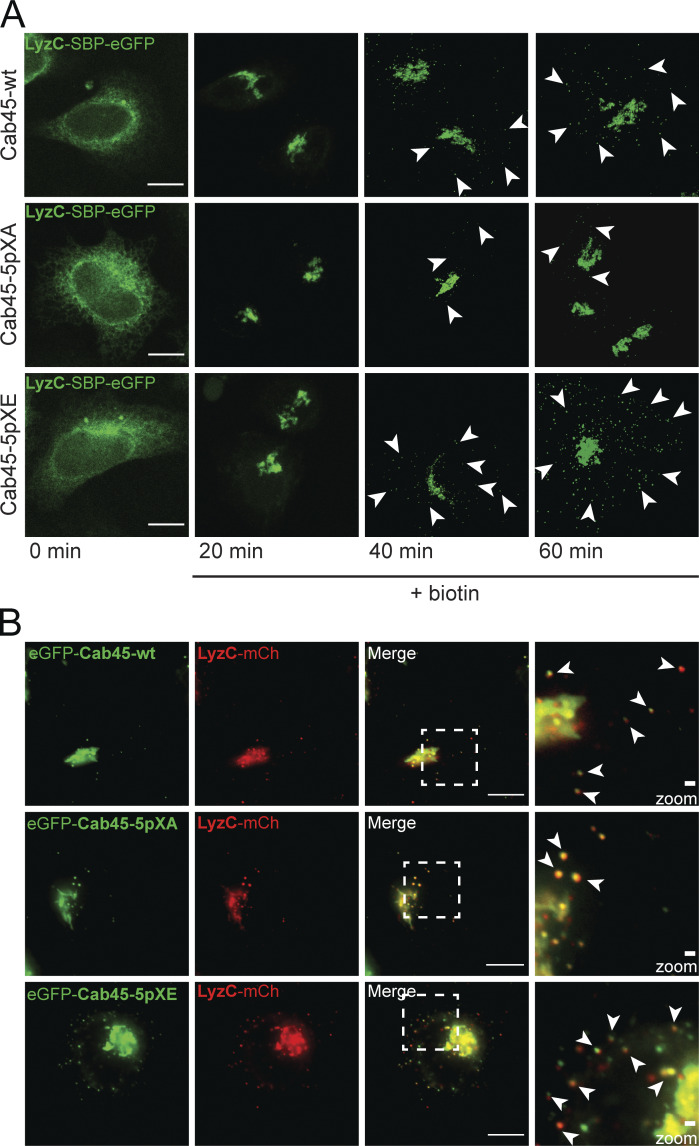
Specific LyzC sorting of Cab45 phosphomutants (related to Fig. 5). (A) Representative immunofluorescence images of RUSH experiments, showing LyzC transport in Cab45-WT and phosphomutant cell lines. The cells were transfected with LyzC-SBP-EGFP and fixed at 0, 20, 40, and 60 min after addition of biotin. Z-stack images (d = 0.35 µm) were analyzed. The arrowheads indicate cytoplasmic vesicles. Scale bars, 10 µm. (B) Cab45 phosphomutants and Cab45-WT were sorted together with LyzC into the same vesicles. HeLa WT cells were transfected with different EGFP-Cab45 constructs and LyzC-mCherry. Time-lapse movies were acquired to observe vesicle budding over time. Scale bars, 10 µm. The magnification of the inset is shown in the last panel. Bars, 1 µm. Arrowheads indicate secretory vesicles that contained both fluorescent proteins.
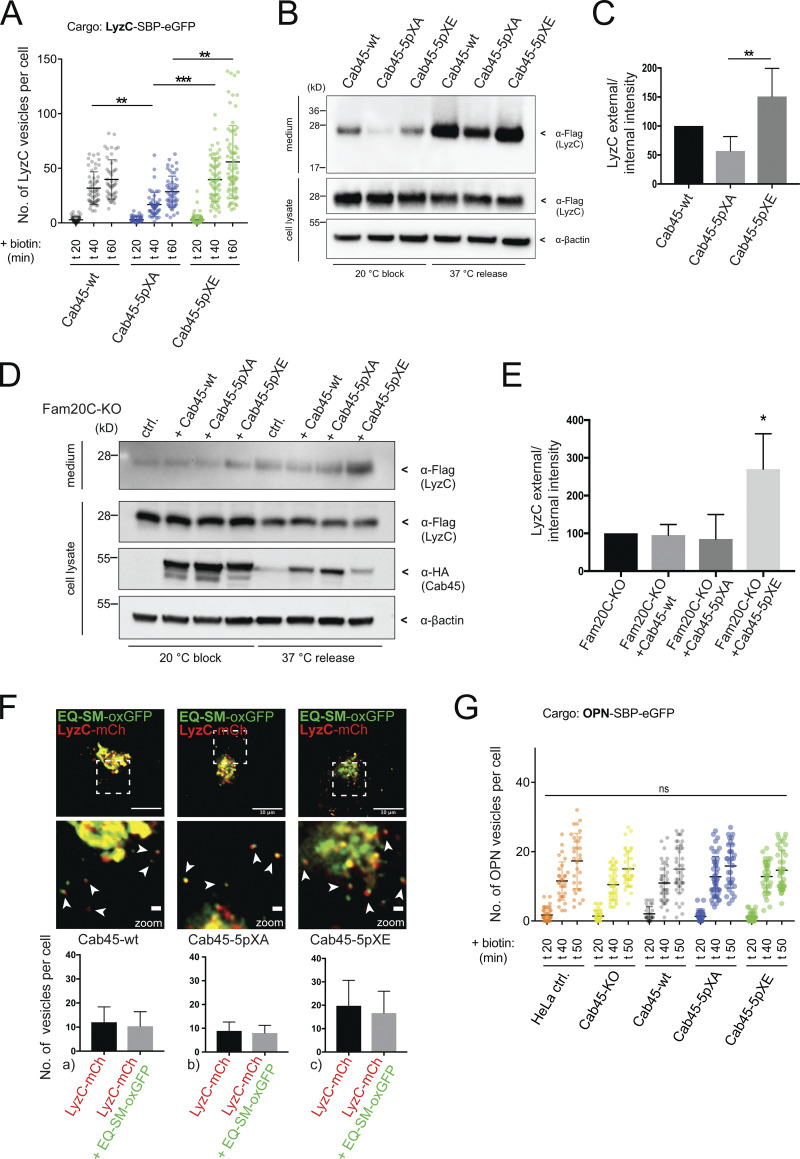
Fam20C-dependent Cab45 phosphorylation drives client sorting and secretion. (A) LyzC vesicle formation was quantified from LyzC-RUSH experiments by analyzing z-stack images (d = 0.35 µm). Cell lines were fixed at 0, 20, 40, and 60 min after biotin addition. A scatter dot plot represents the means ± SD of at least three independent experiments (n > 45 cells per condition). Statistical test, Kruskal–Wallis. (B) Western blot analysis of the secretion of LyzC-Flag in Cab45-WT and phosphomutant cells after 20°C block and 37°C release. β-Actin was used as loading control. (C) Western blots of four independent experiments (B) were quantified by densitometry using ImageJ. The bar graph represents the means (± SD) of densitometric values of external LyzC-Flag, normalized to the internal levels in percentage. Statistical test, Kruskal–Wallis. (D) Western blot analysis of the secretion of LyzC-Flag in Fam20C-KO cells rescued with Cab45 and phosphomutants after 20°C block and 37°C release. β-Actin was used as loading control. (E) Western blots of three independent experiments (D) were quantified by densitometry using ImageJ. The bar graph represents the means ± SD of densitometric values of external LyzC-Flag, normalized to the internal levels in percentage. Statistical test, ordinary one-way ANOVA. (F) Sorting of LyzC in EQ-SM-vesicles was controlled by performing live-cell experiments acquiring time-lapse movies. Example micrographs depict the Golgi of Cab45-WT and phosphomutants that expressed LyzC-mCherry and EQ-SM-oxGFP. Scale bars, 10 µm; magnification scale bars, 1 µm. Arrowheads indicate secretory vesicles containing both fluorescence proteins. The means ± SD of post-Golgi LyzC vesicles per cell positive for EQ-SM were quantified (n = 8 cells per condition). (G) OPN vesicle formation was quantified from OPN-RUSH experiments by analyzing z-stack images (d = 0.35 µm). Cell lines were fixed at 0, 20, 40, and 50 min after biotin addition. A scatter dot plot represents the means ± SD of at least three independent experiments (n > 28 cells per condition). Statistical test, Kruskal–Wallis. *, P < 0.05; **, P < 0.01; ***, P < 0.001.
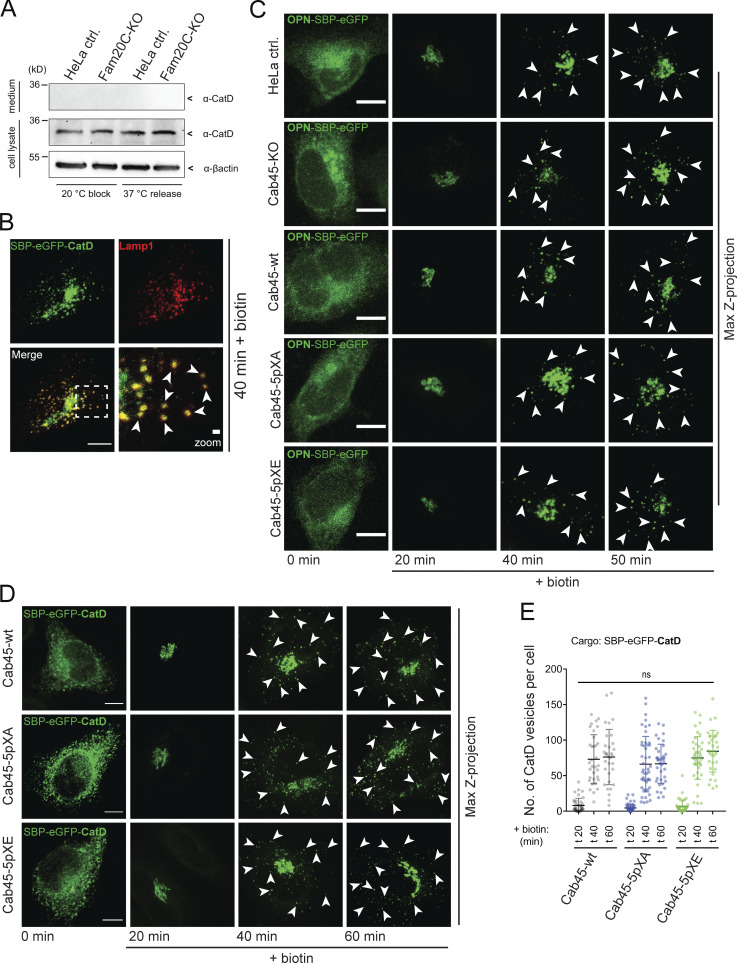
Sorting of non-Cab45 cargos is not affected in Cab45 phosphomutants (related to Fig. 5). (A) Western blot analysis of the secretion of CatD in HeLa control and Fam20C-KO cells. Endogenous CatD was trapped in the Golgi at 20°C and released for 1 h at 37°C. The supernatants (upper panel) and cell lysates (lower panels) were tested for CatD by Western blotting. β-Actin was used as loading control. (B) Representative immunofluorescence images of colocalization of vesicular SBP-EGFP-CatD with the lysosomal marker Lamp1. HeLa cells were transfected with RUSH construct and incubated for 40 min with biotin. Cells were fixed and stained with α-Lamp1 antibody. Scale bar, 10 µm. The magnification of the inset is shown in the lower right pane (scale bar, 1 µm). (C) Representative immunofluorescence images of RUSH experiments showing OPN transport in HeLa control, Cab45-KO, Cab45-WT, and Cab45 phosphomutant cell lines. Cells were transfected with OPN-SBP-EGFP and fixed at 0, 20, 40, and 50 min after the addition of biotin. Z-stack images (d = 0.35 µm) were analyzed. The arrowheads indicate cytoplasmic vesicles. Scale bars, 10 µm. (D) Representative immunofluorescence images of RUSH experiments showing cathepsin D (CatD) transport in Cab45-WT and phosphomutant cell lines. Cells were transfected with SBP-EGFP-CatD and fixed at 0, 20, 40, and 60 min after the addition of biotin. Z-stack images (d = 0.35 µm) were analyzed. The arrowheads indicate cytoplasmic vesicles. Scale bars, 10 µm. (E) The numbers of CatD budding vesicles (D) were quantified. The cytoplasmic vesicles were counted at each time point by analyzing z-stack images (d = 0.35 µm). Scatter dot plot represents the means ± SD of at least three independent experiments (n > 30 cells per condition). Statistical test, Kruskal–Wallis.
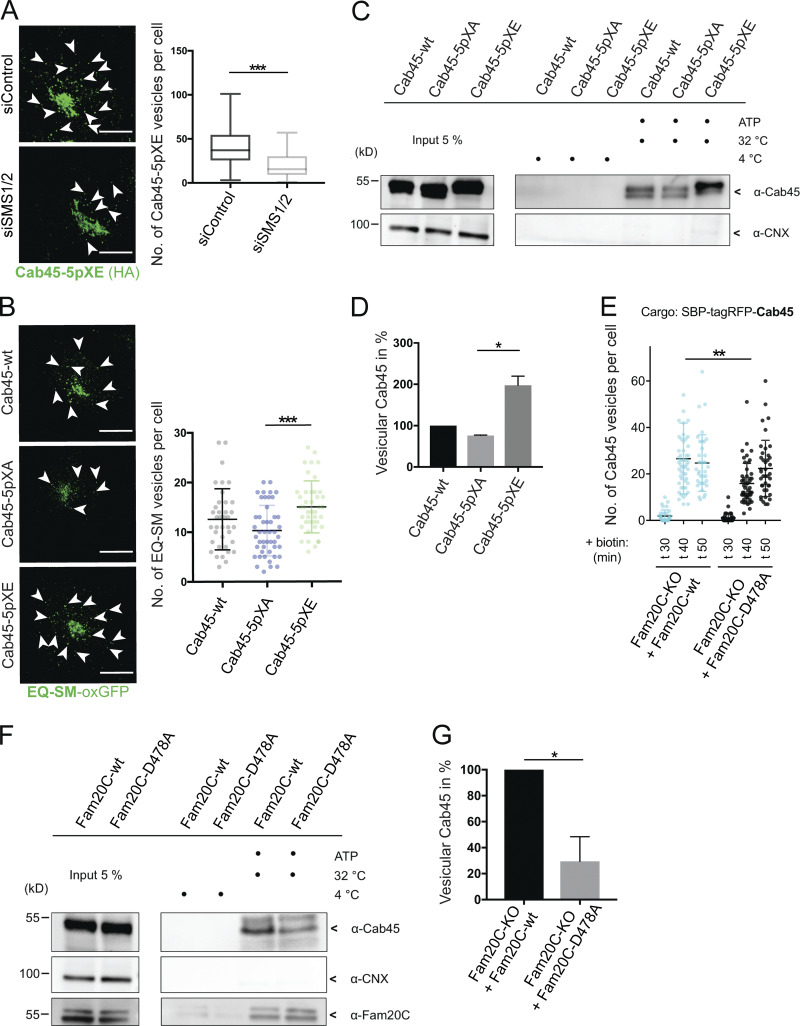
Mimicking Cab45 phosphorylation results in accelerated TGN export. (A) Representative immunofluorescence pictures of cells that stably expressed Cab45-5pXE, treated with control or SMS1/2 siRNA. Cells were stained against Cab45 (α-HA), and numbers of vesicles were quantified from z-stack images (d = 0.35 µm). Arrowheads indicate post-Golgi vesicles. Scale bars, 10 µm. Box and whiskers blot represents means with minimum to maximum values of at least three independent experiments (n > 57 cells per condition). Statistical test, Mann–Whitney. (B) Example micrographs of Cab45-WT and phosphomutant cell lines transfected with EQ-SM-oxGFP, after 20°C block and 37°C release. EQ-SM-oxGFP vesicles were quantified from z-stack images (d = 0.35 µm). Scale bars, 10 µm. A scatter dot plot represents means ± SD of at least three independent experiments (n > 37 cells per condition). Statistical test, Kruskal–Wallis. (C) Vesicular budding assay of Cab45 phosphomutants. TGN vesicle budding was initiated by an ATP regeneration system. Released vesicles were analyzed by Western blotting for Cab45 and CNX. (D) Western blots of three independent experiments (C) were quantified by densitometry with ImageJ. The bar graph represents the means ± SD of densitometric values of vesicular Cab45 in percentage. Statistical test, Kruskal–Wallis. (E) Cab45 vesicle formation was quantified from Cab45-RUSH experiments by analyzing z-stack images (d = 0.35 µm). Fam20C-KO cells expressing Fam20C-WT or Fam20C-D478A were fixed at 0, 30, 40, and 50 min after biotin addition. A scatter dot plot represents the means ± SD of at least three independent experiments (n > 35 cells per condition). Statistical test, Kruskal–Wallis. (F) Vesicular budding assay of endogenous Cab45. TGN vesicle budding was initiated by an ATP regeneration system in Fam20C-KO cells, which were transfected with Fam20C-WT and D478. Released vesicles were analyzed by Western blotting for Cab45, Fam20C (HA), and CNX. (G) Western blots of four independent experiments (F) were quantified by densitometry with ImageJ. The bar graph represents the means ± SD of densitometric values of vesicular Cab45 in percentage. Statistical test, Welch’s unpaired t test. *, P < 0.05; **, P < 0.01; ***, P < 0.001.
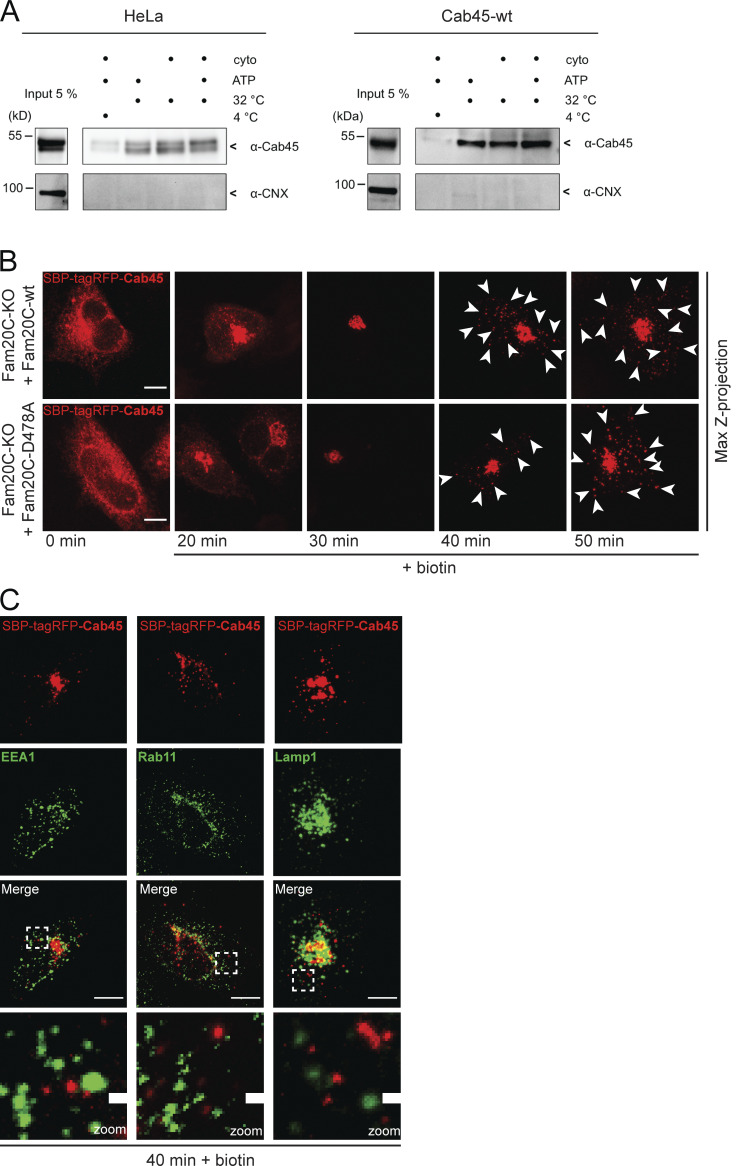
TGN export of Cab45 (related to Fig. 6). (A) Vesicular budding assays of Cab45. The budding of TGN-derived vesicles was tested in HeLa cells (left blot) and overexpressed Cab45-WT (right blot) in dependency of ATP and rat liver cytosol at 32°C. The released vesicles were collected and analyzed by Western blotting for Cab45 and CNX. Cells incubated at 4°C were used as the negative control. (B) Representative immunofluorescence images of RUSH experiments showing Cab45 transport in Fam20C KO cells that reexpress Fam20C-WT and the kinase-dead Fam20C-D478A. The cells were transfected with SBP-tagRFP-Cab45 and fixed at 0, 20, 30, 40, and 50 min after the addition of biotin. Z-stack images (d = 0.35 µm) were analyzed. The arrowheads indicate cytoplasmic vesicles. Scale bars, 10 µm. (C) Colocalization of vesicular SBP-tagRFP-Cab45 against endosomal and lysosomal markers was checked using immunofluorescence microscopy. HeLa cells were transfected with RUSH construct SBP-tagRFP-Cab45 and incubated for 40 min with biotin. Cells were fixed and stained with α-EEA1 antibody (early endosomes), α-Rab11 antibody (recycling endosomes) and α-Lamp1 antibody (lysosomes). Scale bars, 10 µm. The magnification of the inset is shown in the lowest panel. Scale bars, 1 µm.
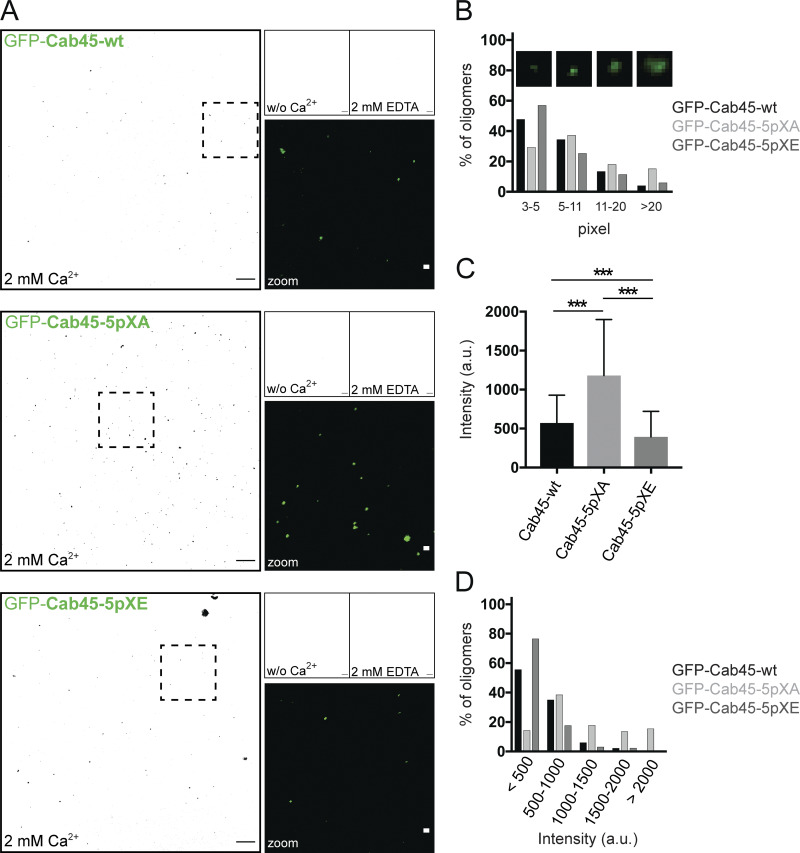
Mutations of Cab45 phosphosites influence Cab45 oligomerization. (A) In vitro oligomerization assay analyzed by confocal microscopy. Representative fluorescence pictures (black and white conversion) of recombinant GFP-Cab45WT and phosphomutants incubated without (w/o) Ca2+, together with 2 mM Ca2+ or after additional treatment with 2 mM EDTA. Scale bars, 10 µm. Insets display higher magnification of recombinant proteins treated with 2 mM Ca2+ in original colors (scale bars, 1 µm). (B) Distribution of Cab45 oligomers (2 mM Ca2+) according to their particle size in percentage. Insets show examples of oligomers with pixel units of 3–5, 5–11, 11-20, and >20. Data were collected from two independent experiments (n > 268 oligomers per condition) using ImageJ. (C) Average intensity values of oligomers formed by Cab45-WT and phosphomutants, incubated with 2 mM Ca2+. For analysis, individual background intensities were subtracted, and the pixel with the highest intensity value within the oligomer was measured using ImageJ. Data were collected from two independent experiments (n > 124 oligomers per condition). Statistical test, Kruskal–Wallis. (D) Distribution of Cab45 oligomers according to their intensity values in percentage. Oligomers analyzed in C were grouped based on their intensities (<500 a.u., 500–1,000 a.u., 1,000–1,500 a.u., 1,500–2,000 a.u., and >2,000 a.u.). ***, P < 0.001.
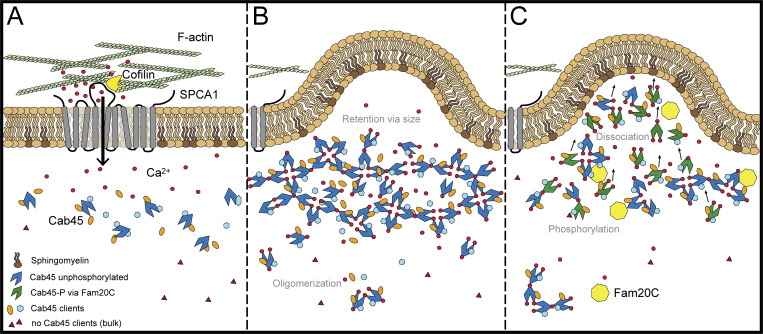
Fam20C phosphorylates Cab45 and regulates client secretion by oligomer disassembly. The model depicts the newly investigated role of Fam20C in Cab45 client sorting. A subset of soluble secretory proteins is sorted via the SPCA1/Cab45 sorting machinery. (A) SPCA1 interacts with cofilin1 on its cytosolic interface, recruits F-actin and promotes Ca2+ influx into the lumen of the TGN. (B) In the presence of Ca2+, Cab45 binds secretory clients and forms large oligomeric structures, which are, because of their size, excluded from packaging into vesicles. (C) Fam20C phosphorylates Cab45 on specific residues, whereby Cab45 multimers disassemble and TGN retention is abolished. This allows clients together with Cab45 to be packed into SM-rich vesicles.
References
-
- Barenholz Y., and Thompson T.E.. 1980. Sphingomyelins in bilayers and biological membranes. Biochimica Et Biophysica Acta Bba - Rev Biomembr. 604:129–158. - PubMed
-
- Boncompain G., and Perez F.. 2012. Synchronising protein transport in the secretory pathway. Curr Protoc Cell Biol. 15.19.1-15.19.16. - PubMed
Publication types
MeSH terms
Substances
Grants and funding
LinkOut - more resources
Full Text Sources
Other Literature Sources
Research Materials
Miscellaneous
