. 2020 May 14;21(10):3458.
doi: 10.3390/ijms21103458.

MiR-519d-3p in Trophoblastic Cells: Effects, Targets and Transfer to Allogeneic Immune Cells via Extracellular Vesicles

Affiliations

MiR-519d-3p in Trophoblastic Cells: Effects, Targets and Transfer to Allogeneic Immune Cells via Extracellular Vesicles

Wittaya Chaiwangyen et al. Int J Mol Sci. .

Abstract

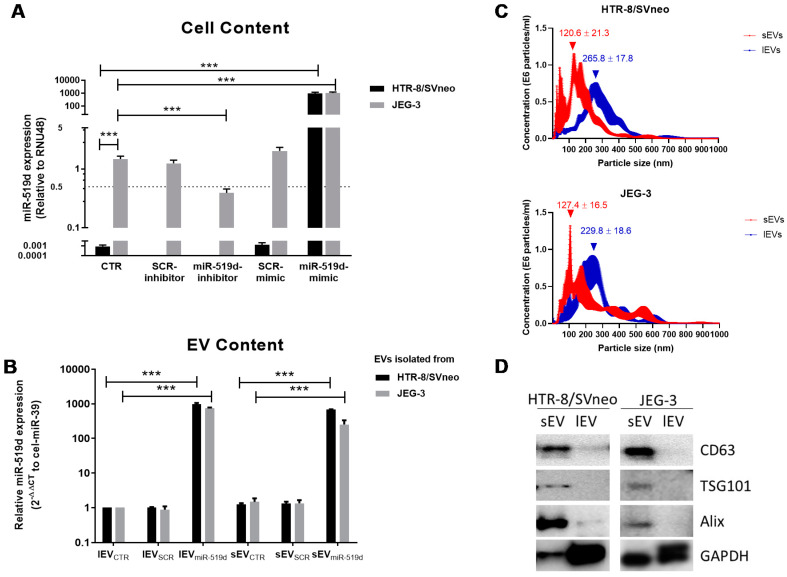
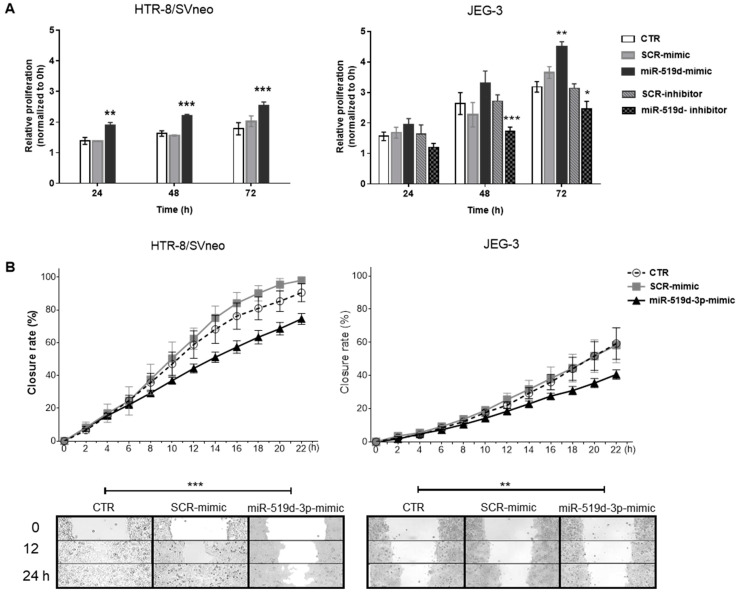
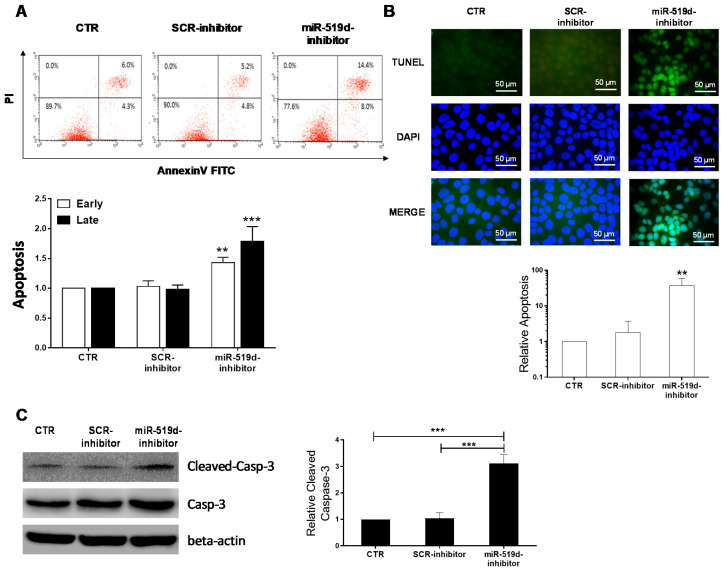
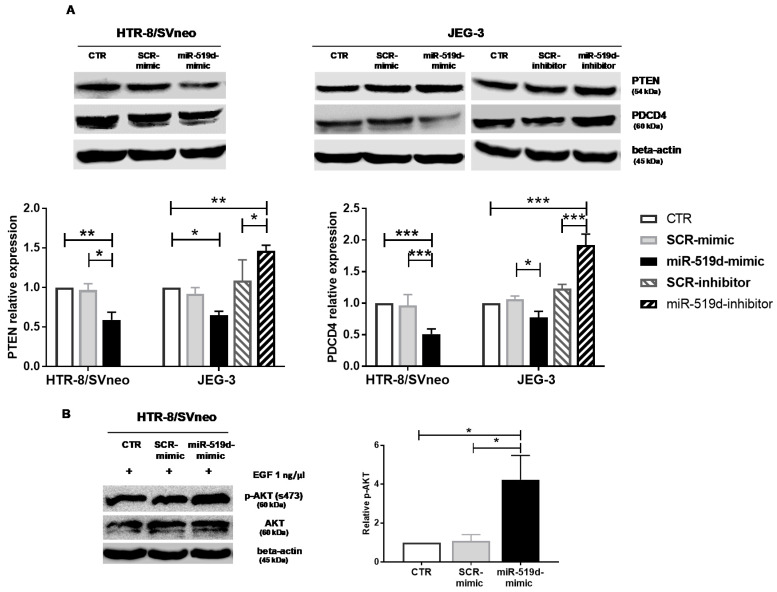
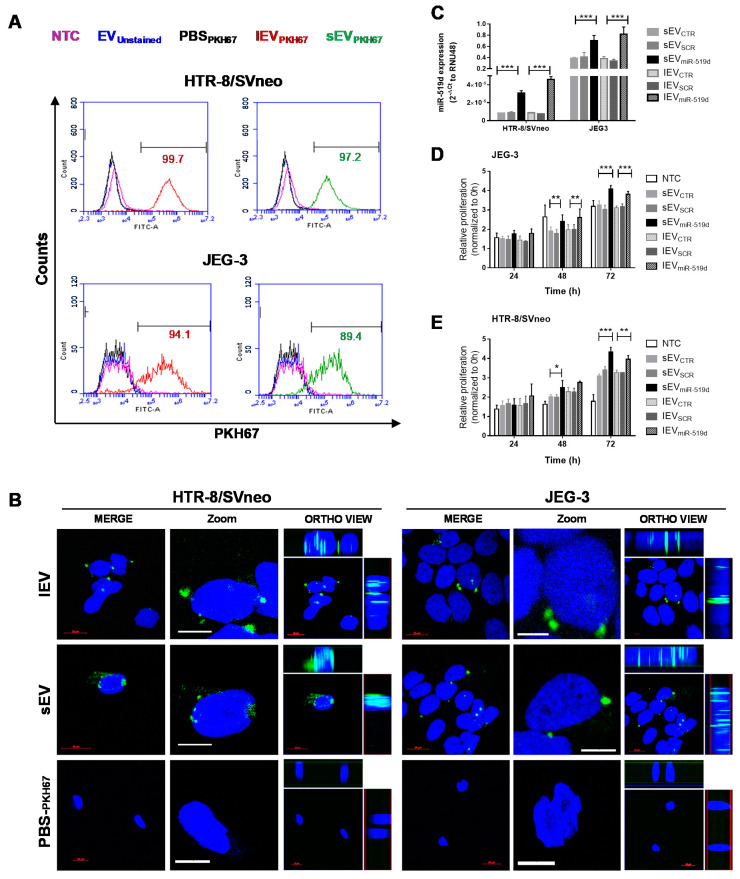
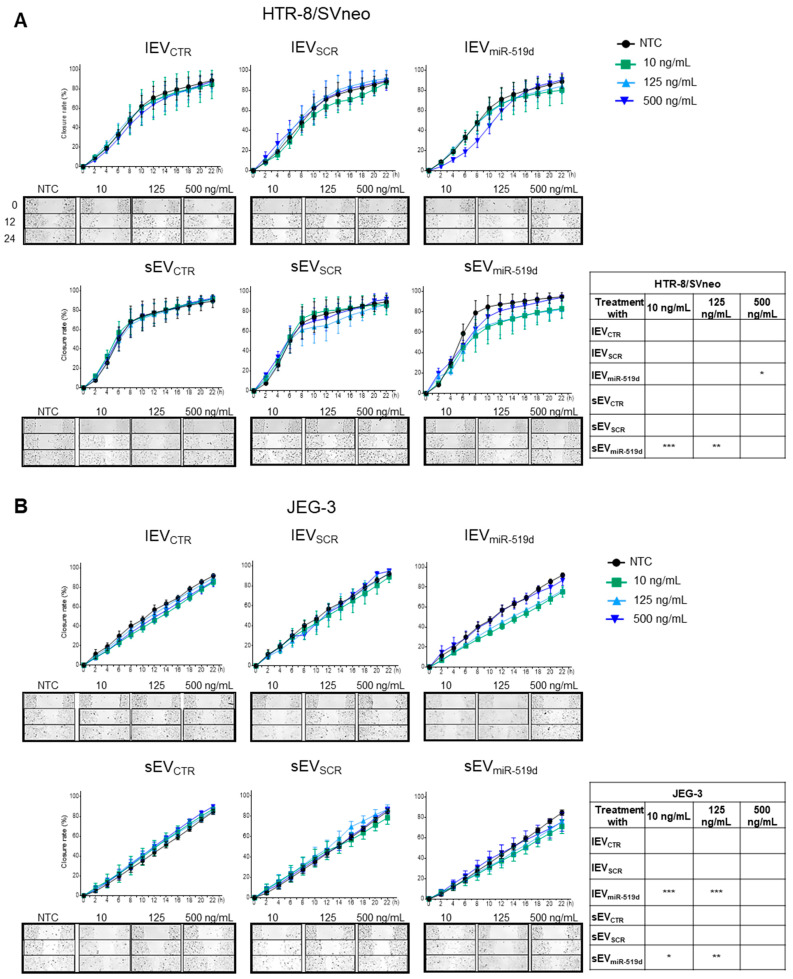
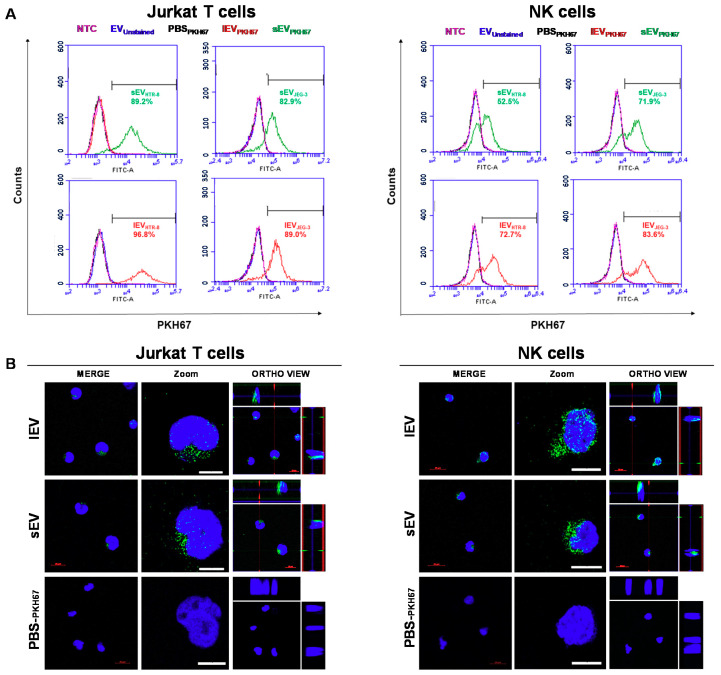
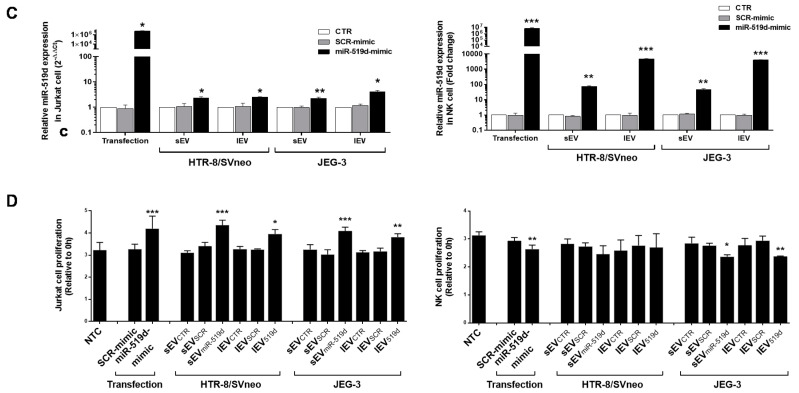
Members of the placenta-specific miRNA cluster C19MC, including miR-519d, are secreted by fetal trophoblast cells within extracellular vesicles (EVs). Trophoblast-derived EVs can be internalized by the autologous trophoblast and surrounding maternal immune cells, resulting in coordination of cellular responses. The study of functions and targets of placental miRNAs in the donor and recipient cells may contribute to the understanding of the immune tolerance essential in pregnancy. Here, we report that miR-519d-3p levels correlate positively with cell proliferation and negatively with migration in trophoblastic cell lines. Inhibition of miR-519d-3p in JEG-3 cells increases caspase-3 activation and apoptosis. PDCD4 and PTEN are targeted by miR-519d-3p in a cell type-specific manner. Transfection of trophoblastic cell lines with miR-519d mimic results in secretion of EVs containing elevated levels of this miRNA (EVmiR-519d). Autologous cells enhance their proliferation and decrease their migration ability when treated with EVmiR-519d. NK92 cells incorporate EV-delivered miR-519d-3p at higher levels than Jurkat T cells. EVmiR-519d increases the proliferation of Jurkat T cells but decreases that of NK92 cells. Altogether, miR-519d-3p regulates pivotal trophoblast cell functions, can be transferred horizontally via EVs to maternal immune cells and exerts functions therein. Vesicular miRNA transfer from fetal trophoblasts to maternal immune cells may contribute to the immune tolerance in pregnancy.

Keywords: C19MC; NK cells; T cells; cell–cell communication; extracellular vesicles; pregnancy.


Conflict of interest statement

The authors declare no conflict of interest.

Figures

Figure 1
Figure 1
Quantification of miR-519d-3p in cells and EVs. Expression of miR-519d-3p in (A) cells and (B) their secreted EVs determined by qPCR. Cells were transfected with miR-519d mimic (20 nM), miR-519d inhibitor (120 nM) or the respective scramble sequences SCR mimic and SCR inhibitor. After 48 h, EVs were enriched from cell culture supernatants. Non-detectable levels in HTR8/SVneo cells were defined as Ct 40 for subsequent calculations. miR-519d-3p expression in cells was normalized to RNU48, and in secreted vesicles to spiked cel-miR-39. Data are presented as means ± SDs, n = 3. Two-way ANOVA with Bonferroni multiple comparison test; *** p < 0.001. (C) Nanoparticle tracking analysis (NTA) of sEV (small EV, red line) and lEV (large EV) fractions (blue line) isolated from HTR-8/SVneo (upper) and JEG-3 cell (lower) supernatants. The graph shows EV concentration of depending on size, mean ± SE (n = 5). (D) Western blotting for EV-associated proteins.
Figure 2
Figure 2
The effect of miR-519d-3p on trophoblastic cell behavior. HTR-8/SVneo and JEG-3 cells were transfected with miR-519d mimic or the scramble sequence SCR mimic for 48 h. As JEG-3 cells express miR-519d, they were additionally transfected with miR-519d inhibitor and SCR inhibitor. Cells were seeded for (A) proliferation assay (BrdU incorporation assay) and (B) wound healing migration assay. Six areas were photographed (10X) and repopulation was monitored using the JuLI™ Stage cell imaging system. Data are presented as means ± SDs, n = 3. Two-way ANOVA with Bonferroni multiple comparison test. * p < 0.05, ** p < 0.01, *** p < 0.001 compared to non-transfected cells (CTR).
Figure 3
Figure 3
Induction of apoptosis by miR-519d-inhibition. (A) Annexin V staining detected by FACS. JEG-3 cells were labelled with Annexin V-FITC and PI 48 h after transfection with miR-519d inhibitor or the respective scramble sequences. Upper: exemplary flow cytometry analysis. Lower: Statistical analysis of early and late apoptotic cells (n = 3). Bars show the mean + SD. (B) Upper: TUNEL assay indicating apoptotic cells (green) and nuclei counterstained with DAPI (blue). Scale bars: 50 μm. Lower: Mean ratio of apoptotic cell number in treated cells to that in controls. Error bars indicate SD. (C) Caspase-3 expression in transfected JEG-3 cells. Bars represent means + SDs, n = 3. Two-way ANOVA with Bonferroni multiple comparison test (A) and two-tailed t-test (B,C). ** p < 0.01, *** p < 0.001.
Figure 4
Figure 4
miR-519d-3p targets PTEN and PDCD4 in trophoblastic cell lines. HTR-8/SVneo and JEG-3 cells were transfected with miR-519d mimic or the respective scramble sequence, SCR mimic. Additionally, JEG-3 cells were transfected with inhibitors of miR-519d-3p and the respective control, SCR inhibitor. After 48 h, Western blots and densitometric analyses were carried out for (A) PTEN (left) and PDCD4 (right). (B) p-AKT and AKT have been assessed upon further stimulation with EGF (1 ng/µL, for 5 min) in HTR-8/SVneo. Bars represent means ± SDs, n = 3 (PTEN and AKT) and n = 4 (PDCD4). Two-way (PTEN and PDCD4) and one-way ANOVA (AKT). * p < 0.05, ** p < 0.01, *** p < 0.001.
Figure 5
Figure 5
Uptake of trophoblastic EVs by autologous cells. (A) Flow cytometry analysis of HTR-8/SVneo and JEG-3 cells co-incubated with unstained (EVunstained) or PKH-67-labeled EVs (sEVPKH67 and lEVPKH67) or treated with EV-free PBSPKH67. Non-treated cells (NTC). Numbers (green/red) indicate the respective percentages of labeled cells. (B) Cellular uptake of autologous EVs (lEVPKH67 and sEVPKH67) in HTR-8/SVneo and JEG-3 cells imaged by confocal laser scanning microscopy. The fluorescence of DAPI and that of PKH-67 are labeled with blue and green, respectively. Merged are shown for HTR-8/SVneo and JEG-3 cells and displayed in two different magnifications. Ortho-view images of the z-stack show EVs inside the cells. Scale bars: 10 μm. (C) miR-519d-3p expression in recipient cells by qPCR normalized to RNU48. (D) Cell proliferation of HTR8/SVneo and (E) JEG-3 cells relative to NTC at 0 h. CE: HTR-8/SVneo and JEG-3 cells were treated with sEVs and lEVs isolated from cells transfected with miR-519d-3p mimic (sEVmiR-519d and lEVmiR-519d), SCR mimic (sEVSCR and lEVSCR) or non-transfected controls (sEVCTR and lEVCTR). Bars represent means ± SDs, n = 3. Two-way ANOVA with Bonferroni multiple comparison test. * p < 0.05, ** p < 0.01, *** p < 0.001.
Figure 6
Figure 6
The effect of EVs containing miR-519d-3p on trophoblastic cell migration. (A) HTR-8/SVneo and (B) JEG-3 cells were treated with sEV and lEV isolated from cells transfected with miR-519d-3p mimic (sEVmiR-519d and lEVmiR-519d), SCR mimic (sEVSCR and lEVSCR) or non-transfected controls (sEVCTR and lEVCTR) and compared to non-treated cells (NTC). Migration was assessed by using a wound healing migration assay on a JuLI™ Stage automated cell imaging system. Data are presented as means ± SDs, n = 3. Two-way ANOVA with Bonferroni multiple comparison test. * p < 0.05, ** p < 0.01, *** p < 0.001 compared to NTC.
Figure 7
Figure 7
Uptake of trophoblastic EVs by heterologous immune cells. Immune cells were co-incubated with 125 ng/mL unstained (EVunstained) or PKH-67-labeled EVs (sEVPKH67 and lEVPKH67) or treated with EV-free PBSPKH67. NTC: non-treated cells. (A) Assessment of trophoblastic EV (EVJEG-3 or EVHTR-8/SVneo) incorporation in immune cells by flow cytometry. The numbers (green/red) indicate the respective percentages of labeled cells. (B) Representative cellular uptake of HTR-8/SVneo-derived EVs (lEVPKH67 and sEVPKH67) in Jurkat T (left) and NK92 (right) cells imaged by confocal laser scanning microscopy. The fluorescence of DAPI and that of PKH-67 are pseudo-labeled with blue and green, respectively, and displayed in two different magnifications. Ortho-view images of z-stack show EVs inside the cells. Scale bars: 10 μm. (C) Jurkat T and NK92 cells were transfected directly or treated with EVs enriched from medium conditioned by trophoblastic cell lines transfected with miR-519d mimic or SCR mimic. miR-519d-3p expression in recipient cells by qPCR normalized to RNU48. (D) Cell proliferation assessed by BrdU assay at 72 h. Bars represent means ± SDs, n = 3. Two-way ANOVA with Bonferroni multiple comparison test. * p < 0.05, ** p < 0.01, *** p < 0.001.
Figure 7
Figure 7
Uptake of trophoblastic EVs by heterologous immune cells. Immune cells were co-incubated with 125 ng/mL unstained (EVunstained) or PKH-67-labeled EVs (sEVPKH67 and lEVPKH67) or treated with EV-free PBSPKH67. NTC: non-treated cells. (A) Assessment of trophoblastic EV (EVJEG-3 or EVHTR-8/SVneo) incorporation in immune cells by flow cytometry. The numbers (green/red) indicate the respective percentages of labeled cells. (B) Representative cellular uptake of HTR-8/SVneo-derived EVs (lEVPKH67 and sEVPKH67) in Jurkat T (left) and NK92 (right) cells imaged by confocal laser scanning microscopy. The fluorescence of DAPI and that of PKH-67 are pseudo-labeled with blue and green, respectively, and displayed in two different magnifications. Ortho-view images of z-stack show EVs inside the cells. Scale bars: 10 μm. (C) Jurkat T and NK92 cells were transfected directly or treated with EVs enriched from medium conditioned by trophoblastic cell lines transfected with miR-519d mimic or SCR mimic. miR-519d-3p expression in recipient cells by qPCR normalized to RNU48. (D) Cell proliferation assessed by BrdU assay at 72 h. Bars represent means ± SDs, n = 3. Two-way ANOVA with Bonferroni multiple comparison test. * p < 0.05, ** p < 0.01, *** p < 0.001.

Similar articles

Cited by

References

    1. Anin S.A., Vince G., Quenby S. Trophoblast invasion. Hum. Fertil. 2004;7:169–174. doi: 10.1080/14647270400006911. - DOI - PubMed
    1. Knofler M., Pollheimer J. IFPA Award in Placentology lecture: Molecular regulation of human trophoblast invasion. Placenta. 2012;33:S55–S62. doi: 10.1016/j.placenta.2011.09.019. - DOI - PMC - PubMed
    1. Helige C., Ahammer H., Moser G., Hammer A., Dohr G., Huppertz B., Sedlmayr P. Distribution of decidual natural killer cells and macrophages in the neighbourhood of the trophoblast invasion front: A quantitative evaluation. Hum. Reprod. 2014;29:8–17. doi: 10.1093/humrep/det353. - DOI - PubMed
    1. Liu S., Diao L., Huang C., Li Y., Zeng Y., Kwak-Kim J.Y.H. The role of decidual immune cells on human pregnancy. J. Reprod. Immunol. 2017;124:44–53. doi: 10.1016/j.jri.2017.10.045. - DOI - PubMed
    1. Lash G.E., Ernerudh J. Decidual cytokines and pregnancy complications: Focus on spontaneous miscarriage. J. Reprod. Immunol. 2015;108:83–89. doi: 10.1016/j.jri.2015.02.003. - DOI - PubMed

MeSH terms