. 2020 May 18;20(1):120.
doi: 10.1186/s12866-020-01801-y.

Defining the oral microbiome by whole-genome sequencing and resistome analysis: the complexity of the healthy picture

Affiliations

Defining the oral microbiome by whole-genome sequencing and resistome analysis: the complexity of the healthy picture

Elisabetta Caselli et al. BMC Microbiol. .

Abstract

Background: The microbiome of the oral cavity is the second-largest and diverse microbiota after the gut, harboring over 700 species of bacteria and including also fungi, viruses, and protozoa. With its diverse niches, the oral cavity is a very complex environment, where different microbes preferentially colonize different habitats. Recent data indicate that the oral microbiome has essential functions in maintaining oral and systemic health, and the emergence of 16S rRNA gene next-generation sequencing (NGS) has greatly contributed to revealing the complexity of its bacterial component. However, a detailed site-specific map of oral microorganisms (including also eukaryotes and viruses) and their relative abundance is still missing. Here, we aimed to obtain a comprehensive view of the healthy oral microbiome (HOM), including its drug-resistance features.

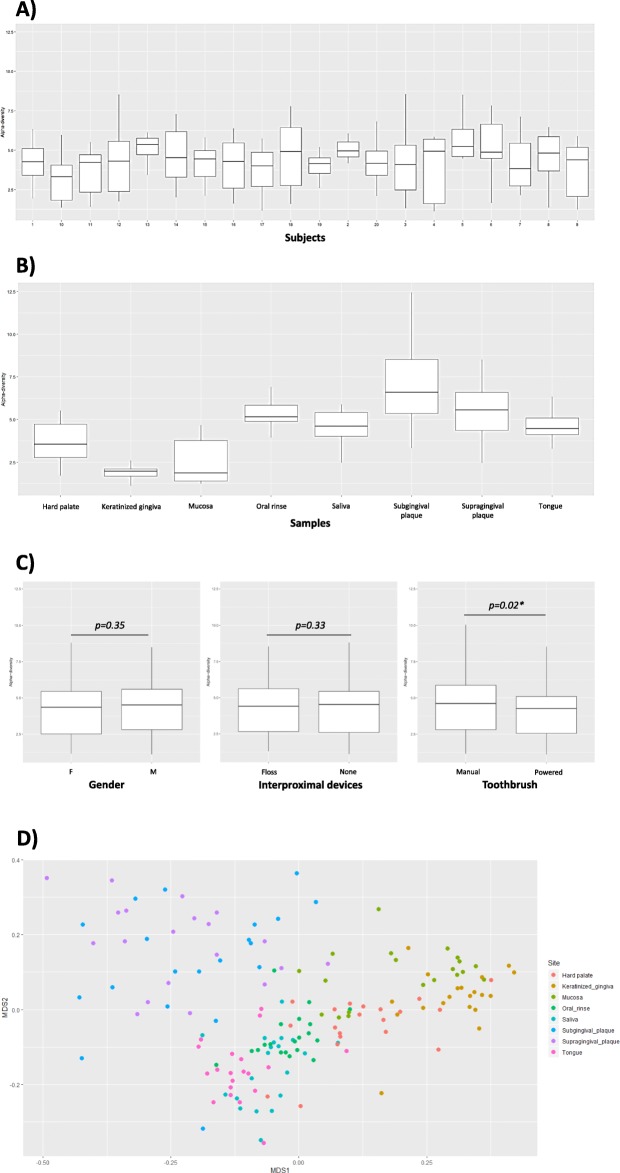
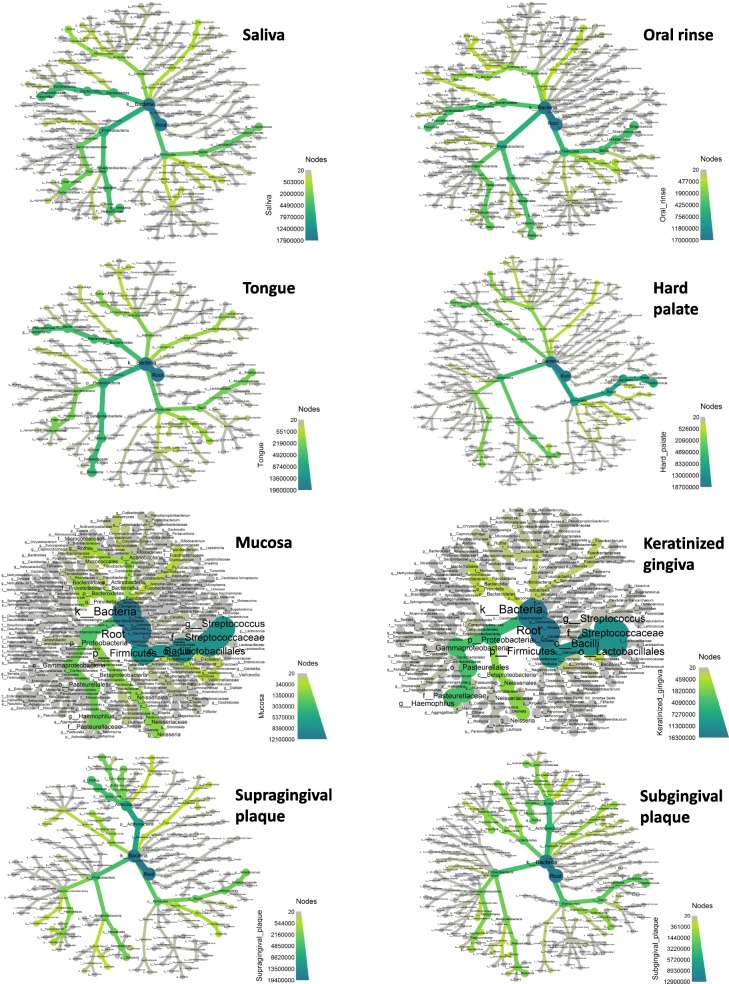
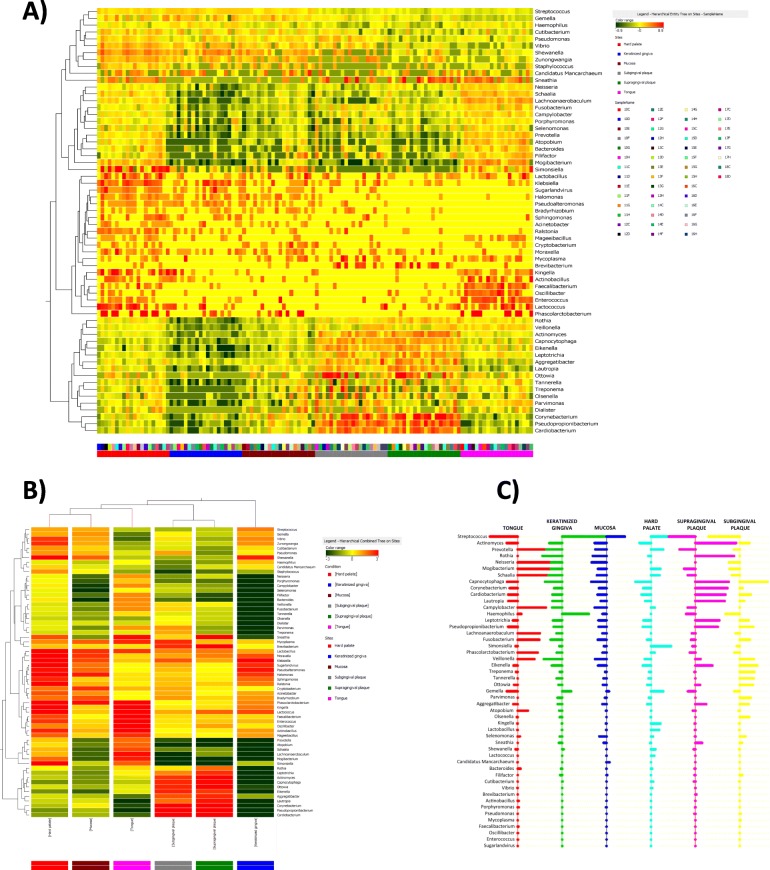
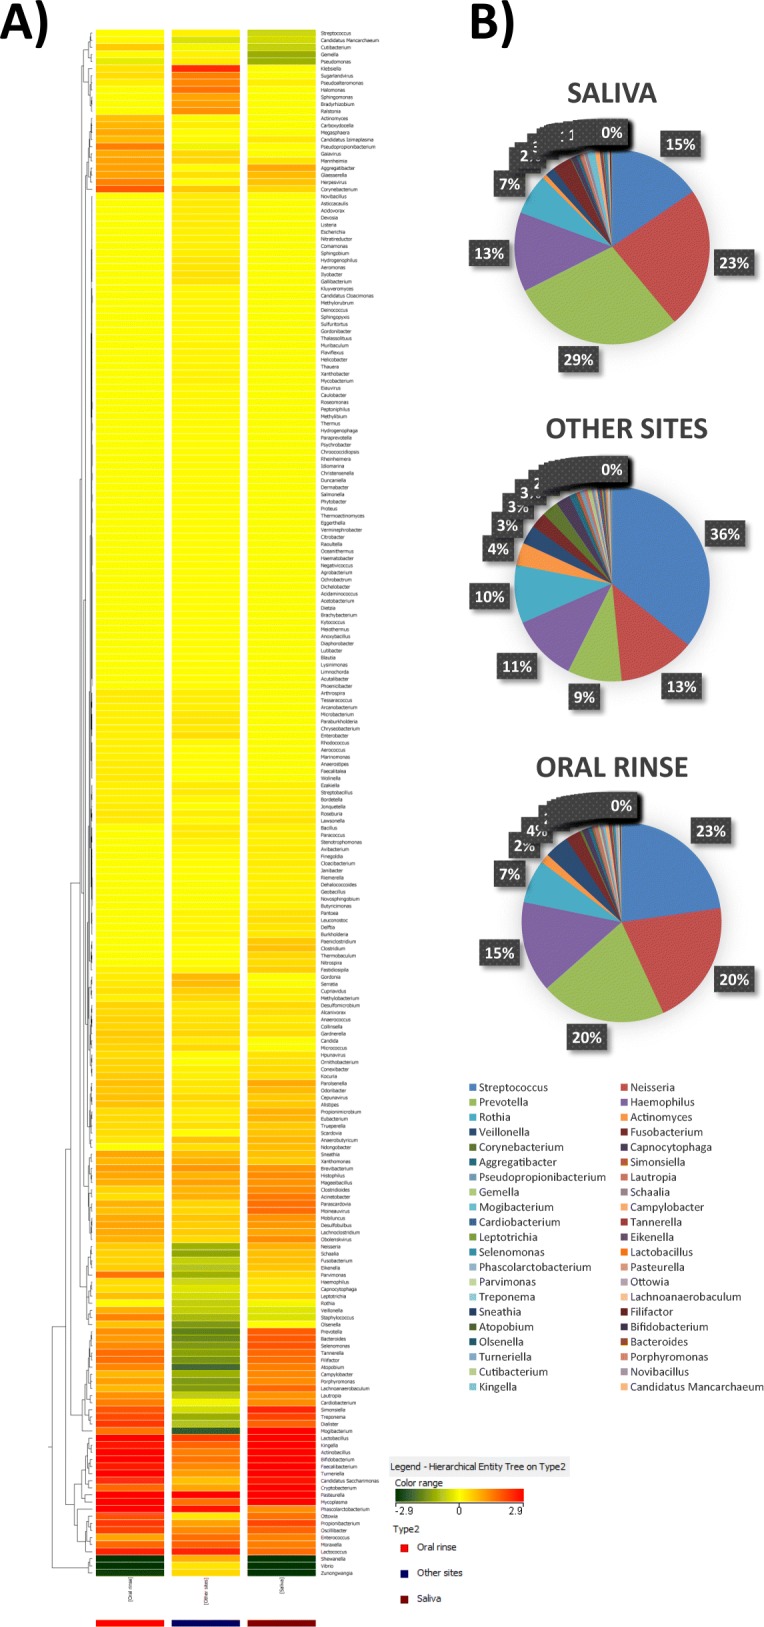
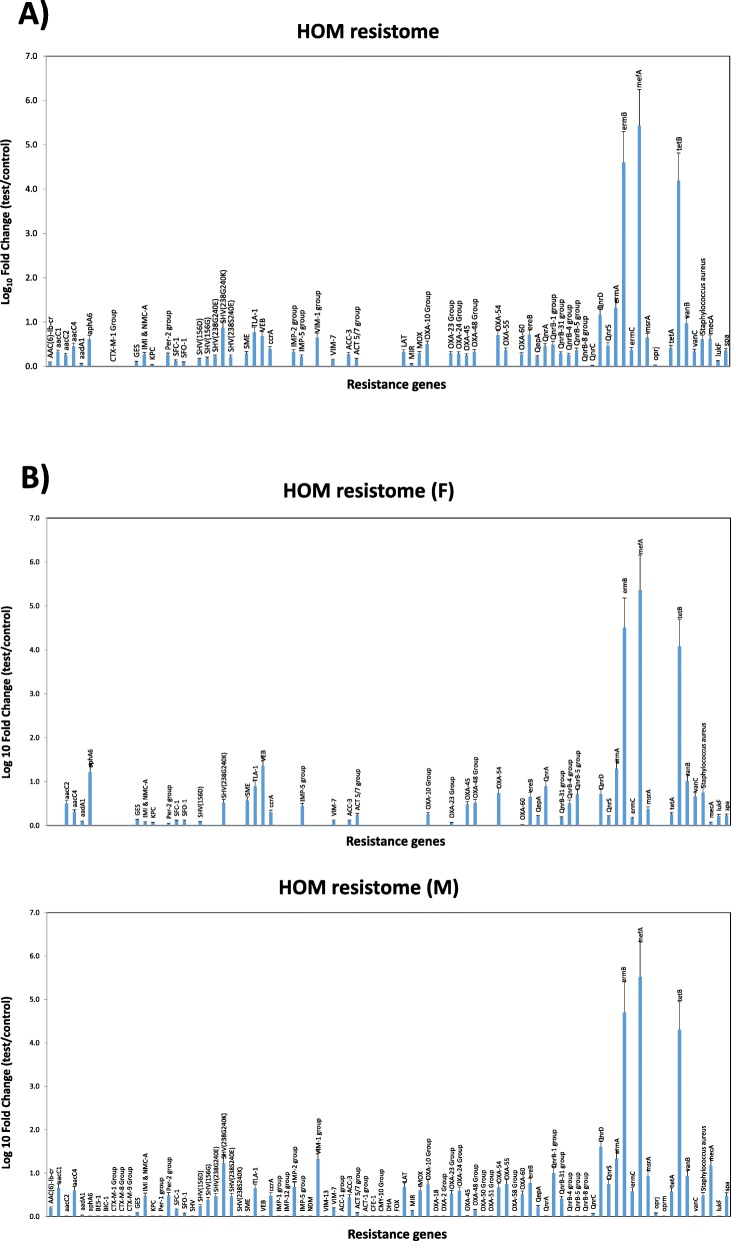
Results: The oral microbiome of twenty healthy subjects was analyzed by whole-genome sequencing (WGS) and real-time quantitative PCR microarray. Sampled oral micro-habitat included tongue dorsum, hard palate, buccal mucosa, keratinized gingiva, supragingival and subgingival plaque, and saliva with or without rinsing. Each sampled oral niche evidenced a different microbial community, including bacteria, fungi, and viruses. Alpha-diversity evidenced significant differences among the different sampled sites (p < 0.0001) but not among the enrolled subjects (p = 0.876), strengthening the notion of a recognizable HOM. Of note, oral rinse microbiome was more representative of the whole site-specific microbiomes, compared with that of saliva. Interestingly, HOM resistome included highly prevalent genes conferring resistance to macrolide, lincosamides, streptogramin, and tetracycline.

Conclusions: The data obtained in 20 subjects by WGS and microarray analysis provide for the first time a comprehensive view of HOM and its resistome, contributing to a deeper understanding of the composition of oral microbiome in the healthy subject, and providing an important reference for future studies, allowing to identify microbial signatures related to functional and metabolic alterations associated with diseases, potentially useful for targeted therapies and precision medicine.

Keywords: Oral microbiome; Resistome; Site-specific microbiome map; Whole-genome sequencing (WGS).


Conflict of interest statement

The authors declare no competing interests.

Figures

Fig. 1
Fig. 1
Relative abundance and distribution of the microbial genera detected in the oral cavity. a Heatmap representation of genera detected by WGS analysis in each sampled site from each enrolled subject. Hierarchical legends are also shown. b Heatmap representation of genera detected by WGS analysis in the clustered different sampled sites. Hierarchical legends are also shown. c Percentage distribution of detected genera in the different sampled sites of the oral cavity. d Prevalence of viruses detected in the oral cavity: upper panel, composition of the whole oral virome; lower panels, comparison between virus species prevalence detected in saliva, oral rinse, and site-specific sampled sites (other sites: hard and soft tissues). Results are expressed as the percentage of counts of each species on the total counts of the whole oral virome in all sampled sites
Fig. 2
Fig. 2
Alpha and beta-diversity analysis of HOM in collected samples. a Alpha-diversity values in each enrolled study participant. b Alpha-diversity values in all samples grouped for the specific sampling site. c Alpha-diversity values in sub-groups of study participants, subdivided for gender (left panel) (M, male; F, female), use of an interproximal device (tooth floss or none), and use of manual or powered toothbrush. Median line, interquartile range, and min-max values for each box-plot are shown. The p value as detected by Student’s t test is also shown in panel c. d Beta-diversity, as detected by Weighted Unifrac analysis, in the different site-specific samples from all the study participants. Multidimensional scaling (MDS) analysis of Weighted Unifrac similarity index is shown
Fig. 3
Fig. 3
Heat-tree representation of the relative abundance of the detected, subdivided for sampled sites. Phyla, classes, orders, families, genera, and species are represented. Node label, taxon name; node size, number of operational taxonomic units (OTUs); node color, abundance of the indicated phylum/class/family/genus/species (from grey to green, as reported in the color scale)
Fig. 4
Fig. 4
Heatmap representing the distribution of the most 62 representative HOM microbial genera. a Results obtained in the different sampled oral sites from all the study participants (excluding saliva samples). b Mean prevalence values of the most representative 62 genera in each collection site (excluding saliva). Hierarchical legends are also shown for both panels. c Microbial genera best defining the site-specificity of the oral microbiome, as detected by PAM analysis
Fig. 5
Fig. 5
Distribution and relative abundance of microbial genera in saliva, oral rinse and other sites. a Comparison of mean values detected in saliva, oral rinse, and other sites (hard and soft tissues). Hierarchical legend is also shown. b Comparison of mean relative abundance values detected in saliva, oral rinse and other sites (hard and soft tissues)
Fig. 6
Fig. 6
Characterization of the HOM resistome, as detected by qPCR microarray analysis. a HOM resistome in the whole study group. b Comparison of HOM resistomes of female (F) and male (M) study participants. I both panels the results are expressed as the mean value ± SD of Log10 fold change of oral rinse samples compared to negative controls, for each indicated resistance gene

References

    1. Backhed F, Fraser CM, Ringel Y, Sanders ME, Sartor RB, Sherman PM, Versalovic J, Young V, Finlay BB. Defining a healthy human gut microbiome: current concepts, future directions, and clinical applications. Cell Host Microbe. 2012;12(5):611–622. - PubMed
    1. Wade WG. The oral microbiome in health and disease. Pharmacol Res. 2013;69(1):137–143. - PubMed
    1. Franzosa EA, Huang K, Meadow JF, Gevers D, Lemon KP, Bohannan BJ, Huttenhower C. Identifying personal microbiomes using metagenomic codes. Proc Natl Acad Sci U S A. 2015;112(22):E2930–E2938. - PMC - PubMed
    1. Gillings MR, Paulsen IT, Tetu SG. Ecology and evolution of the human microbiota: fire, farming and antibiotics. Genes (Basel) 2015;6(3):841–857. - PMC - PubMed
    1. Abusleme L, Dupuy AK, Dutzan N, Silva N, Burleson JA, Strausbaugh LD, Gamonal J, Diaz PI. The subgingival microbiome in health and periodontitis and its relationship with community biomass and inflammation. ISME J. 2013;7(5):1016–1025. - PMC - PubMed

MeSH terms