Multi-HLA class II tetramer analyses of citrulline-reactive T cells and early treatment response in rheumatoid arthritis
- PMID: 32423478
- PMCID: PMC7236297
- DOI: 10.1186/s12865-020-00357-w
Multi-HLA class II tetramer analyses of citrulline-reactive T cells and early treatment response in rheumatoid arthritis
Abstract
Background: HLA class II tetramers can be used for ex vivo enumeration and phenotypic characterisation of antigen-specific CD4+ T cells. They are increasingly applied in settings like allergy, vaccination and autoimmune diseases. Rheumatoid arthritis (RA) is a chronic autoimmune disorder for which many autoantigens have been described.
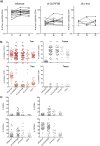
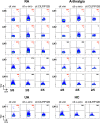
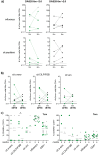
Results: Using multi-parameter flow cytometry, we developed a multi-HLA class II tetramer approach to simultaneously study several antigen specificities in RA patient samples. We focused on previously described citrullinated HLA-DRB1*04:01-restricted T cell epitopes from α-enolase, fibrinogen-β, vimentin as well as cartilage intermediate layer protein (CILP). First, we examined inter-assay variability and the sensitivity of the assay in peripheral blood from healthy donors (n = 7). Next, we confirmed the robustness and sensitivity in a cohort of RA patients with repeat blood draws (n = 14). We then applied our method in two different settings. We assessed lymphoid tissue from seropositive arthralgia (n = 5) and early RA patients (n = 5) and could demonstrate autoreactive T cells in individuals at risk of developing RA. Lastly, we studied peripheral blood from early RA patients (n = 10) and found that the group of patients achieving minimum disease activity (DAS28 < 2.6) at 6 months follow-up displayed a decrease in the frequency of citrulline-specific T cells.
Conclusions: Our study demonstrates the development of a sensitive tetramer panel allowing simultaneous characterisation of antigen-specific T cells in ex vivo patient samples including RA 'at risk' subjects. This multi-tetramer approach can be useful for longitudinal immune-monitoring in any disease with known HLA-restriction element and several candidate antigens.
Keywords: Autoimmune disease; Autoreactive CD4+ T lymphocytes; Citrullination; Multi-MHC class II tetramer assay.
Conflict of interest statement
The authors declare that they have no competing interests.
Figures


Similar articles
-
Antigen-specific T-cell frequency and phenotype mirrors disease activity in DRB1*04:04+ rheumatoid arthritis patients.Clin Exp Immunol. 2025 Jan 21;219(1):uxae102. doi: 10.1093/cei/uxae102. Clin Exp Immunol. 2025. PMID: 39492692
-
Citrulline-specific Th1 cells are increased in rheumatoid arthritis and their frequency is influenced by disease duration and therapy.Arthritis Rheumatol. 2014 Jul;66(7):1712-22. doi: 10.1002/art.38637. Arthritis Rheumatol. 2014. PMID: 24665079 Free PMC article.
-
Memory T cells specific to citrullinated α-enolase are enriched in the rheumatic joint.J Autoimmun. 2018 Aug;92:47-56. doi: 10.1016/j.jaut.2018.04.004. Epub 2018 May 28. J Autoimmun. 2018. PMID: 29853344 Free PMC article.
-
Anti-citrullinated peptides as autoantigens in rheumatoid arthritis-relevance to treatment.Autoimmun Rev. 2014 Nov;13(11):1114-20. doi: 10.1016/j.autrev.2014.08.012. Epub 2014 Aug 23. Autoimmun Rev. 2014. PMID: 25182207 Review.
-
Autoimmunity to specific citrullinated proteins gives the first clues to the etiology of rheumatoid arthritis.Immunol Rev. 2010 Jan;233(1):34-54. doi: 10.1111/j.0105-2896.2009.00850.x. Immunol Rev. 2010. PMID: 20192991 Review.
Cited by
-
Characteristics of the (Auto)Reactive T Cells in Rheumatoid Arthritis According to the Immune Epitope Database.Int J Mol Sci. 2023 Feb 21;24(5):4296. doi: 10.3390/ijms24054296. Int J Mol Sci. 2023. PMID: 36901730 Free PMC article. Review.
-
Antigen-specific T-cell frequency and phenotype mirrors disease activity in DRB1*04:04+ rheumatoid arthritis patients.Clin Exp Immunol. 2025 Jan 21;219(1):uxae102. doi: 10.1093/cei/uxae102. Clin Exp Immunol. 2025. PMID: 39492692
-
Multifaceted immune dysregulation characterizes individuals at-risk for rheumatoid arthritis.Nat Commun. 2023 Nov 22;14(1):7637. doi: 10.1038/s41467-023-43091-8. Nat Commun. 2023. PMID: 37993439 Free PMC article.
-
Ultrasound-guided lymph node biopsy sampling to study the immunopathogenesis of rheumatoid arthritis: a well-tolerated valuable research tool.Arthritis Res Ther. 2022 Feb 3;24(1):36. doi: 10.1186/s13075-022-02728-7. Arthritis Res Ther. 2022. PMID: 35115042 Free PMC article.
-
Arthritis progressors have a decreased frequency of circulating autoreactive T cells during the at-risk phase of rheumatoid arthritis.RMD Open. 2024 Nov 18;10(4):e004510. doi: 10.1136/rmdopen-2024-004510. RMD Open. 2024. PMID: 39557489 Free PMC article.
References
-
- Altman JD, Moss PA, Goulder PJ, Barouch DH, McHeyzer-Williams MG, Bell JI, et al. Phenotypic analysis of antigen-specific T lymphocytes. Science. 1996;274(5284):94–96. - PubMed
Publication types
MeSH terms
Substances
Grants and funding
- R-481771/Reumatikerförbundet/International
- FAI-2016-0312/Stiftelsen Konung Gustaf V:s 80-årsfond/International
- FAI-2016-0312/Stiftelsen Konung Gustaf V:s 80-årsfond/International
- 2015-02900/Vetenskapsrådet/International
- BTCure 115142/Innovative Medicines Initiative/International
- RTCure 777357/Innovative Medicines Initiative/International
- BTCure 115142/Innovative Medicines Initiative/International
- FP7-HEALTH-F2-2012-305549/FP7 Health/International
- 11-1-308/ReumaNederland/International
- 14-2-403/ReumaNederland/International
- not applicable/Margareta af Ugglas Foundation/International
LinkOut - more resources
Full Text Sources
Medical
Research Materials

