

Genetic Basis of Inherited Retinal Disease in a Molecularly Characterized Cohort of More Than 3000 Families from the United Kingdom
- PMID: 32423767
- PMCID: PMC7520514
- DOI: 10.1016/j.ophtha.2020.04.008
Genetic Basis of Inherited Retinal Disease in a Molecularly Characterized Cohort of More Than 3000 Families from the United Kingdom
Abstract
Purpose: In a large cohort of molecularly characterized inherited retinal disease (IRD) families, we investigated proportions with disease attributable to causative variants in each gene.
Design: Retrospective study of electronic patient records.
Participants: Patients and relatives managed in the Genetics Service of Moorfields Eye Hospital in whom a molecular diagnosis had been identified.
Methods: Genetic screening used a combination of single-gene testing, gene panel testing, whole exome sequencing, and more recently, whole genome sequencing. For this study, genes listed in the Retinal Information Network online resource (https://sph.uth.edu/retnet/) were included. Transcript length was extracted for each gene (Ensembl, release 94).
Main outcome measures: We calculated proportions of families with IRD attributable to variants in each gene in the entire cohort, a cohort younger than 18 years, and a current cohort (at least 1 patient encounter between January 1, 2017, and August 2, 2019). Additionally, we explored correlation between numbers of families and gene transcript length.
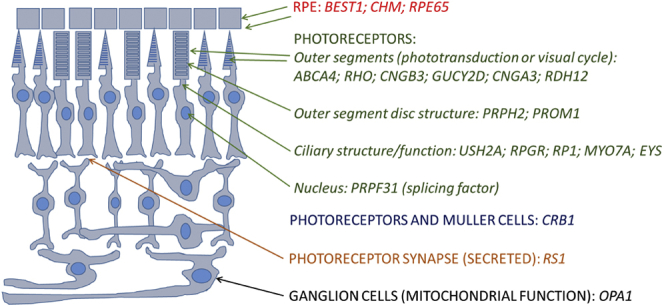
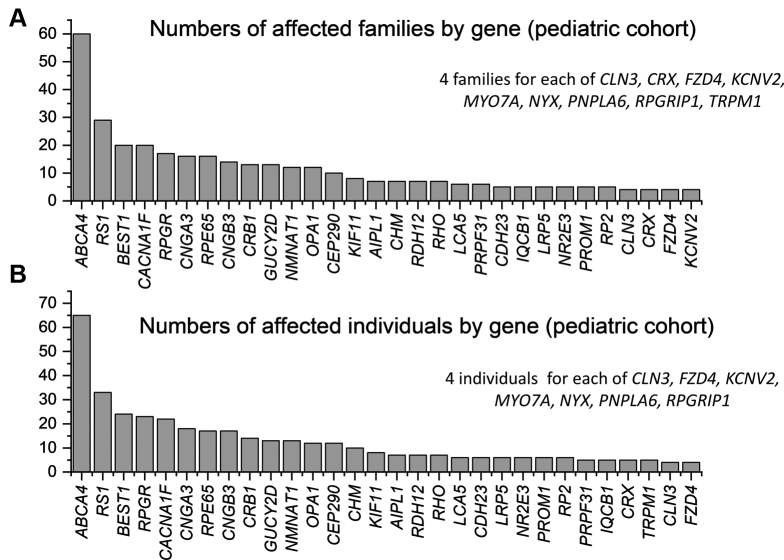
Results: We identified 3195 families with a molecular diagnosis (variants in 135 genes), including 4236 affected individuals. The pediatric cohort comprised 452 individuals from 411 families (66 genes). The current cohort comprised 2614 families (131 genes; 3130 affected individuals). The 20 most frequently implicated genes overall (with prevalence rates per families) were as follows: ABCA4 (20.8%), USH2A (9.1%), RPGR (5.1%), PRPH2 (4.6%), BEST1 (3.9%), RS1 (3.5%), RP1 (3.3%), RHO (3.3%), CHM (2.7%), CRB1 (2.1%), PRPF31 (1.8%), MY07A (1.7%), OPA1 (1.6%), CNGB3 (1.4%), RPE65 (1.2%), EYS (1.2%), GUCY2D (1.2%), PROM1 (1.2%), CNGA3 (1.1%), and RDH12 (1.1%). These accounted for 71.8% of all molecularly diagnosed families. Spearman coefficients for correlation between numbers of families and transcript length were 0.20 (P = 0.025) overall and 0.27 (P = 0.017), -0.17 (P = 0.46), and 0.71 (P = 0.047) for genes in which variants exclusively cause recessive, dominant, or X-linked disease, respectively.
Conclusions: Our findings help to quantify the burden of IRD attributable to each gene. More than 70% of families showed pathogenic variants in 1 of 20 genes. Transcript length (relevant to gene delivery strategies) correlated significantly with numbers of affected families (but not for dominant disease).
Copyright © 2020 American Academy of Ophthalmology. Published by Elsevier Inc. All rights reserved.
Figures


References
Publication types
MeSH terms
Substances
Grants and funding
LinkOut - more resources
Full Text Sources
Other Literature Sources
Medical
Research Materials
