In Vivo Diffusion Tensor Imaging in Acute and Subacute Phases of Mild Traumatic Brain Injury in Rats
- PMID: 32424056
- PMCID: PMC7307627
- DOI: 10.1523/ENEURO.0476-19.2020
In Vivo Diffusion Tensor Imaging in Acute and Subacute Phases of Mild Traumatic Brain Injury in Rats
Abstract
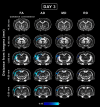
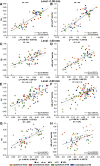
Mild traumatic brain injury (mTBI) is the most common form of TBI with 10-25% of the patients experiencing long-lasting symptoms. The potential of diffusion tensor imaging (DTI) for evaluating microstructural damage after TBI is widely recognized, but the interpretation of DTI changes and their relationship with the underlying tissue damage is unclear. We studied how both axonal damage and gliosis contribute to DTI alterations after mTBI. We induced mTBI using the lateral fluid percussion (LFP) injury model in adult male Sprague Dawley rats and scanned them at 3 and 28 d post-mTBI. To characterize the DTI findings in the tissue, we assessed the histology by performing structure tensor (ST)-based analysis and cell counting on myelin-stained and Nissl-stained sections, respectively. In particular, we studied the contribution of two tissue components, myelinated axons and cellularity, to the DTI changes. Fractional anisotropy (FA), mean diffusivity (MD), and axial diffusivity (AD) were decreased in both white and gray matter areas in the acute phase post-mTBI, mainly at the primary lesion site. In the subacute phase, FA and AD were decreased in the white matter, external capsule, corpus callosum, and internal capsule. Our quantitative histologic assessment revealed axonal damage and gliosis throughout the brain in both white and gray matter, consistent with the FA and AD changes. Our findings suggest that the usefulness of in vivo DTI is limited in its detection of secondary damage distal to the primary lesion, while at the lesion site, DTI detected progressive microstructural damage in the white and gray matter after mTBI.
Keywords: axonal damage; cell counting; diffusion tensor imaging; inflammation; mild traumatic brain injury; secondary damage; structure tensor.
Copyright © 2020 San Martín Molina et al.
Figures


Similar articles
-
Diffusion tensor imaging (DTI) findings in adult civilian, military, and sport-related mild traumatic brain injury (mTBI): a systematic critical review.Brain Imaging Behav. 2018 Apr;12(2):585-612. doi: 10.1007/s11682-017-9708-9. Brain Imaging Behav. 2018. PMID: 28337734
-
Acute White Matter Tract Damage after Frontal Mild Traumatic Brain Injury.J Neurotrauma. 2017 Jan 15;34(2):291-299. doi: 10.1089/neu.2016.4407. Epub 2016 Jun 20. J Neurotrauma. 2017. PMID: 27138134 Free PMC article.
-
Diffusion Tensor Imaging Reveals Elevated Diffusivity of White Matter Microstructure that Is Independently Associated with Long-Term Outcome after Mild Traumatic Brain Injury: A TRACK-TBI Study.J Neurotrauma. 2022 Oct;39(19-20):1318-1328. doi: 10.1089/neu.2021.0408. Epub 2022 Jul 18. J Neurotrauma. 2022. PMID: 35579949 Free PMC article.
-
Evaluating spatiotemporal microstructural alterations following diffuse traumatic brain injury.Neuroimage Clin. 2020;25:102136. doi: 10.1016/j.nicl.2019.102136. Epub 2019 Dec 14. Neuroimage Clin. 2020. PMID: 31865019 Free PMC article.
-
The role of diffusion tensor imaging and fractional anisotropy in the evaluation of patients with idiopathic normal pressure hydrocephalus: a literature review.Neurosurg Focus. 2016 Sep;41(3):E12. doi: 10.3171/2016.6.FOCUS16192. Neurosurg Focus. 2016. PMID: 27581308 Review.
Cited by
-
A one year longitudinal study of cortical myelination changes following pediatric mild traumatic brain injury.Neuroimage Clin. 2025 Jun 30;48:103837. doi: 10.1016/j.nicl.2025.103837. Online ahead of print. Neuroimage Clin. 2025. PMID: 40651061 Free PMC article.
-
Histopathological modeling of status epilepticus-induced brain damage based on in vivo diffusion tensor imaging in rats.Front Neurosci. 2022 Jul 29;16:944432. doi: 10.3389/fnins.2022.944432. eCollection 2022. Front Neurosci. 2022. PMID: 35968364 Free PMC article.
-
A multiscale tissue assessment in a rat model of mild traumatic brain injury.J Neuropathol Exp Neurol. 2022 Dec 19;82(1):71-83. doi: 10.1093/jnen/nlac100. J Neuropathol Exp Neurol. 2022. PMID: 36331507 Free PMC article.
-
Stem Cell Therapy for Sequestration of Traumatic Brain Injury-Induced Inflammation.Int J Mol Sci. 2022 Sep 7;23(18):10286. doi: 10.3390/ijms231810286. Int J Mol Sci. 2022. PMID: 36142198 Free PMC article. Review.
-
Evaluating the therapeutic effect of LIPUS in the early stage of traumatic brain injury using FA and T2* in rats.Aging (Albany NY). 2024 Aug 12;16(15):11744-11754. doi: 10.18632/aging.206060. Epub 2024 Aug 12. Aging (Albany NY). 2024. PMID: 39137314 Free PMC article.
References
-
- Amyot F, Arciniegas DB, Brazaitis MP, Curley KC, Diaz-Arrastia R, Gandjbakhche A, Herscovitch P, Hinds SR, Manley GT, Pacifico A, Razumovsky A, Riley J, Salzer W, Shih R, Smirniotopoulos JG, Stocker D (2015) A Review of the effectiveness of neuroimaging modalities for the detection of traumatic brain injury. J Neurotrauma 32:1693–1721. 10.1089/neu.2013.3306 - DOI - PMC - PubMed
Publication types
MeSH terms
LinkOut - more resources
Full Text Sources
Medical
