. 2020 May;30(5):776-789.
doi: 10.1101/gr.256958.119. Epub 2020 May 18.

Single-cell-resolution transcriptome map of human, chimpanzee, bonobo, and macaque brains

Affiliations

Single-cell-resolution transcriptome map of human, chimpanzee, bonobo, and macaque brains

Ekaterina Khrameeva et al. Genome Res. 2020 May.

Abstract

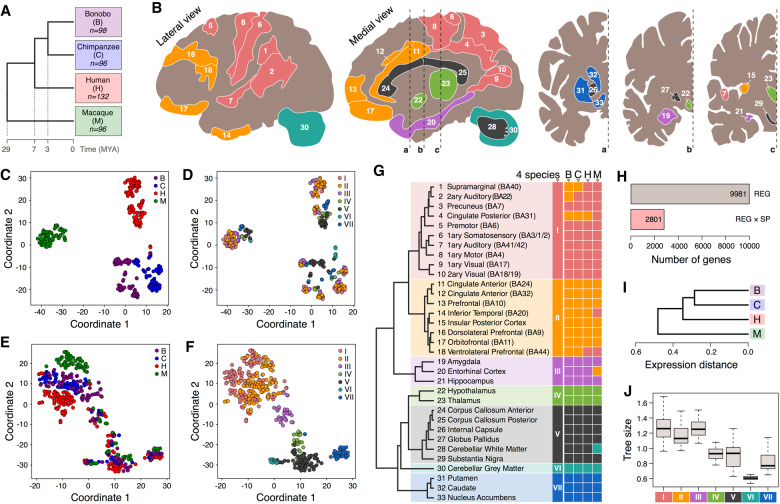
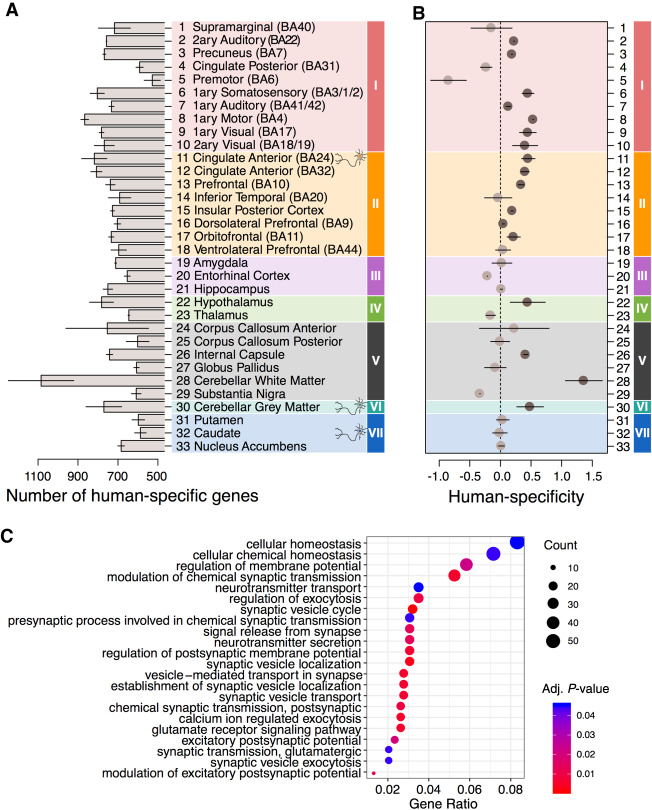
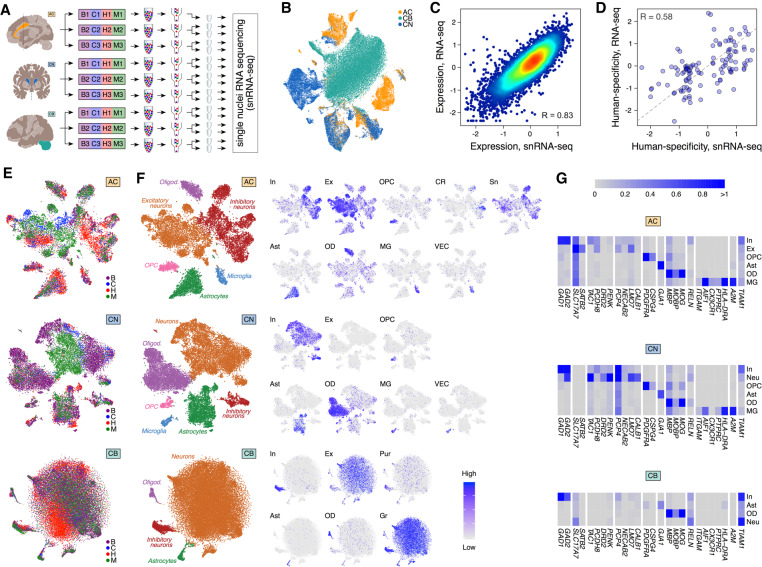
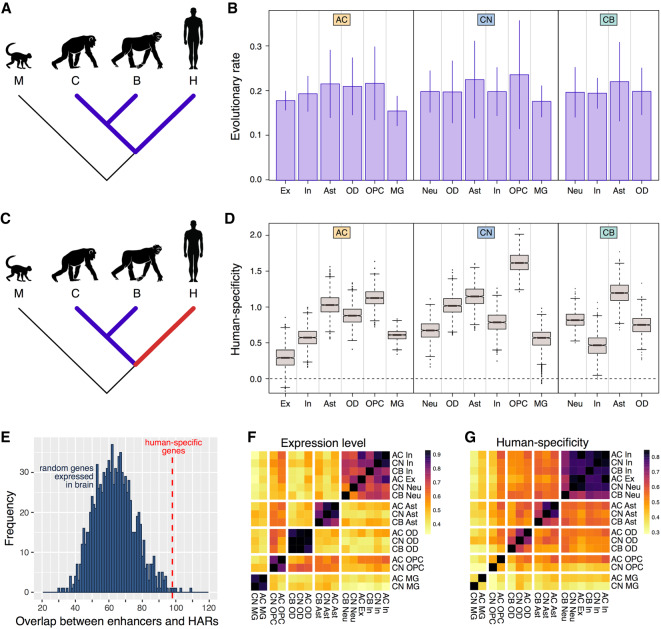
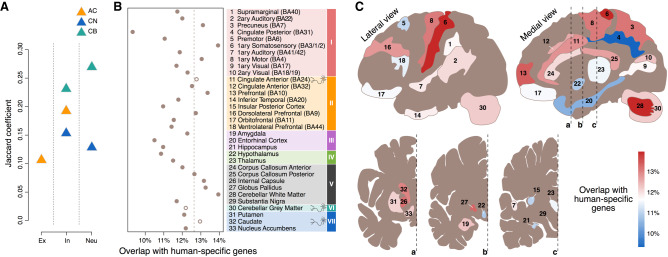
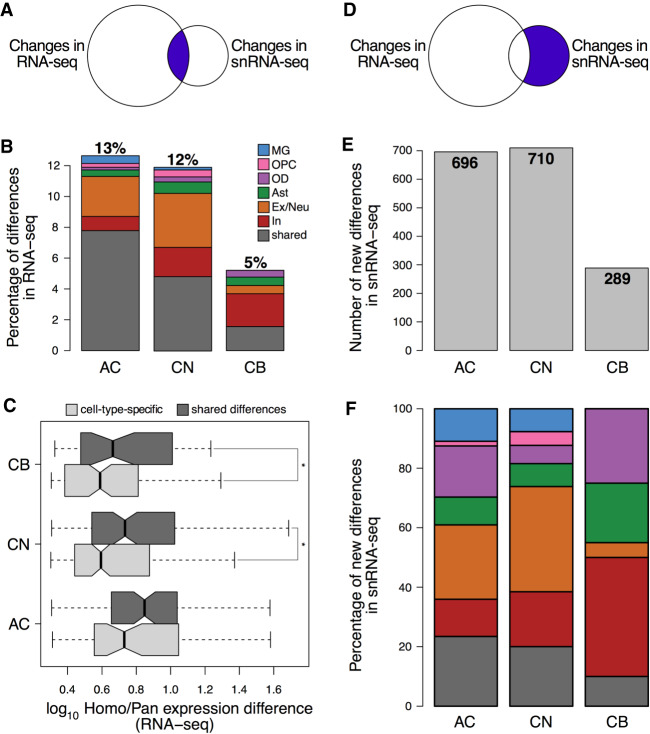
Identification of gene expression traits unique to the human brain sheds light on the molecular mechanisms underlying human evolution. Here, we searched for uniquely human gene expression traits by analyzing 422 brain samples from humans, chimpanzees, bonobos, and macaques representing 33 anatomical regions, as well as 88,047 cell nuclei composing three of these regions. Among 33 regions, cerebral cortex areas, hypothalamus, and cerebellar gray and white matter evolved rapidly in humans. At the cellular level, astrocytes and oligodendrocyte progenitors displayed more differences in the human evolutionary lineage than the neurons. Comparison of the bulk tissue and single-nuclei sequencing revealed that conventional RNA sequencing did not detect up to two-thirds of cell-type-specific evolutionary differences.


Figures

Figure 1.
Figure 1.
Gene expression variation analysis in 33 brain regions. (A) Phylogenetic relationship among analyzed species. Numbers indicate the number of analyzed brain samples. (B) Anatomical localization of 33 analyzed brain regions within the human brain. Colors represent expression-based regional clusters, defined in G. (CF) t-SNE plots based on expression variation among all 422 analyzed samples: (C,D) the total variation; (E,F) the residual variation after removal of the average species’ and individual differences. Each circle represents a sample. Circle colors represent species (C,E) or expression-based regional clusters (D,F). (G) Unsupervised hierarchical clustering of brain regions based on the average gene expression values of all 11,176 detected genes in four species. Regions within each species are assigned to the nearest cluster. The clustering based on each individual sample is shown in Supplemental Figure S3. (H) Numbers of genes differentially expressed among brain regions (REG), or among species with a significant dependence on the region (REG × SP) in ANOVA. (I) Average phylogenetic tree reconstructed based on the expression differences identified using ANOVA with species and regions used as factors. The trees reconstructed for each brain region are shown in Supplemental Figure S5. (J) Total branch length calculated for the reconstructed phylogenetic trees for each of the 33 brain regions grouped by expression-based regional clusters I–VII, defined in G.
Figure 2.
Figure 2.
Region-dependent analysis of human-specific gene expression differences. (A) Numbers of genes showing human-specific expression differences in each brain region. The differences were defined as those showing twofold greater human-macaque expression difference relative to the chimpanzee-macaque or bonobo-macaque difference. The bars show the mean of the chimpanzee-based and bonobo-based comparisons. The error bars span the difference between chimpanzee-based and bonobo-based estimates. Colors represent expression-based clusters of brain regions defined in Figure 1G. (B) The human-specificity ratio of gene expression estimated in each brain region as the ratio of human-specific expression differences and chimpanzee-specific or bonobo-specific expression differences. Circles show the mean of chimpanzee-based and bonobo-based comparisons, and lines span the difference between the two estimates. Darker circles mark brain regions showing an excess of human-specific expression differences compared to both ape species. (C) Top Gene Ontology (GO) functional terms enriched in the human-specific expression differences present in more than 10 of the 33 brain regions. The size of circles reflects the proportion of genes within the GO term among genes detected in the brain region using snRNA-seq data (Gene Ratio) (Yu et al. 2012). The color of circles indicates the BH-adjusted enrichment P-value.
Figure 3.
Figure 3.
Single-nuclei transcriptomics in three brain regions. (A) Design of the snRNA-seq experiment. (B) t-SNE plot of 88,047 single nuclei colored by brain regions after integration with Seurat 3.0 (Stuart et al. 2019). (C) Correlation of gene expression levels between bulk RNA-seq and averaged snRNA-seq data sets in human AC. Dots represent genes, and colors show the density of the dots. (D) Correlation of human-specificity ratios between bulk RNA-seq and averaged snRNA-seq data sets in AC for genes passing the human-chimpanzee difference cutoff in either data set. Each dot represents a gene. The dashed line indicates the linear relationship with a slope of 1 and an intersect of 0. (E) t-SNE plot of nuclei colored by species in each of the three brain regions after integration with Seurat 3.0 (Stuart et al. 2019). (F) The cumulative cell-type annotation of t-SNE clusters (left) and projection of expression levels averaged across cell-type marker genes onto the t-SNE plots. Abbreviations next to t-SNE plots mark cell types: (In) inhibitory neurons; (Ex) excitatory neurons; (Sn) spindle neurons; (Pur) Purkinje cells; (OPC) oligodendrocyte progenitor cells; (Ast) astrocytes; (OD) oligodendrocytes; (CR) Cajal-Retzius cells; (MG) microglia; (VEC) vascular endothelial cells. (G) Average expression levels of cell-type marker genes in t-SNE clusters. The same marker genes were used in F.
Figure 4.
Figure 4.
Cell-type-based analysis of the expression evolution in three brain regions. (A) Phylogenetic tree highlighting the branches used in the evolutionary rate analysis. (B) The evolutionary rate of cell types within each brain region. Error bars mark the standard deviation of the average estimates. (C) Phylogenetic tree highlighting the branches used in the human-specificity ratio analysis. (D) Human-specificity ratio calculated within each t-SNE cluster in each of the three brain regions. The ratio represents the number of genes with human-specific expression divided by the number of genes with chimpanzee-specific and bonobo-specific expression. Boxes mark the median and the first and the third quartiles of the distribution, and whiskers extend to the 1.5 interquartile ranges. The cell types are abbreviated as in Figure 3F. (E) Overlap between enhancers linked to 1271 genes showing human-specific expression in snRNA-seq data and brain-active cis-regulatory elements located in HARs (Vermunt et al. 2016). The histogram represents the distribution of the overlap values calculated by random subsampling of 1271 genes from the 9138 genes expressed in the brain 1000 times. The red dashed line marks an actual overlap (n = 98). (F) The expression level similarity among t-SNE clusters based on the average gene expression levels within clusters in humans. The colors in F and G indicate Pearson correlation coefficients. (G) The similarity of human-specificity ratio estimates among t-SNE clusters calculated based on the comparison to chimpanzee and bonobo in 1000 bootstraps of cells.
Figure 5.
Figure 5.
Deconvolution of bulk human-specific expression differences using neuronal evolutionary signature. (A) Overlap of human-specific genes, defined as those showing twofold greater human-macaque expression difference relative to the chimpanzee-macaque and bonobo-macaque difference, between bulk RNA-seq and snRNA-seq data sets for genes preferentially expressed in a specific neuronal subtype (Supplemental Table S5). Colors indicate brain regions. The x-axis labels indicate neuronal subtypes. (B) Percentages of genes showing human-specific expression in each brain region in bulk RNA-seq data set overlapping with genes showing human-specific expression in neuronal subtypes in snRNA-seq data. Empty circles indicate the three brain regions used in the snRNA-seq experiment. The dashed line represents an average overlap for three brain regions used in the snRNA-seq experiment. (C) Anatomical localization of 33 regions in the human brain colored according to the overlap between human-specific expression differences in bulk RNA-seq and in neuronal subtypes.
Figure 6.
Figure 6.
Gene expression differences detected by snRNA-seq and bulk RNA-seq. (A) Schematic representation and (B) percentage and the cell type specificity of the expression differences present in bulk RNA-seq and snRNA-seq, defined as absolute greater than twofold difference in human samples compared to a pool of chimpanzee and bonobo samples (Methods). (C) The amplitude of expression differences detected in one (specific) or multiple (shared) cell types in bulk RNA-seq. (*) P < 0.05, one-sided t-test. (D) Schematic representation, (E) numbers, and (F) cell type specificity of the expression differences solely detected by snRNA-seq. Color as in A.
Figure 7.
Figure 7.
Gene expression differences detected by IHC. (A) The mean log10-transformed expression level of NFAT5 mRNA in AC astrocytes (squares), and the standard deviation of the mean (horizontal lines). (B) The log10-transformed read counts normalized for the median of NFAT5 mRNA in bulk AC data. Circles indicate individual samples. Average fluorescent intensities of NFAT5 IHC signal in the astrocytic processes of macaques, chimpanzees, and humans across cortical layers (C) and at different cortical depth (D). Error bars show the standard deviation of the mean. (***) P < 0.0005; (**) P < 0.005; (*) P < 0.05, two-sided t-test, Holm-Sidak correction; (H/C) human-chimpanzee comparison; (H/M) human-macaque comparison. Symbols indicate cortical sections located at increasing depth, depicted in panel F. (E) IHC (upper) and its binarized representation (lower) of NFAT5 protein in the uppermost layer of AC sections. (F) Immunostaining (left) and its binarized representation (right) of NFAT5 protein in the three upper layers of AC sections in macaques, chimpanzees, and humans (for GFAP and DAPI staining of these sections, see also Supplemental Figs. S45–S49). Sections A–F indicate segmentation areas used in the analysis presented in panel D. (Scale bar) 100 µm.

References

    1. Allman JM, Tetreault NA, Hakeem AY, Park S. 2011. The von Economo neurons in apes and humans. Am J Hum Biol 23: 5–21. 10.1002/ajhb.21136 - DOI - PubMed
    1. Barger N, Stefanacci L, Schumann CM, Sherwood CC, Annese J, Allman JM, Buckwalter JA, Hof PR, Semendeferi K. 2012. Neuronal populations in the basolateral nuclei of the amygdala are differentially increased in humans compared with apes: a stereological study. J Comp Neurol 520: 3035–3054. 10.1002/cne.23118 - DOI - PMC - PubMed
    1. Berto S, Mendizabal I, Usui N, Toriumi K, Chatterjee P, Douglas C, Tamminga CA, Preuss TM, Yi SV, Konopka G. 2019. Accelerated evolution of oligodendrocytes in the human brain. Proc Natl Acad Sci 116: 24334–24342. 10.1073/pnas.1907982116 - DOI - PMC - PubMed
    1. Boldog E, Bakken TE, Hodge RD, Novotny M, Aevermann BD, Baka J, Bordé S, Close JL, Diez-Fuertes F, Ding S-L, et al. 2018. Transcriptomic and morphophysiological evidence for a specialized human cortical GABAergic cell type. Nat Neurosci 21: 1185–1195. 10.1038/s41593-018-0205-2 - DOI - PMC - PubMed
    1. Caceres M, Lachuer J, Zapala MA, Redmond JC, Kudo L, Geschwind DH, Lockhart DJ, Preuss TM, Barlow C. 2003. Elevated gene expression levels distinguish human from non-human primate brains. Proc Natl Acad Sci 100: 13030–13035. 10.1073/pnas.2135499100 - DOI - PMC - PubMed

Publication types