. 2020 Jun 2;117(22):12143-12154.
doi: 10.1073/pnas.1919528117. Epub 2020 May 18.

Split-TurboID enables contact-dependent proximity labeling in cells

Affiliations

Split-TurboID enables contact-dependent proximity labeling in cells

Kelvin F Cho et al. Proc Natl Acad Sci U S A. .

Abstract

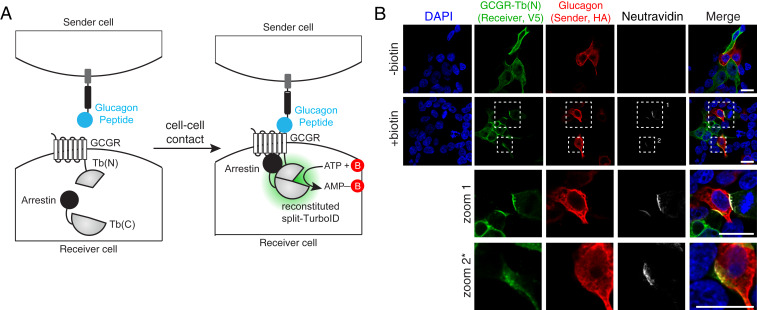
Proximity labeling catalyzed by promiscuous enzymes, such as TurboID, have enabled the proteomic analysis of subcellular regions difficult or impossible to access by conventional fractionation-based approaches. Yet some cellular regions, such as organelle contact sites, remain out of reach for current PL methods. To address this limitation, we split the enzyme TurboID into two inactive fragments that recombine when driven together by a protein-protein interaction or membrane-membrane apposition. At endoplasmic reticulum-mitochondria contact sites, reconstituted TurboID catalyzed spatially restricted biotinylation, enabling the enrichment and identification of >100 endogenous proteins, including many not previously linked to endoplasmic reticulum-mitochondria contacts. We validated eight candidates by biochemical fractionation and overexpression imaging. Overall, split-TurboID is a versatile tool for conditional and spatially specific proximity labeling in cells.

Keywords: ER–mitochondria contacts; proximity labeling; split-TurboID.


Conflict of interest statement

The authors declare no competing interest.

Figures

Fig. 1.
Fig. 1.
Engineering split-TurboID. (A) Schematic of split-TurboID reconstitution using the chemically inducible FRB-FKBP dimerization system. Upon rapamycin treatment, two inactive fragments of TurboID reconstitute to form an active enzyme capable of generating biotin-5′-AMP for promiscuous proximity-dependent labeling. N-terminal fragments [Tb(N)] were fused to FKBP and V5. C-terminal fragments [Tb(C)] were fused to HA, HaloTag, and FRB. The HaloTag was used for initial screening as previous studies have shown that it can improve fragment stability (18). (B) Split sites tested. Ten split sites were tested in the first round. In the second round, four additional sites around 73/74 were tested. Split sites are indicated as red lines along the TurboID protein sequence. The α-helices are shown in blue and the β-sheets are shown in purple. (C) Results of split site screen. Split-BioID (split at E256/G257) (20) and Contact-ID (split at G78/G79) (21) are shown for comparison. Each fragment pair was tested in HEK293T cells with 24 h biotin incubation in the presence or absence of rapamycin. At right, cells expressing full-length (FL) TurboID were incubated with biotin for 30 min. FL BioID was incubated with biotin for 24 h. Cell lysates were analyzed by streptavidin blotting as in D, and quantification was performed by dividing the streptavidin sum intensity by the anti-V5 intensity. Values were normalized to that of FL TurboID. (D) Streptavidin blot comparing our best split-TurboIDs to FL TurboID and BioID, and the previously described split-BioID and Contact-ID (20, 21). Labeling conditions were the same as in C. For each construct pair, lanes are shown with both fragments present (B), N-terminal fragment only (N), or C-terminal fragment only (C). Anti-V5 and anti-HA blotting show expression levels of N-terminal fragments (V5-tagged), C-terminal fragments (HA-tagged), and full-length enzymes (V5-tagged). Dashed lines indicate separate blots performed at the same time and developed simultaneously. Asterisks indicate ligase self-biotinylation. Full blots are shown in SI Appendix, Fig. S1A. (E) N- and C-terminal fragments (blue and purple, respectively) of split-TurboID (73/74), depicted on a structure of E. coli biotin ligase (PDB ID 2EWN), from which TurboID was evolved (7). Biotin-AMP in the active site is shown in yellow. The low-affinity split-TurboID cut site is shown in red, the high-affinity split-TurboID cut site is shown in blue, and the previous split-BioID cut site is shown in black (20).
Fig. 2.
Fig. 2.
Characterization of low-affinity split-TurboID. (A) Confocal fluorescence imaging of low-affinity split-TurboID (split site L73/G74). HEK293T cells were transiently transfected and incubated with 50 μM biotin and 100 nM rapamycin for 1 h, then fixed and stained with anti-V5 to detect the N-terminal fragment [Tb(N)], anti-HA to detect the C-terminal fragment [Tb(C)], and neutravidin-647 to detect biotinylated proteins. (Scale bars, 20 μm.) (B) Split-TurboID time course. HEK293T cells transiently transfected with split-TurboID constructs were treated with 50 μM biotin and 100 nM rapamycin for the indicated times, and whole-cell lysates were analyzed by streptavidin blotting. FL TurboID (10 min) and FL BioID (1 h and 18 h) were included for comparison. (C) Design of constructs used to target split-TurboID fragments to various cellular compartments. Full descriptions of constructs are available in SI Appendix, Table S1 (MTS, mitochondrial targeting sequence; SS, signal sequence). (D) Confocal fluorescence imaging of split-TurboID targeted to various cellular compartments. HEK293T cells were labeled and imaged as in A. Fluorescence intensities are not normalized across cellular compartments. Zoomed images of the boxed regions are shown. (Scale bars, 10 μm.)
Fig. 3.
Fig. 3.
Reconstitution of split-TurboID at ER–mitochondria contact sites. (A) Schematic of split-TurboID reconstitution across ER–mitochondria contacts in the presence or absence of rapamycin for inducing dimerization. (B) Design of constructs targeting split-TurboID fragments to the OMM and ERM. (C) Confocal fluorescence imaging of split-TurboID activity at ER–mitochondria contacts. Constructs were introduced into U2OS cells using lentivirus. Two days after transduction, cells were incubated with 50 μM biotin and 100 nM rapamycin for 1 h, then fixed and stained with anti-V5 to detect the N-terminal fragment [Tb(N)], anti-HA to detect the C-terminal fragment [Tb(C)], and neutravidin-647 to detect biotinylated proteins. Zoomed images of the boxed regions are shown. (Scale bars, 20 μm.) (D) Localization of split-TurboID in HEK293T cells stably expressing constructs from B. Cells were fixed and stained with anti-V5 to detect the OMM-targeted N-terminal fragment [Tb(N)] or with anti-HA to detect the ERM-targeted C-terminal fragment [Tb(C)]. Tom20 and mCherry-KDEL were used as mitochondrial and ER markers, respectively. (Scale bars, 10 μm.) Colocalization of V5 with Tom20 and HA with mCherry-KDEL are shown on the right. Quantitation from five fields of view per condition. (E) Enrichment of known ER–mitochondria contact proteins by split-TurboID-catalyzed PL. HEK293T cells stably expressing OMM/ERM-targeted split-TurboID constructs were treated with 50 μM biotin and 100 nM rapamycin for 4 h. HEK293T cells stably expressing NES-, OMM-, or ERM-targeted FL-TurboID were treated with 50 μM biotin for 1 min. Biotinylated proteins were enriched from lysates using streptavidin beads, eluted, and analyzed by blotting with streptavidin and antibodies against FACL4 and Mff. Asterisks indicate ligase self-biotinylation. (F) Enrichment of biotinylated proteins for proteomics. Samples were generated as in E. Biotinylated proteins were enriched from lysates using streptavidin beads, eluted, and analyzed by silver stain.
Fig. 4.
Fig. 4.
Proteomic mapping of ER–mitochondria contacts in HEK293T cells. (A) Experimental design and labeling conditions for MS-based proteomics. Cells stably expressing the indicated constructs were labeled with 50 μM biotin and 100 nM rapamycin. Split-TurboID (ERM/OMM) samples were labeled for 4 h and FL-TurboID samples were labeled for 1 min. Cells were then lysed, and biotinylated proteins were enriched using streptavidin beads, digested to peptides, and conjugated to TMT labels. All samples were then combined and analyzed by LC-MS/MS. (B) Filtering scheme for mass spectrometric data. +R and −R refer to rapamycin, and +B and −B refer to biotin. For each dataset, proteins were first ranked by the extent of biotinylation (ratiometric analysis referencing omit biotin controls, filter 1). Next, proteins were ranked by relative proximity to ER–mitochondria contacts versus cytosol (ratiometric analysis referencing TurboID-NES, filter 2). (C) Scatterplot showing log2(128C/130C) (filter 1) versus log2(128C/126C) (filter 2) for each protein in replicate 1 of split-TurboID cells treated with rapamycin and biotin. Known ERM and OMM proteins (as annotated by GOCC) are labeled blue and red, respectively; ERM and OMM dual-annotated proteins are colored purple, and all other proteins are shown in black. Cutoffs used to filter the mass spectrometric data and obtain the filtered proteome are shown by dashed lines. Zoom of boxed region is shown in the upper left.
Fig. 5.
Fig. 5.
Analysis of ER–mitochondria contact proteome. (A) Venn diagram comparing proteome lists obtained using split-TurboID. Proteins that were previously annotated ERM, OMM, both, or neither were labeled blue, red, purple, or black, respectively. Proteins previously enriched in MAMs are highlighted in yellow. (B) Specificity analysis for proteomic datasets generated using split-TurboID compared to the entire human proteome and to previously published datasets. Bar graph shows the percentage of each proteome with prior OMM annotation only, ERM annotation only, or both OMM and ERM annotation. Each bar is labeled with the size of the proteome. Hung et al. used APEX (9), Cho et al. used APEX and MAM fractionation (36), Kwak et al. used Contact-ID (21), and Wang et al. used MAM purification (35). (C) Markov clustering of split-TurboID proteome using protein–protein interaction scores from the STRING database (33). Gray lines denote protein–protein interactions. Nodes are colored based on whether the corresponding protein was found in the +rapamycin proteome, omit-rapamycin proteome, or both proteomes. Node size is correlated with the relative enrichment of each protein at ER–mitochondria contacts versus cytosol [log2(128C/126C) or log2(129C/126C)]. Each cluster is labeled with associated GO terms (org., organization).
Fig. 6.
Fig. 6.
Validation of proteomic hits in MAMs and by imaging. (A) Western blotting of candidate ER–mitochondria contact proteins ABCD3, EXD2, OCIAD1, NEK4, LBR, and MLF2 in MAM fractions. HEK293T cells were collected and subjected to subcellular fractionation to obtain cytosol, mitochondria (mito), ER, and MAM fractions. GRP75, IP3R1, PDI, and VDAC1 are known MAM proteins and were included as positive controls. Negative controls are COX4 (IMM), β-tubulin (cytosol), and PCNA (nucleus). (B) Overexpression imaging assay. Candidate ER–mitochondria contact proteins FUNDC2 and MTFR1 (each V5-tagged) were overexpressed in HeLa cells. V5-tagged SYNJ2BP (9) was included as a positive control. MitoTracker stains mitochondria and anti-CANX antibody stains the ER. Zoomed images of the boxed regions are shown. (Scale bars, 20 μm.) (C) Quantification of ER–mitochondria overlap (colocalization of CANX and MitoTracker signals) in B and SI Appendix, Fig. S9F. Five fields of view were analyzed per condition.
Fig. 7.
Fig. 7.
Cell–cell contact dependent reconstitution of intracellular split-TurboID. (A) Schematic of cell–cell contact-dependent split-TurboID reconstitution. (B) Confocal fluorescence imaging of “sender” cells expressing cell surface targeted glucagon peptide co-cultured with “receiver” cells expressing split-TurboID fragments. Zoomed images of the boxed regions are shown. (Scale bars, 20 μm.) *The contrast has been increased in the zoom 2 row.

References

    1. Kim D. I., Roux K. J., Filling the void: Proximity-based labeling of proteins in living cells. Trends Cell Biol. 26, 804–817 (2016). - PMC - PubMed
    1. Chen C. L., Perrimon N., Proximity-dependent labeling methods for proteomic profiling in living cells. Wiley Interdiscip. Rev. Dev. Biol. 6, e272 (2017). - PMC - PubMed
    1. Li P., Li J., Wang L., Di L. J., Proximity labeling of interacting proteins: Application of BioID as a discovery tool. Proteomics 17, 1700002 (2017). - PubMed
    1. Lam S. S. et al. ., Directed evolution of APEX2 for electron microscopy and proximity labeling. Nat. Methods 12, 51–54 (2015). - PMC - PubMed
    1. Rhee H. W. et al. ., Proteomic mapping of mitochondria in living cells via spatially restricted enzymatic tagging. Science 339, 1328–1331 (2013). - PMC - PubMed

Publication types