. 2020 May 18;11(1):2475.
doi: 10.1038/s41467-020-16287-5.

Large-scale electron microscopy database for human type 1 diabetes

Affiliations

Large-scale electron microscopy database for human type 1 diabetes

Pascal de Boer et al. Nat Commun. .

Abstract

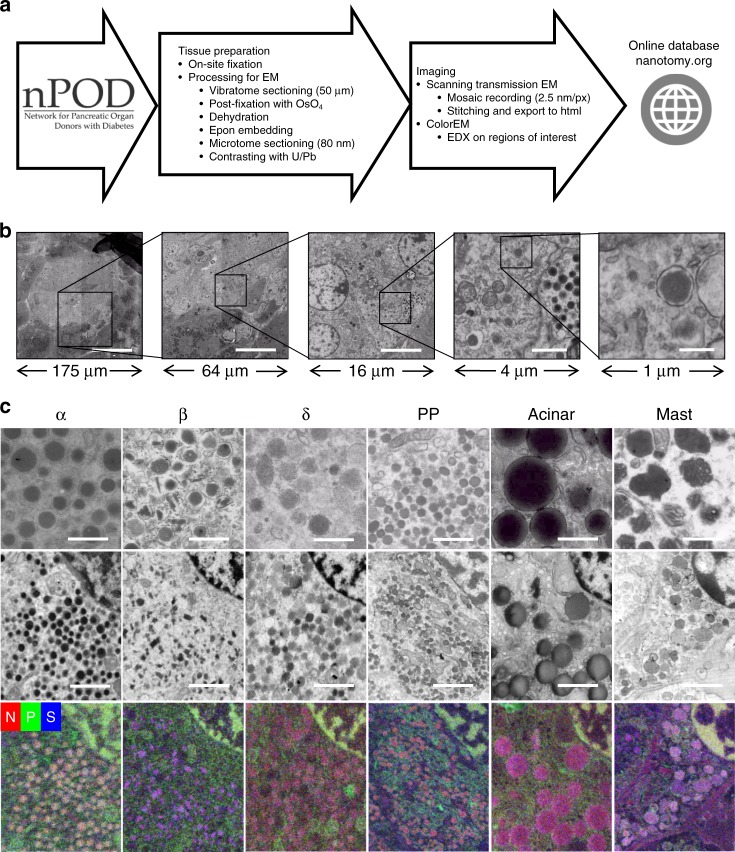
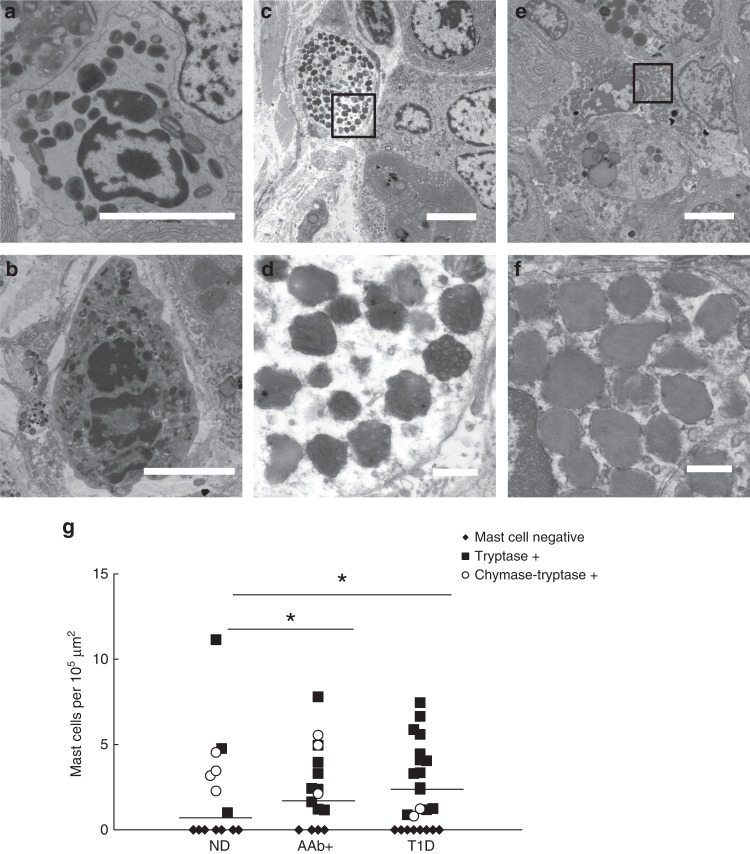
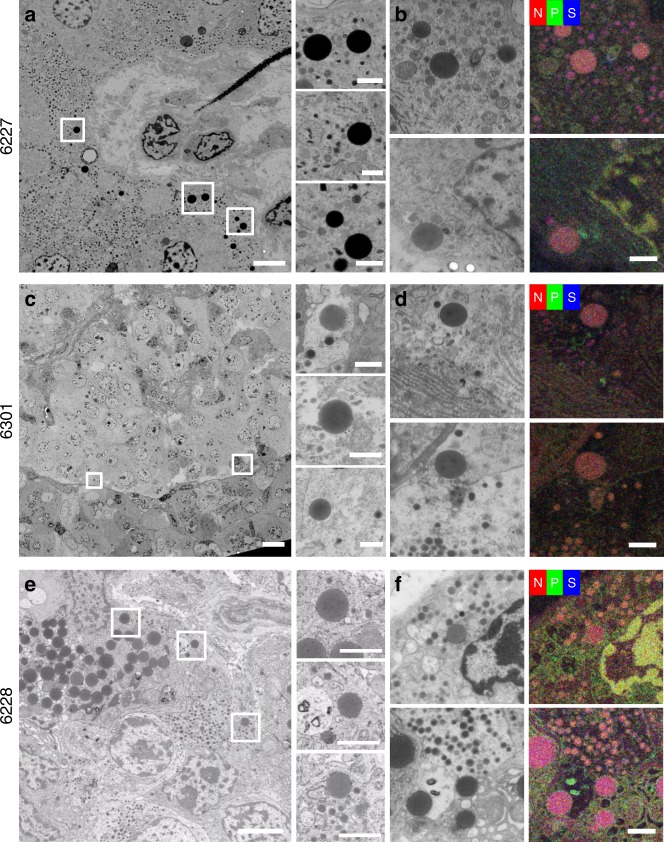
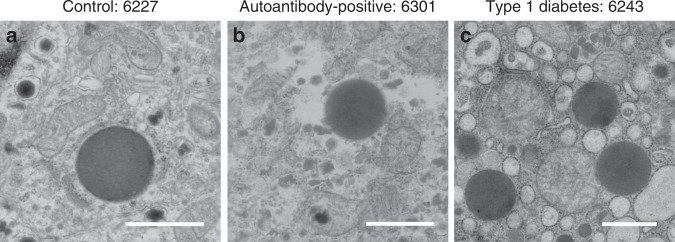
Autoimmune β-cell destruction leads to type 1 diabetes, but the pathophysiological mechanisms remain unclear. To help address this void, we created an open-access online repository, unprecedented in its size, composed of large-scale electron microscopy images ('nanotomy') of human pancreas tissue obtained from the Network for Pancreatic Organ donors with Diabetes (nPOD; www.nanotomy.org). Nanotomy allows analyses of complete donor islets with up to macromolecular resolution. Anomalies we found in type 1 diabetes included (i) an increase of 'intermediate cells' containing granules resembling those of exocrine zymogen and endocrine hormone secreting cells; and (ii) elevated presence of innate immune cells. These are our first results of mining the database and support recent findings that suggest that type 1 diabetes includes abnormalities in the exocrine pancreas that may induce endocrine cellular stress as a trigger for autoimmunity.


Conflict of interest statement

The authors declare no competing interests.

Figures

Fig. 1
Fig. 1. nPOD nanotomy followed by ColorEM allows zooming into islets up to macromolecular level and label-free identification.
a Fixed pancreatic samples are received from nPOD and processed for EM. Standard acquisition is at 2.5 nm pixel size. Stitched mosaics are converted to html and uploaded to www.nanotomy.org. Samples may be revisited for elemental analysis (ColorEM). b Overview and molecular detail with nanotomy can only be fully appreciated at www.nanotomy.org. For illustration purposes a step-wise example of islet overview (left), cells with subcellular details like the nucleus (middle); up to organelles including secretory vesicles (right) is shown. c Pancreatic cell types are discriminated based on granule morphology (top panels; see material and methods for description) and elemental composition (bottom row). EDX maps of phosphorus (green), nitrogen (red), and sulfur (blue) are overlaid. Granules of each cell type have high nitrogen (red). Granules of the α-cells are enriched in phosphorus (orange in overlay), β-cell granules with sulfur (purple in overlay), δ-, PP- and exocrine acinar cell granule show mainly nitrogen (red to pink in overlay), and mast cell granules contain sulfur (purple in overlay). Bars: (b, left to right) 50 µm, 20 µm, 4 µm, 1 µm, and 250 nm, c 0.5 µm (upper panels), 1 µm. (lower panels) Upper panel images from donors: 6331 (α), 6130 (β), 6126 (δ, acinar), 6130 (PP), 6087 (mast cell). ColorEM of donors 6126 (α, β, δ, and acinar) and 6130 (PP and mast). Micrographs in b, c are representative and similar results can be obtained from each dataset. Raw EDX data are shown in Supplementary Fig. 1.
Fig. 2
Fig. 2. Eosinophils, neutrophils, and mast cells are prominent in type 1 diabetes donors.
Granulocytes from the nPOD data are distinguished based on secretory granule morphology. a Eosinophils were found in exocrine tissue of one donor. b Neutrophils are detected in multiple type 1 diabetes, predominantly located in the exocrine parenchyma and some in the peri-islet region, as shown here. Mast cells are observed in type 1 diabetes (c) and control samples (e). Tryptase+ mast cells are identified by prominent scrolls in the secretory granules (d), and chymase-tryptase+ mast cells show homogenous gray granules (f). Total numbers and prevalence of the innate immune cells per dataset are displayed in Table 1. g Mast cells present per 105 μm2 in the total dataset per donor, each symbol represents one donor. Average numbers of total mast cells did not significantly differ between control (1.4 ± 0.60), autoantibody-positive (2.4 ± 0.57; p = 0.068 versus control), and type 1 diabetes donors (2.3 ± 0.49; p = 0.062 versus control). However, tryptase+ mast cells were found significantly higher in autoantibody-positive donors (AAb+; mean = 1.7 ± 0.55, p = 0.02; n = 17) and type 1 diabetes donors (T1D; mean is 2.2 ± 0.50, p = 0.005; n = 24) than control non-diabetes donors (ND; 0.81 ± 0.57; n = 21). Means from tryptase+ mast cell numbers are indicated by horizontal lines. Statistical analyses between control, autoantibody positive, and type 1 diabetes donor groups were performed first by non-parametric one-way ANOVA resulting in tryptase+ mast cells (p = 0.014), followed by Mann–Whitney U tests. (*) Significant differences. n Indicates number of individual datasets analyzed per condition. Bars: 5 μm (ac, e) 0.5 μm (d, f). Donors 6064 (a), 6380 (b), 6087 (c, d), and 6126 (e, f).
Fig. 3
Fig. 3. Abnormal endocrine-exocrine granules in the same cell relate to type 1 diabetes.
Cells containing both exocrine and endocrine granules were identified in the control (a, b; 6227; 2 of 16 donors), autoantibody-positive (c, d; 6301; 3 of 13 donors) and type 1 diabetes (e, f; 6228; 6 of 16 donors) donor groups, one example of each is shown here. The intermediate cells contain both secretory granules resembling exocrine and either insulin, in 6227 (b) and 6301 (d upper panel), or glucagon, in 6301 (d lower panel) and 6228 (f), granules based on morphology and elemental content using ColorEM with exocrine granules in red, insulin granules in purple, and glucagon granules in orange (see Fig. 1 for reference). Bars: 5 µm in overviews, 1 µm in boxed regions, and 1 µm in b, d, f. Raw EDX data are shown in Supplementary Fig. 2.
Fig. 4
Fig. 4. Only intermediate cells from autoantibody-positive and type 1 diabetes donors display an affected ultrastructure of mitochondria and ER.
a Intermediate cells from control donors do not display additional morphological alterations (n = 2), while autoantibody-positive (b; n = 3) and type 1 diabetes (c; n = 6) donors do show a cell stress associated affected ultrastructure looking at diminished mitochondrial cristae, dilation of rough ER, and extraction of material. n indicates the number of donors per group with intermediate cells. Scale bars: 1 µm.

References

    1. Atkinson MA, von Herrath M, Powers AC, Clare-Salzler M. Current concepts on the pathogenesis of type 1 diabetes-considerations for attempts to prevent and reverse the disease. Diabetes Care. 2015;38:979–988. doi: 10.2337/dc15-0144. - DOI - PMC - PubMed
    1. Banting FG, Best CH. Pancreatic extracts. 1922. J. Lab Clin. Med. 1990;115:254–272. - PubMed
    1. Acerini C. The rise of technology in diabetes care. not all that is new is necessarily better. Pediatr. Diabetes. 2016;17:168–173. doi: 10.1111/pedi.12366. - DOI - PubMed
    1. Campbell-Thompson M, et al. Network for pancreatic organ donors with diabetes (nPOD): developing a tissue biobank for type 1 diabetes. Diabetes Metab. Res Rev. 2012;28:608–617. doi: 10.1002/dmrr.2316. - DOI - PMC - PubMed
    1. Wasserfall C, et al. Validation of a rapid type 1 diabetes autoantibody screening assay for community-based screening of organ donors to identify subjects at increased risk for the disease. Clin. Exp. Immunol. 2016;185:33–41. doi: 10.1111/cei.12797. - DOI - PMC - PubMed

Publication types

MeSH terms