

doi: 10.1038/s41598-020-65005-0.
Enzyme- and gene-specific biases in reverse transcription of RNA raise concerns for evaluating gene expression
Affiliations
- PMID: 32424137
- PMCID: PMC7235240
- DOI: 10.1038/s41598-020-65005-0
Item in Clipboard
Enzyme- and gene-specific biases in reverse transcription of RNA raise concerns for evaluating gene expression
Sci Rep.
.
Abstract
Reverse transcription is the first step of most analyses of gene expression, yet the quantitative biases it introduces are largely overlooked. Following a series of purpose-designed systematic experiments we cherry-pick examples of various biases introduced by reverse transcription, and alert the "gene expression community" to the pitfalls and improved practice of this fundamental technique.
Conflict of interest statement
The authors declare that we have no competing financial or non-financial interests as defined by Nature Research, or other interests that might be perceived to influence the results and/or discussion reported in this paper.
Figures
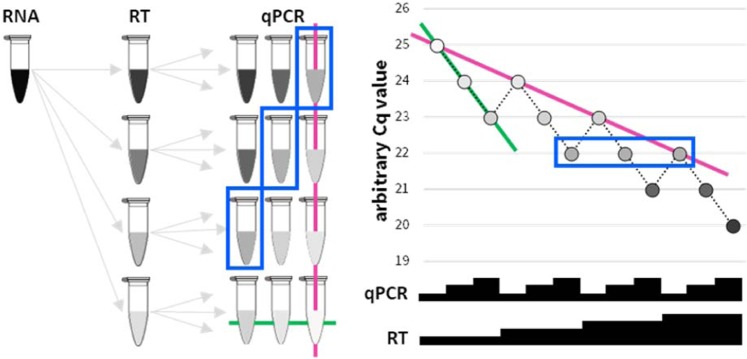
A schematic of the experimental design and Cq values of a hypothetical ideal qPCR amplification. A series of 2-fold dilutions of an RNA sample are reverse transcribed (RT), and 2-fold dilutions of each resulting cDNA are analysed by qPCR. Colour intensity of tube (left) and corresponding circle (right) represents predicted amplicon abundances. Samples boxed in blue (left and right) exemplify a set of samples expected to harbour identical Cq values. Relative input quantities are depicted as black steps (right; not to scale). Solid green lines connect samples of one ideal qPCR titration curve (-1 Cq per 2-fold increased input of cDNA in qPCR). Solid pink lines connects the samples of a similar ideal RT titration curve (-1 Cq per 2-fold increased input of RNA in RT).

qPCR analysis of RNA H using two RT kits (iScript and Transcriptor). Experimental setup and display are as in Fig. 1. Solid lines are average RT titration slopes. For precise values, see text.
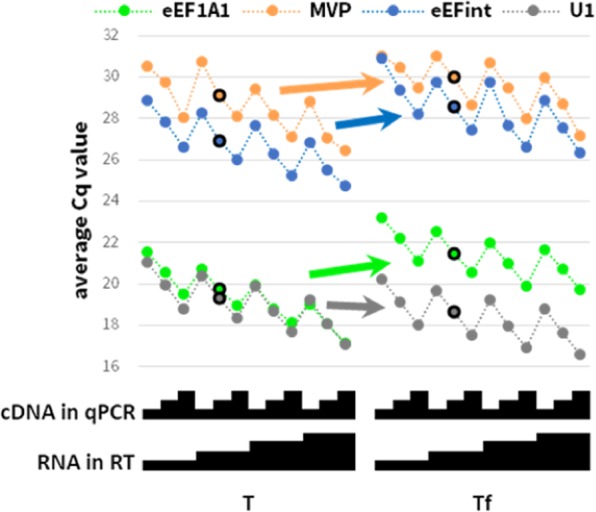
qPCR analysis of intact (T) and partly-degraded (Tf) RNA T using Transcriptor. Experimental setup and display are as in Fig. 1. Arrows exemplify the trend of change in Cq values using the highlighted dilution (outlined circles).

qPCR analysis of RNA from two cell lines (H and T) using iScript RT performed with either 75 or 600 ng RNA. Differential expression of OAZ1 relative to eEF1A1 is calculated using the ΔΔCq method.
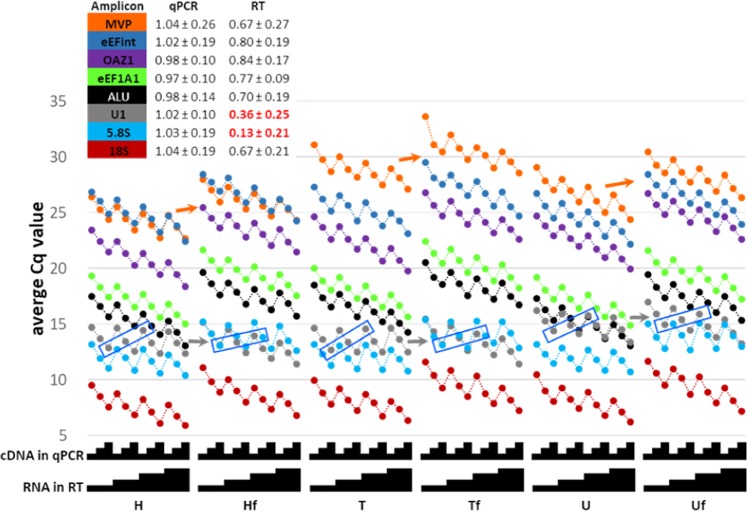
qPCR analysis of RNA from two cell lines (H and T) as well as a commercial reference (U) with or without fragmentation (fragmented: Hf, Tf and Uf). Experimental setup and display are as in Fig. 1. Amplicon colour-coding is as in Figs. 2 and 3. Samples boxed in blue exemplify sets of U1 samples expected to harbour identical Cq values (see Fig. 1). Arrows illustrate the shift in Cq of two amplicons upon fragmentation of each of the three tested RNAs.
References
MeSH terms
Substances
Grants and funding
LinkOut - more resources
Full Text Sources
Other Literature Sources
