. 2020 May 18;11(1):2471.
doi: 10.1038/s41467-020-16274-w.

Sphingolipids produced by gut bacteria enter host metabolic pathways impacting ceramide levels

Affiliations

Sphingolipids produced by gut bacteria enter host metabolic pathways impacting ceramide levels

Elizabeth L Johnson et al. Nat Commun. .

Abstract

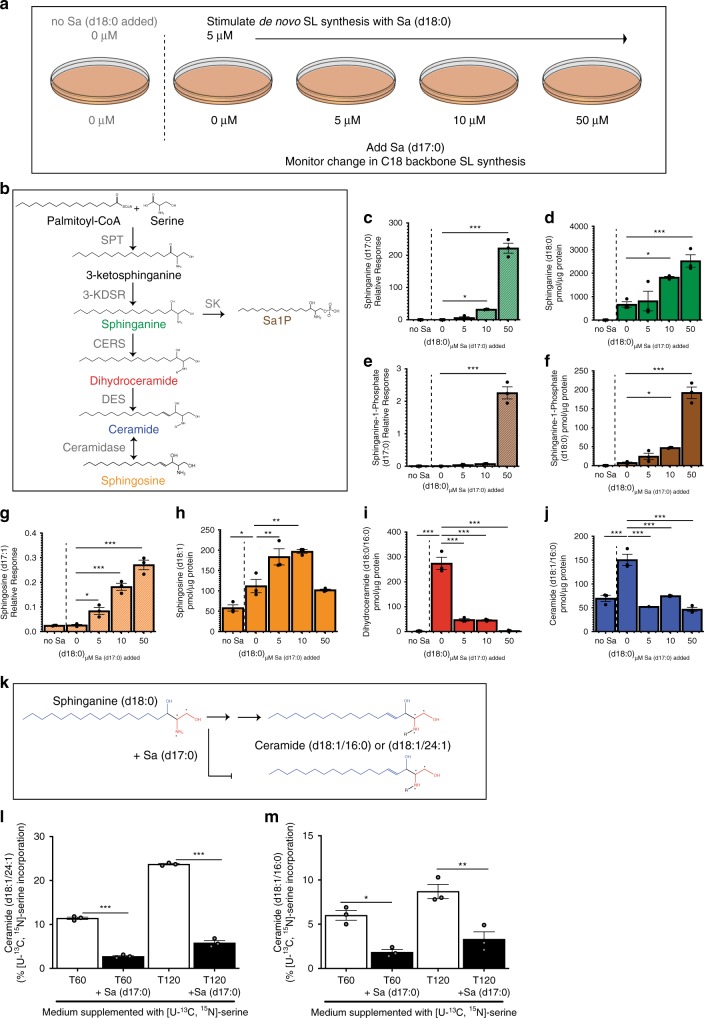
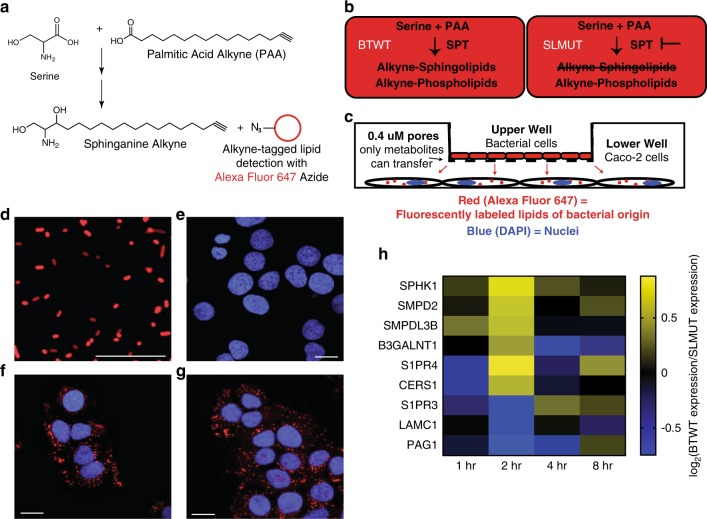
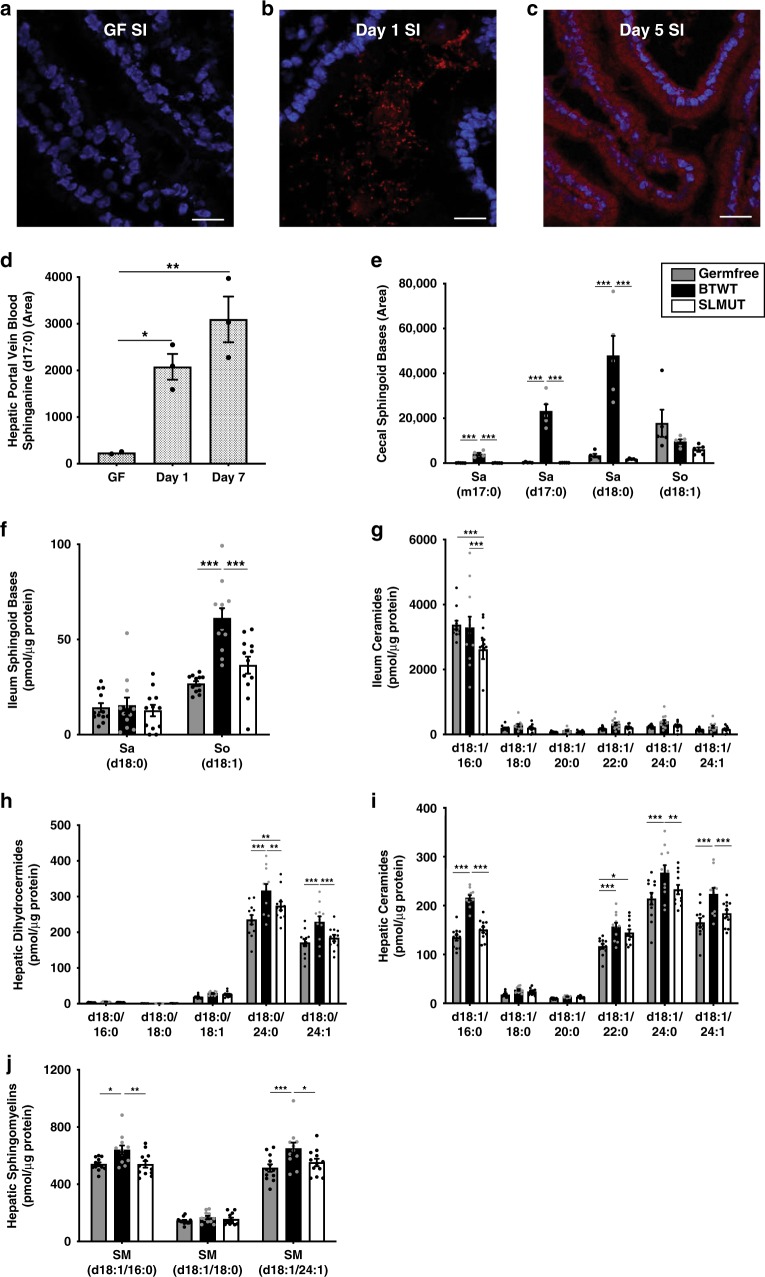
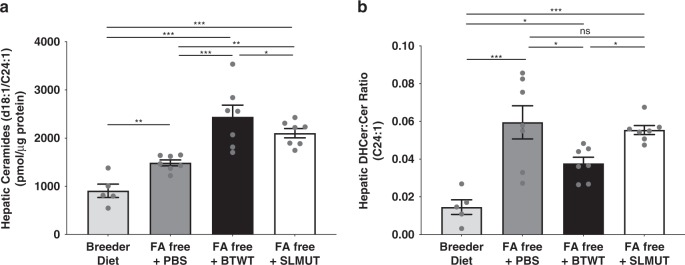
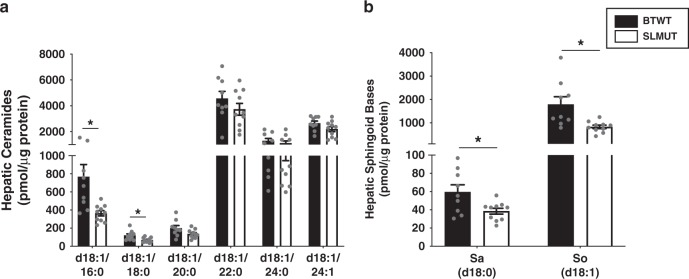
Gut microbes are linked to host metabolism, but specific mechanisms remain to be uncovered. Ceramides, a type of sphingolipid (SL), have been implicated in the development of a range of metabolic disorders from insulin resistance (IR) to hepatic steatosis. SLs are obtained from the diet and generated by de novo synthesis in mammalian tissues. Another potential, but unexplored, source of mammalian SLs is production by Bacteroidetes, the dominant phylum of the gut microbiome. Genomes of Bacteroides spp. and their relatives encode serine palmitoyltransfease (SPT), allowing them to produce SLs. Here, we explore the contribution of SL-production by gut Bacteroides to host SL homeostasis. In human cell culture, bacterial SLs are processed by host SL-metabolic pathways. In mouse models, Bacteroides-derived lipids transfer to host epithelial tissue and the hepatic portal vein. Administration of B. thetaiotaomicron to mice, but not an SPT-deficient strain, reduces de novo SL production and increases liver ceramides. These results indicate that gut-derived bacterial SLs affect host lipid metabolism.


Conflict of interest statement

The authors declare no competing interests.

Figures

Fig. 1
Fig. 1. Odd chain SLs produced by gut microbes can inhibit host de novo synthesis of even chain SLs.
a Illustration of experimental setup where Caco-2 cells were stimulated with 5 μM of Sa (d18:0) and challenged with increasing concentrations of Sa (d17:0). b SL de novo synthesis pathway. SPT (serine palmitoyltransferase), 3-KDSR (3-keto-dihydrosphignosine reductase), CERS (ceramide synthase), DES (desaturase), SK (sphingosine kinase). cj SL synthesis was induced in proliferating Caco-2 cells with addition of 5 μM Sa (d18:0), then cells were dosed with increasing concentrations (5, 10, 50 μM) of Sa (d17:0) to monitor the ability of Sa (d17:0) to inhibit flux of C18-base length SLs through the SL synthesis pathway. Labels and graph colors refer back to the corresponding metabolite in (b); graphs of metabolites with C18 sphingoid backbones have solid bars while graphs of metabolites with C17 sphingoid backbones are represented by striped bars. Cells were harvested 1 h after addition of lipids. Means ± standard error of the mean (SEM) of three biological replicate experiments (n = 3) (one-way ANOVA comparing concentrations to 0 μM Sa (d17:0) added, *p < 0.05, **p < 0.01, ***p < 0.001), are plotted for (c) Sa (d17:0), (d) Sa (d18:0), (e) sphinganine-1-phosphate (Sa1P) (d17:0), (f) Sa1P (d18:0), (g) So (d17:1), and (h) So (d18:1) (i) dihydroceramide (d18:0/16:0), (j) ceramide (d18:1/16:0). cj, k Diagram of incorporation of [U–13C,15N]-serine (red) to identify newly synthesized SLs. [U–13C,15N]-serine was added to culture medium and [M + 3] isotopes due to [U–13C,15N]-serine incorporation into newly synthesized SLs were monitored by LC-MS. Sa (d17:0) was added to determine if this metabolite decreased the de novo synthesis of SLs with a C18 length sphingoid base. Percent incorporation of [U–13C,15N]-serine was measured for (l) ceramide (d18:1/16:0) and (m) ceramide (d18:1/24:1) after 60 (T60) and 120 min from the addition of the [U–13C,15N]-serine. Bars represent the mean ± SEM of three biological replicates (two-sided t-test, *p < 0.05, **p < 0.01, ***p < 0.001). Source data are provided as a source data file. For all figures with bars, height of bar = mean and error bar is SEM.
Fig. 2
Fig. 2. SL production by BTWT regulates SL metabolism genes.
a Incorporation of palmitic acid alkyne (PAA) into complex SLs allows fluorescent detection of bacterially-derived lipids using an azide (N3) conjugated fluorophore (Alexa Fluor 647). b Metabolism of PAA in BTWT vs. SLMUT. SPT = serine palmitoyltransferase. c Illustration of the transwell coculture system, showing transfer of PAA derivatives from bacterial cells in upper well to Caco-2 cells in lower well. d Confocal image showing alkyne-tagged lipids detected in BTWT cells grown with PAA (red - Alexa Fluor 647; detection by click chemistry). Scale bar is 20 μm. Confocal microscopy image of Caco-2 cells in the lower transwell after 6-h exposure to (e) cell culture media (f) BTWT-PAA or (G) SLMUT-PAA. eg Alkyne-tagged lipids were detected by Alexa Fluor 647 (red) and DNA was stained using DAPI (blue). Images are representative of three independent experiments. Scale bar is 20 μm. f Heatmap showing the average time-zero normalized log2 change in gene expression between BTWT and SLMUT in transwell with Caco-2 cells for two biological replicate 8-h time course experiments (yellow = higher, blue = lower for log2 BTWT/SLMUT relative expression). Source data are provided as a source data file.
Fig. 3
Fig. 3. Bacterial SLs are uptaken in GI tract and portal vein and affect tissue SLs.
Confocal microscopy of a small intestine (SI) tissue of germfree mice, b SI tissue of germfree mice inoculated with BTWT grown in PAA (BTWT-PAA) 3 h after oral gavage, and c SI tissue of germfree mice after 5 days of daily gavage with BTWT-PAA. PAA metabolites were detected with Alexa Fluor 647 azide (red) using click chemistry, and nuclei of the intestinal epithelial cells were stained using DAPI (blue). Scale bar is 20 µm. Representative images of four mice. d Sphinganine (d17:0) levels in acid base-treated hepatic portal vein blood of germfree mice gavaged daily with BTWT. For hepatic portal vein blood samples, means ± SEM of LC-MS measurements are plotted for: GF = germfree (n = 2), one day of daily gavage, Day 1 (n = 3); 7 days of daily gavage, Day 7 (n = 3) (one-way ANOVA, Tukey’s multiple comparison test, *p < 0.05, **p < 0.01). e Cecal long chain base SLs. Bar charts represent SL abundance ± SEM for five mice per condition. (two-way ANOVA, Tukey’s multiple comparison test, ***p < 0.001). fj Bar charts represent mean SL abundance ± SEM for: GF (gray, n = 12 mice), monoassociation with BTWT (black, n = 11 mice) or monoassociation with SLMUT (white, n = 12 mice); two-way ANOVA, Tukey’s multiple comparison test, *p < 0.05, **p < 0.01, ***p < 0.001). f Ileal long-chain sphingoid base SLs; g Ileal ceramides; h Hepatic dihydroceramides; i Hepatic ceramides; j Hepatic sphingomyelins. Source data are provided as a source data file. For all figures with bars, height of bar = mean and error bar is SEM.
Fig. 4
Fig. 4. Oral supplementation of BTWT inhibits hepatic de novo SL synthesis in vivo.
a Hepatic ceramides in mice on a breeder diet or a fatty acid free (FA free) diet that stimulates hepatic de novo SL synthesis. Mice on the FA free diet were gavaged with PBS (control), BTWT, or SLMUT. b Hepatic dihydroceramide (DHCer) to ceramide (Cer) ratios for ceramide (d18:1/24:1). Mean values ± SEM are plotted, n = 7 per condition, (one-way ANOVA, Holm-Sidak multiple comparison test, *p ≤ 0.05, **p < 0.01, ***p < 0.001, ns = not-significant). Source data are provided as a source data file. For all figures with bars, height of bar = mean and error bar is SEM.
Fig. 5
Fig. 5. Increased hepatic ceramides in mice supplemented with BTWT as compared with SLMUT.
Bar charts represent mean SL abundance ± SEM for (a) Hepatic ceramides and (b) hepatic sphingoid bases of BTWT treated (black bars) and SLMUT treated (white bars) mice. a, b Observations with significant differences in SL abundance are marked with stars SLMUT (two-sided t-test, *p < 0.05). For BTWT n = 9 and for SLMUT n = 10. Source data are provided as a source data file. For all figures with bars, height of bar = mean and error bar is SEM.

References

    1. Raichur S, et al. CerS2 haploinsufficiency inhibits beta-oxidation and confers susceptibility to diet-induced steatohepatitis and insulin resistance. Cell Metab. 2014;20:687–695. doi: 10.1016/j.cmet.2014.09.015. - DOI - PubMed
    1. Turpin SM, et al. Obesity-induced CerS6-dependent C16:0 ceramide production promotes weight gain and glucose intolerance. Cell Metab. 2014;20:678–686. doi: 10.1016/j.cmet.2014.08.002. - DOI - PubMed
    1. Hannun YA, Obeid LM. Principles of bioactive lipid signalling: lessons from sphingolipids. Nat. Rev. Mol. Cell Biol. 2008;9:139–150. doi: 10.1038/nrm2329. - DOI - PubMed
    1. Meikle PJ, Summers SA. Sphingolipids and phospholipids in insulin resistance and related metabolic disorders. Nat. Rev. Endocrinol. 2017;13:79–91. doi: 10.1038/nrendo.2016.169. - DOI - PubMed
    1. Hannun YA, Obeid LM. Sphingolipids and their metabolism in physiology and disease. Nat. Rev. Mol. Cell Biol. 2017;19:175. doi: 10.1038/nrm.2017.107. - DOI - PMC - PubMed

Publication types

MeSH terms

LinkOut - more resources