. 2020 Jun;22(6):701-715.
doi: 10.1038/s41556-020-0514-z. Epub 2020 May 18.

Enhancer reprogramming driven by high-order assemblies of transcription factors promotes phenotypic plasticity and breast cancer endocrine resistance

Affiliations

Enhancer reprogramming driven by high-order assemblies of transcription factors promotes phenotypic plasticity and breast cancer endocrine resistance

Mingjun Bi et al. Nat Cell Biol. 2020 Jun.

Abstract

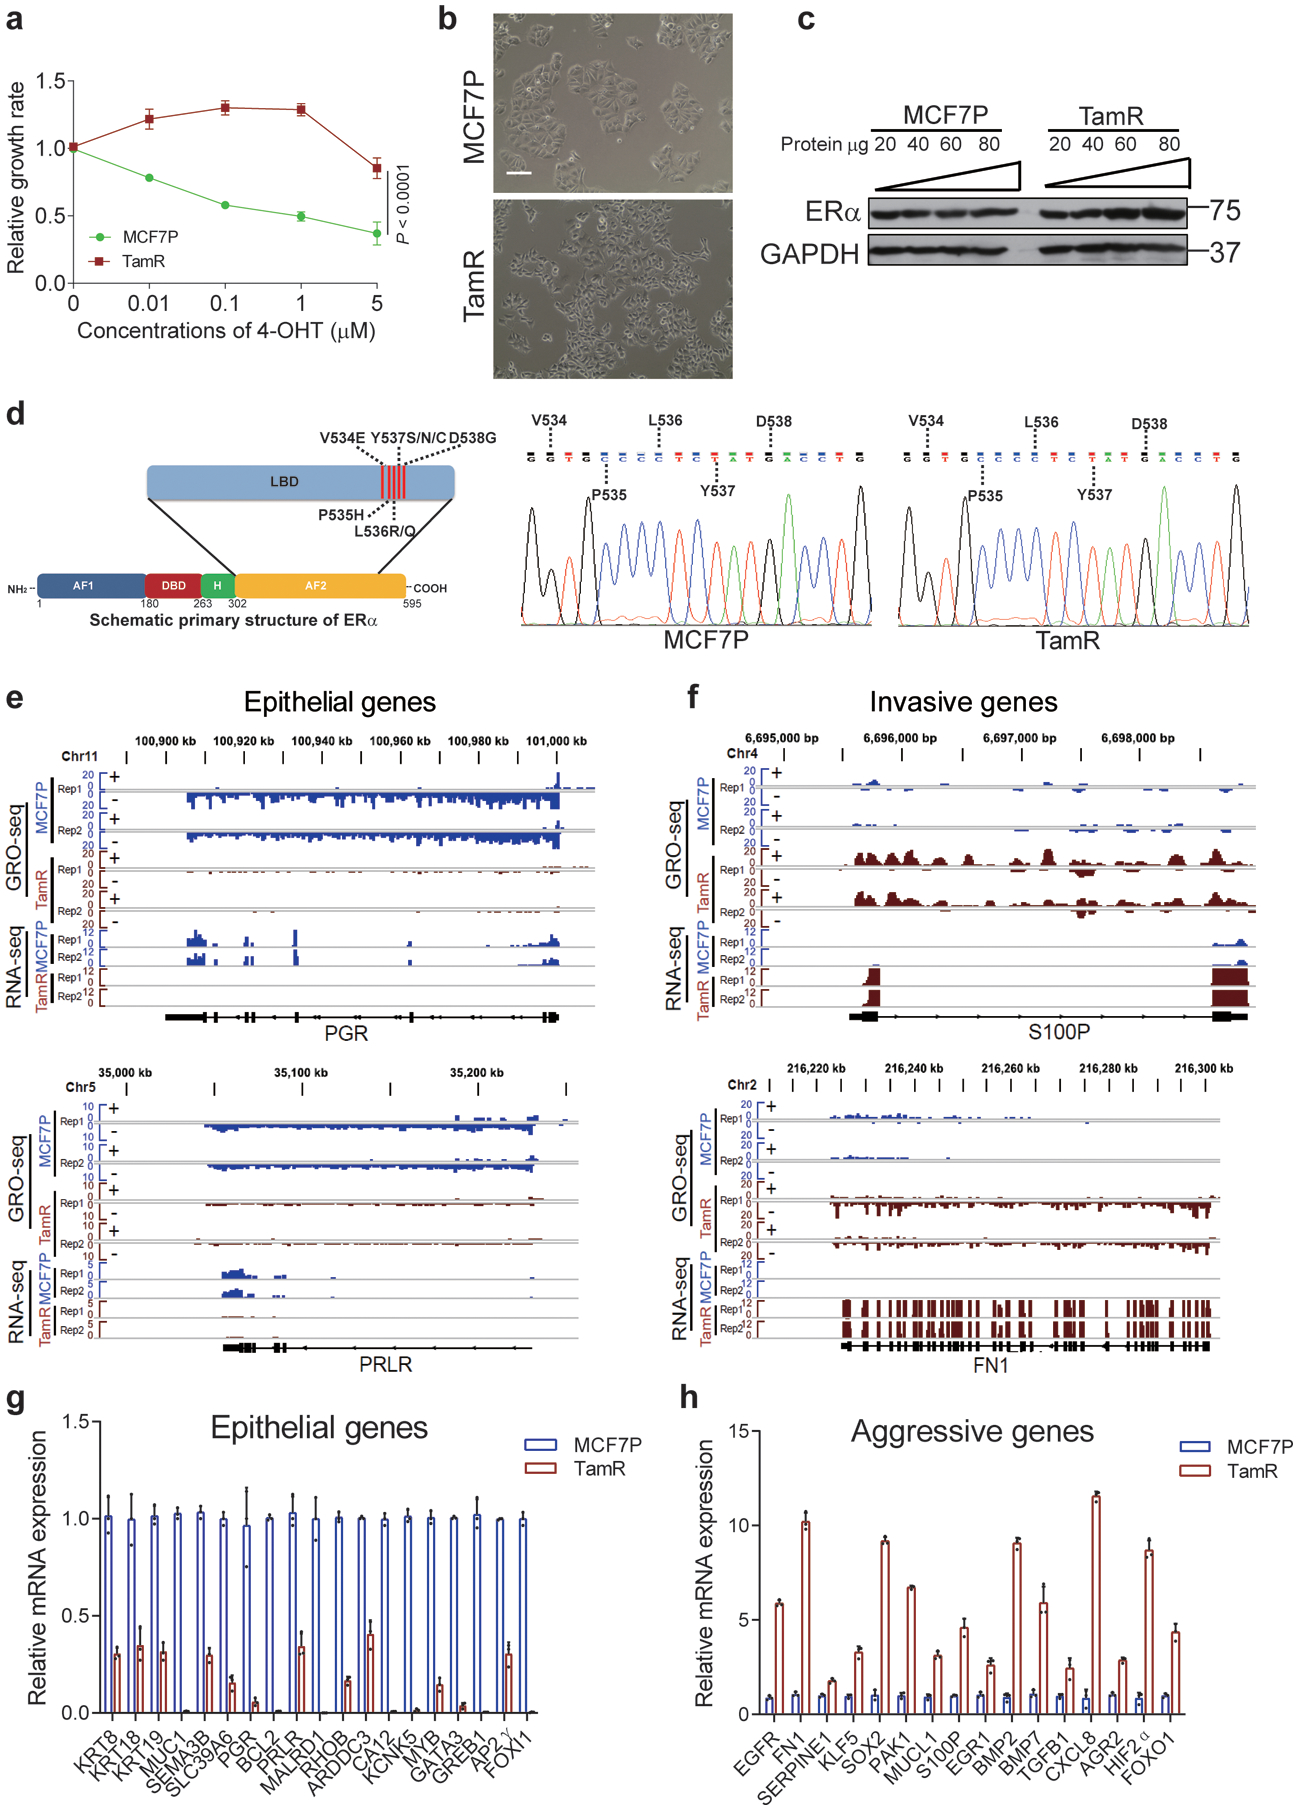
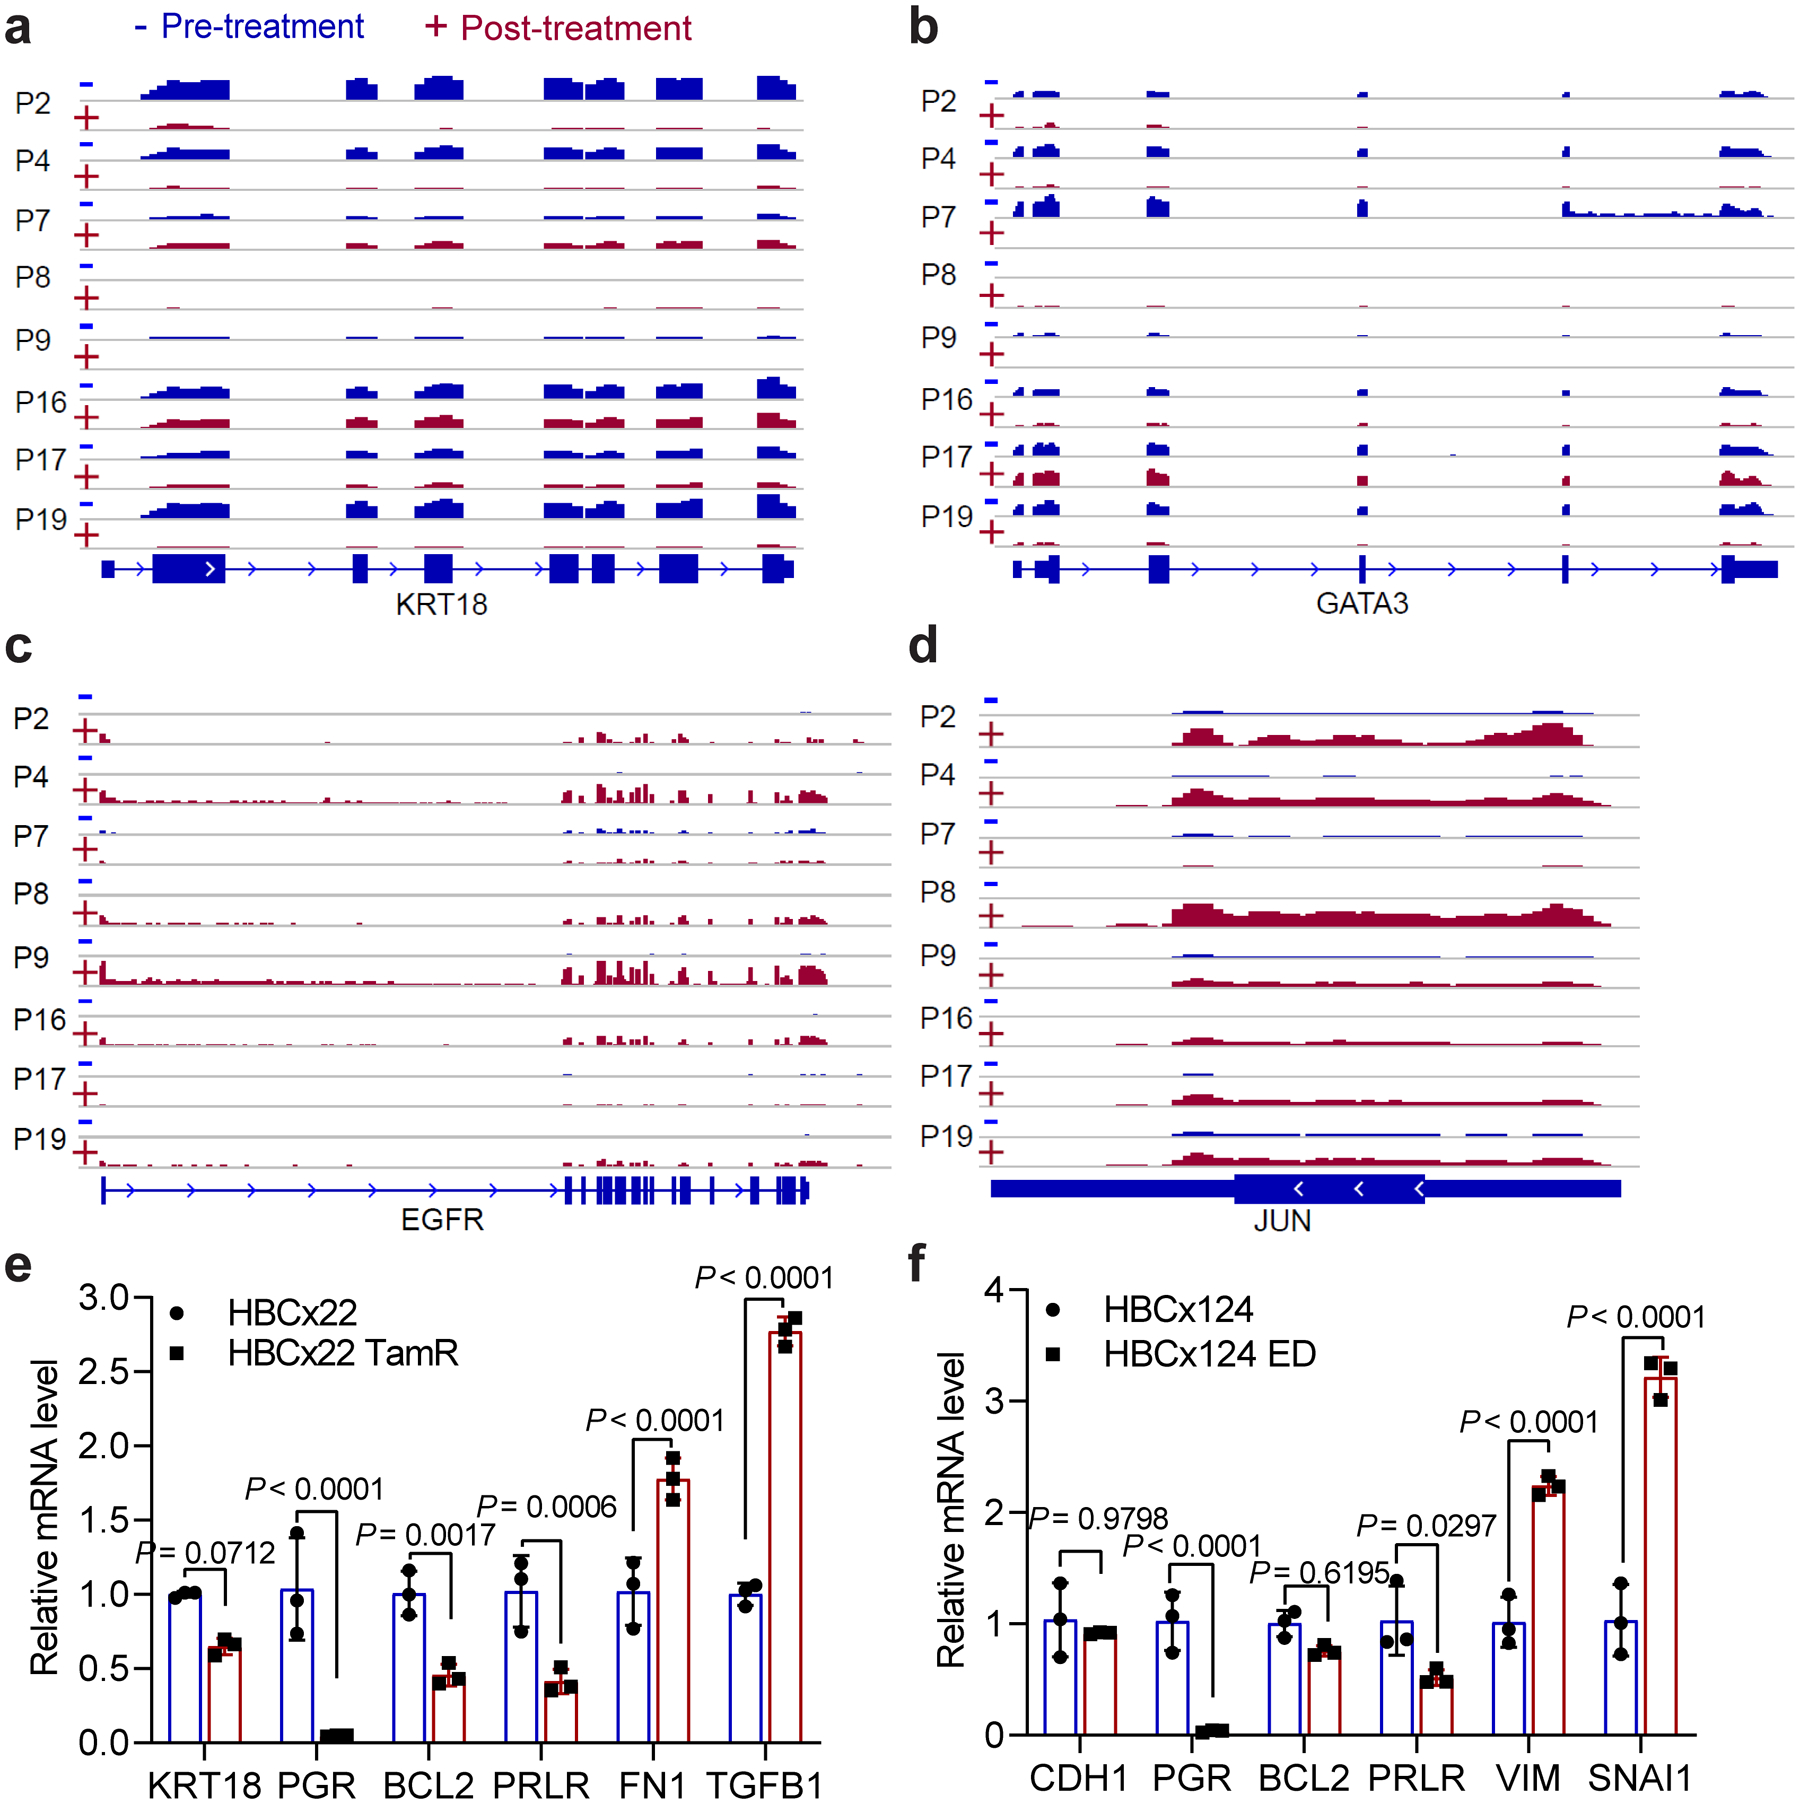
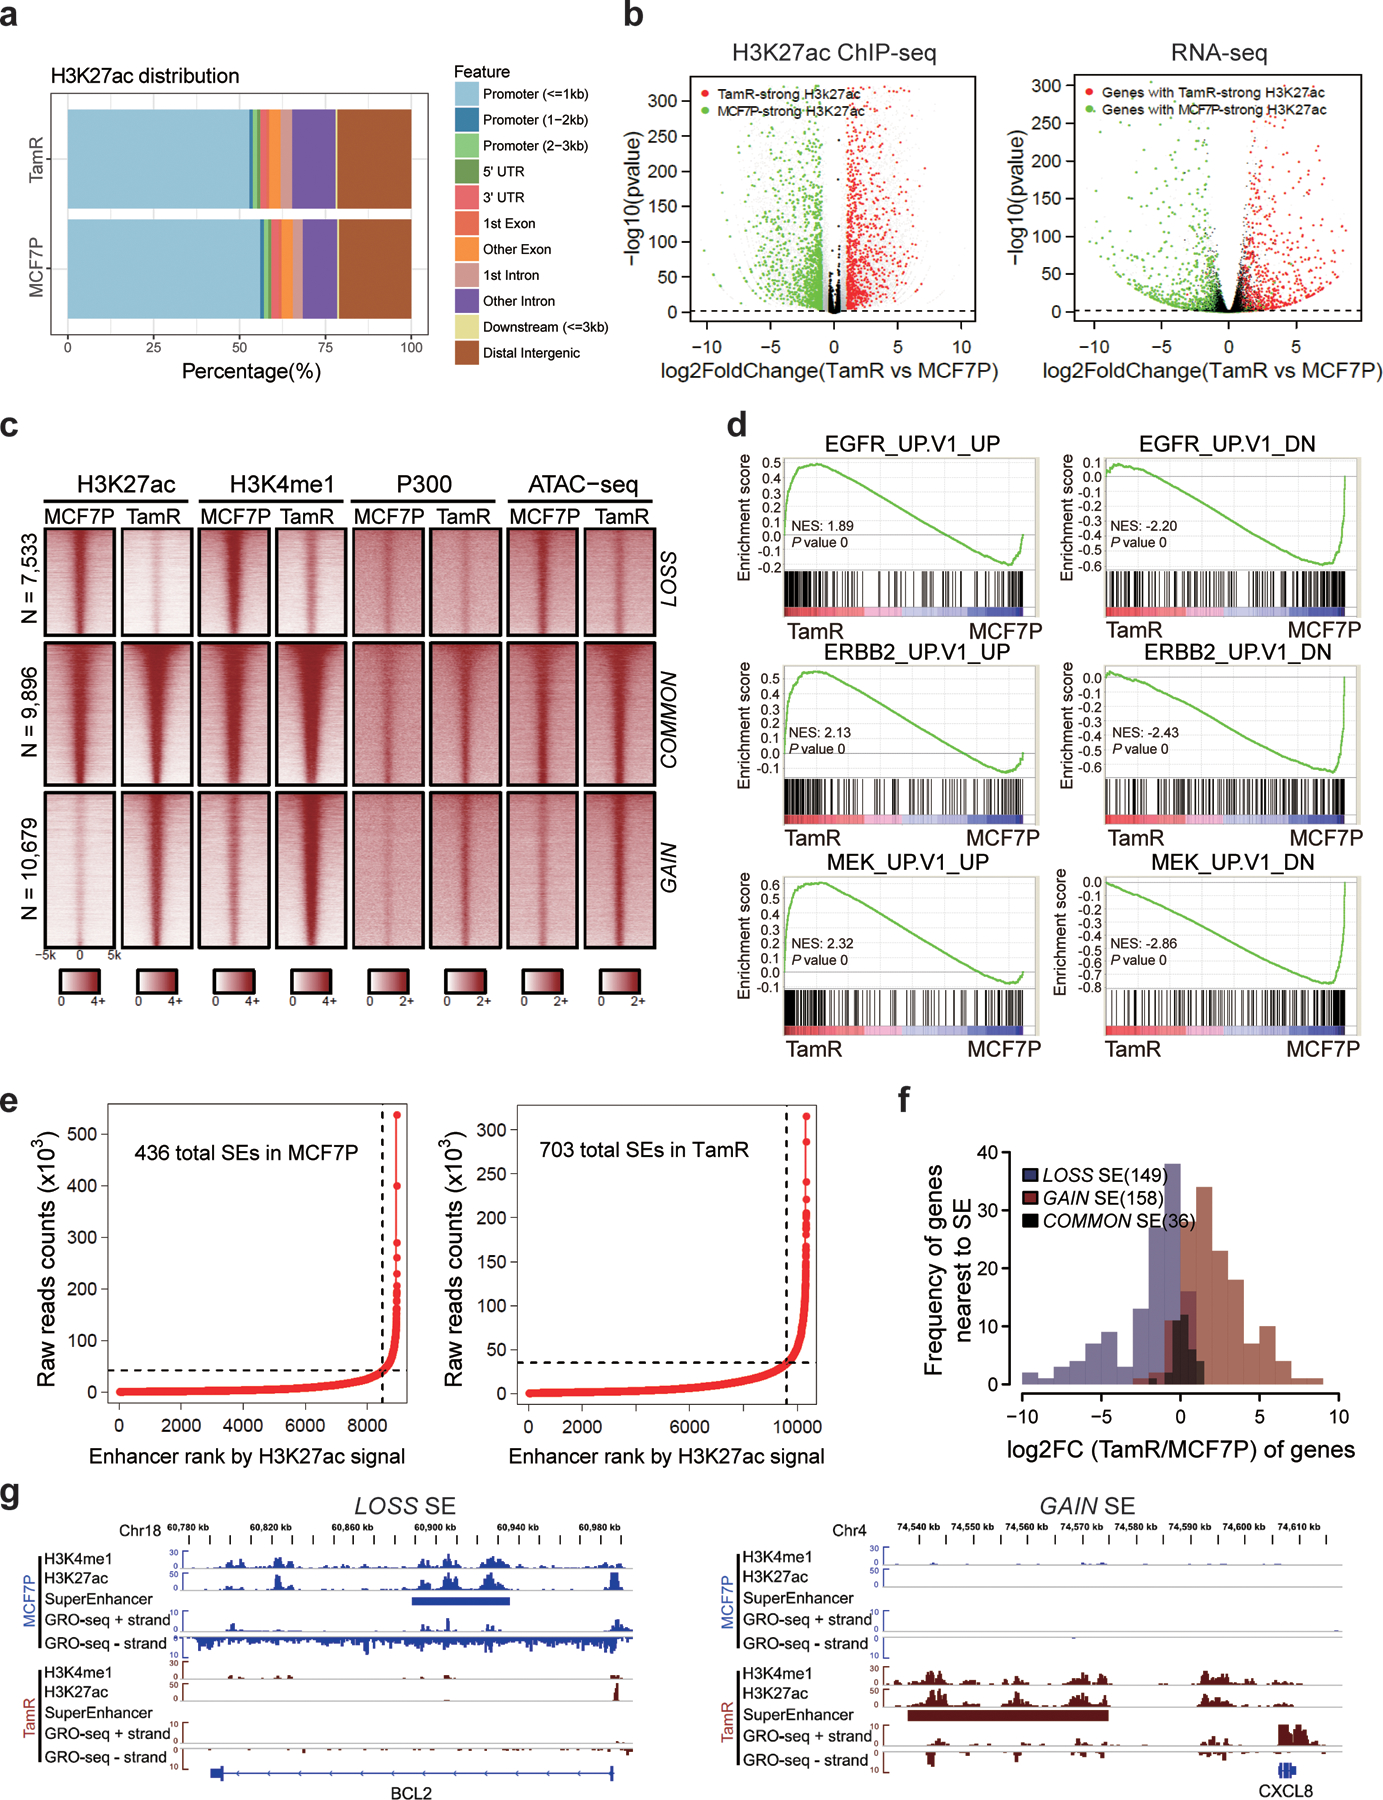
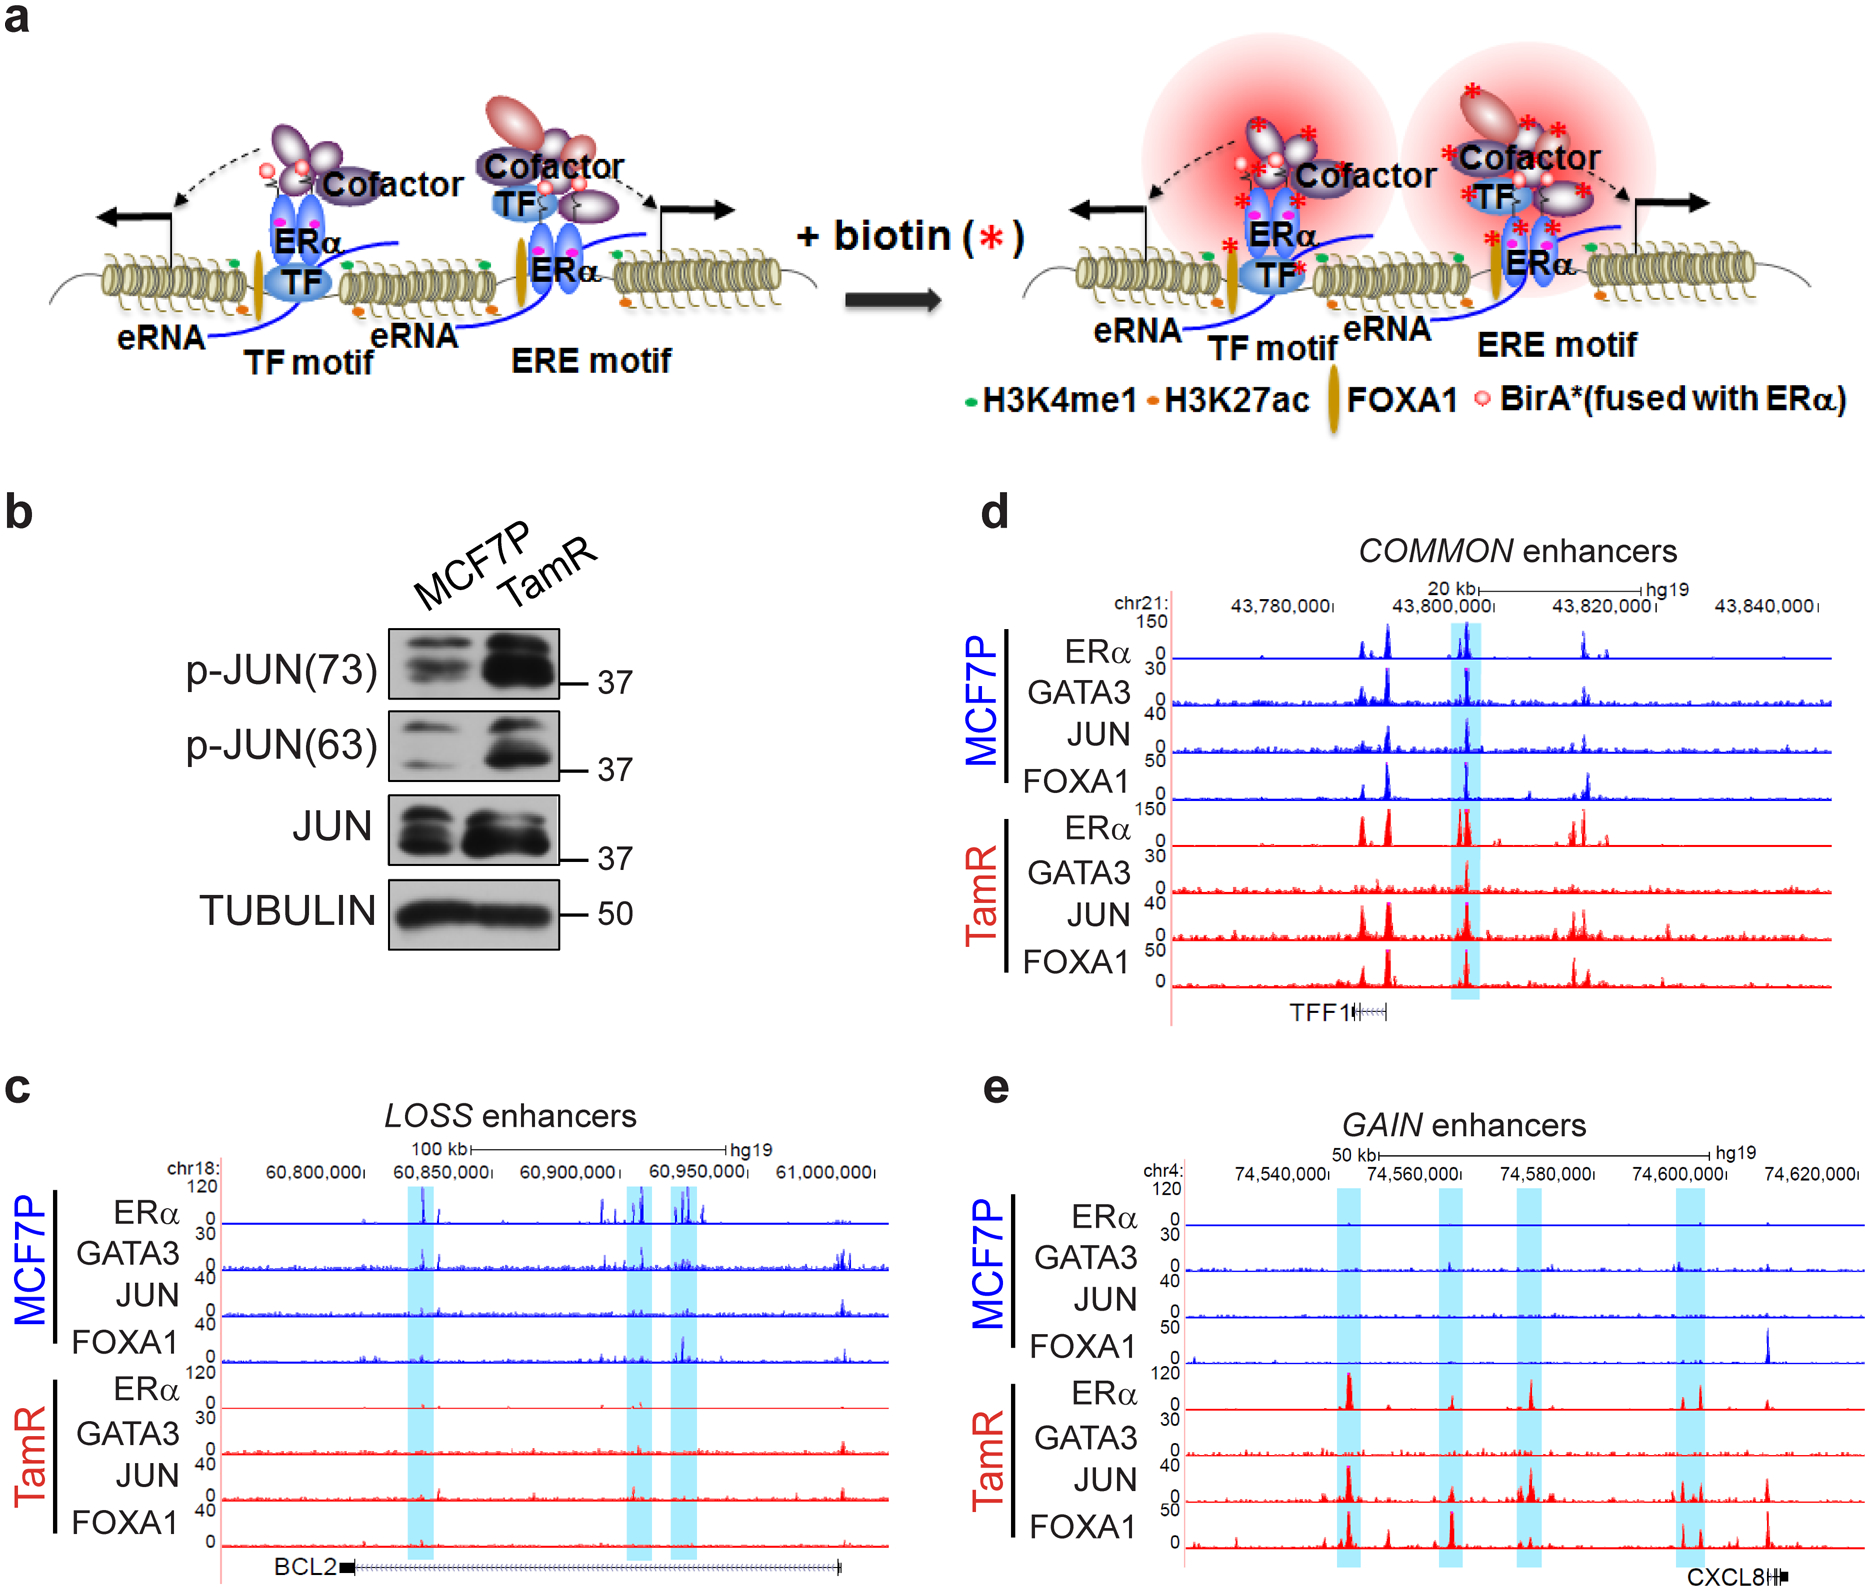
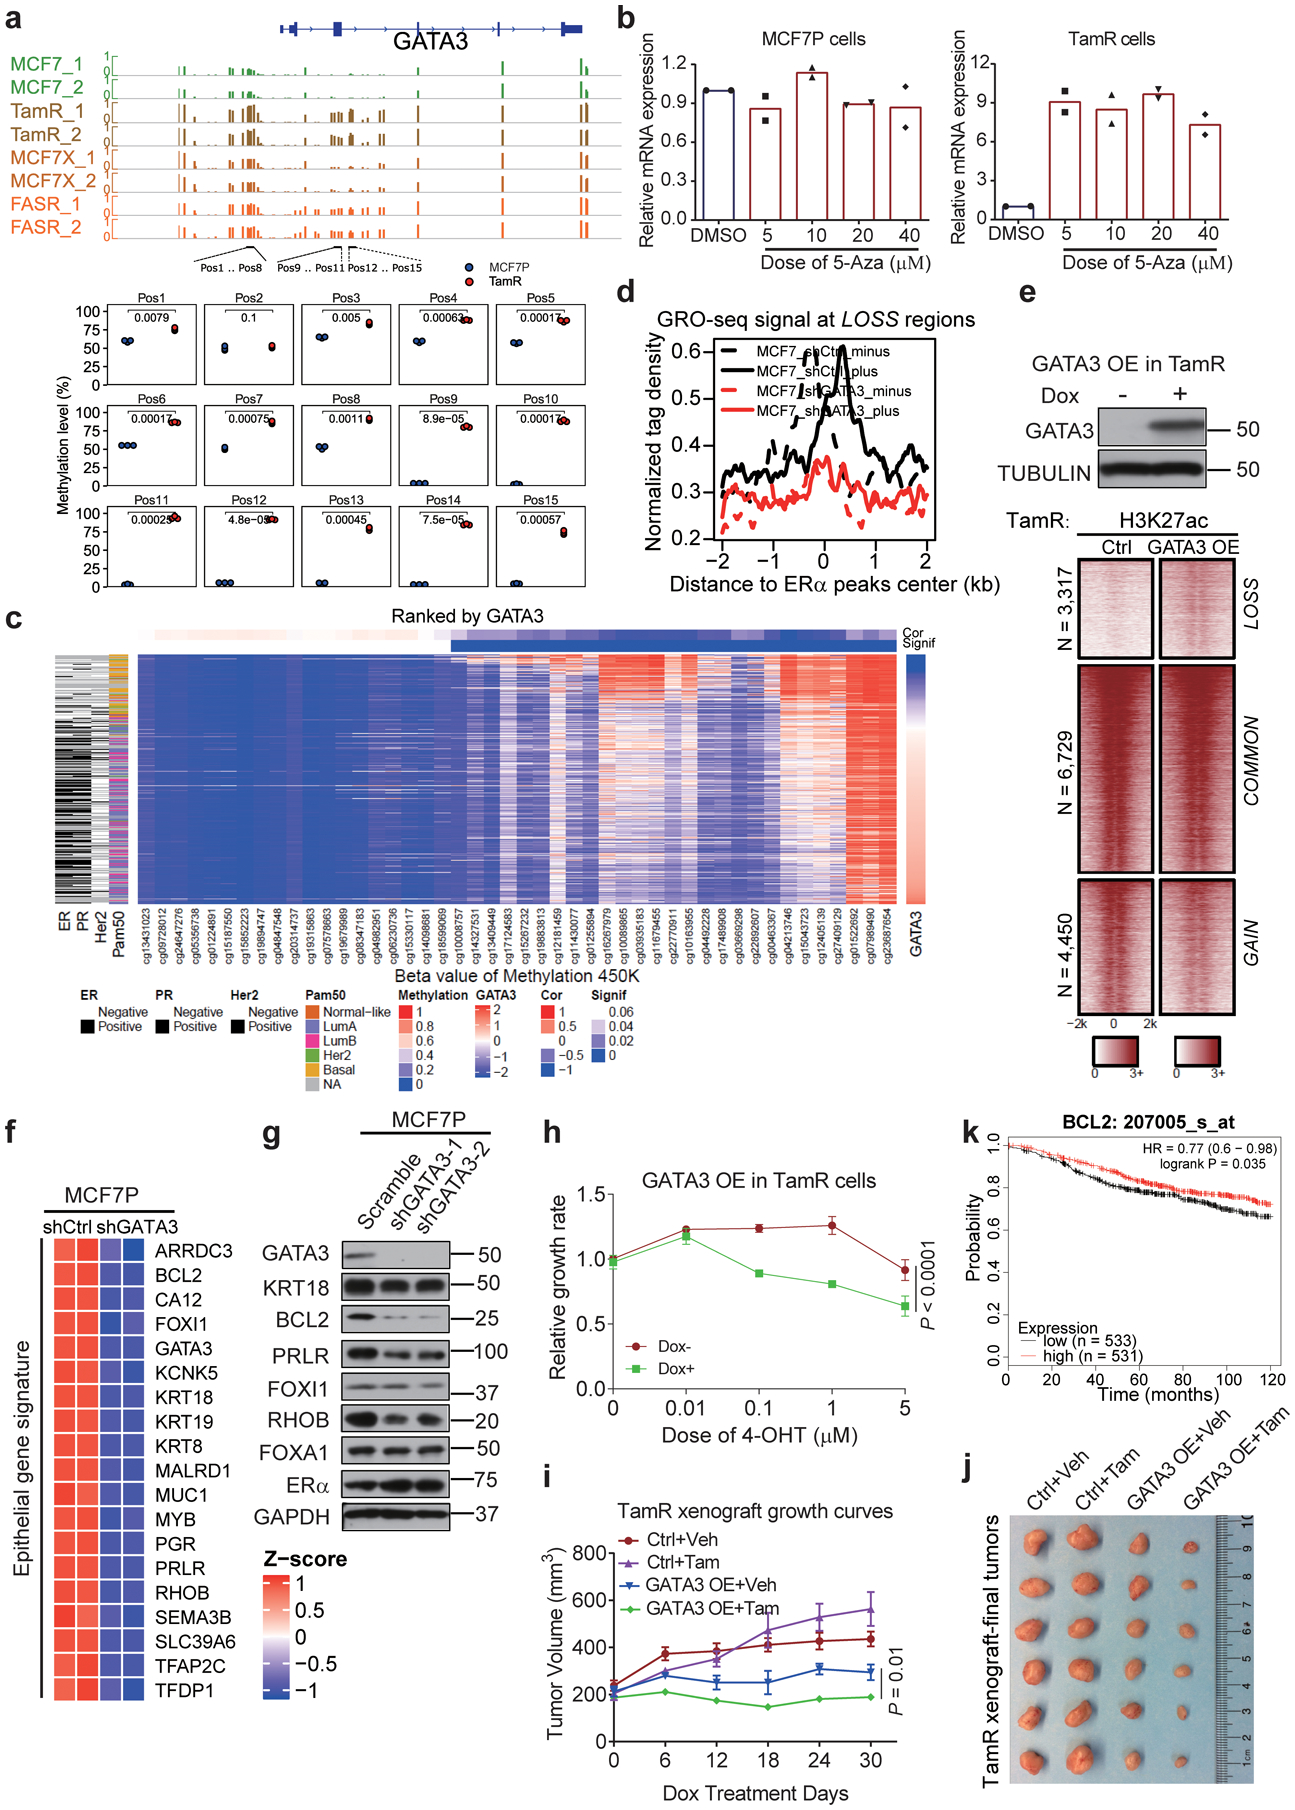
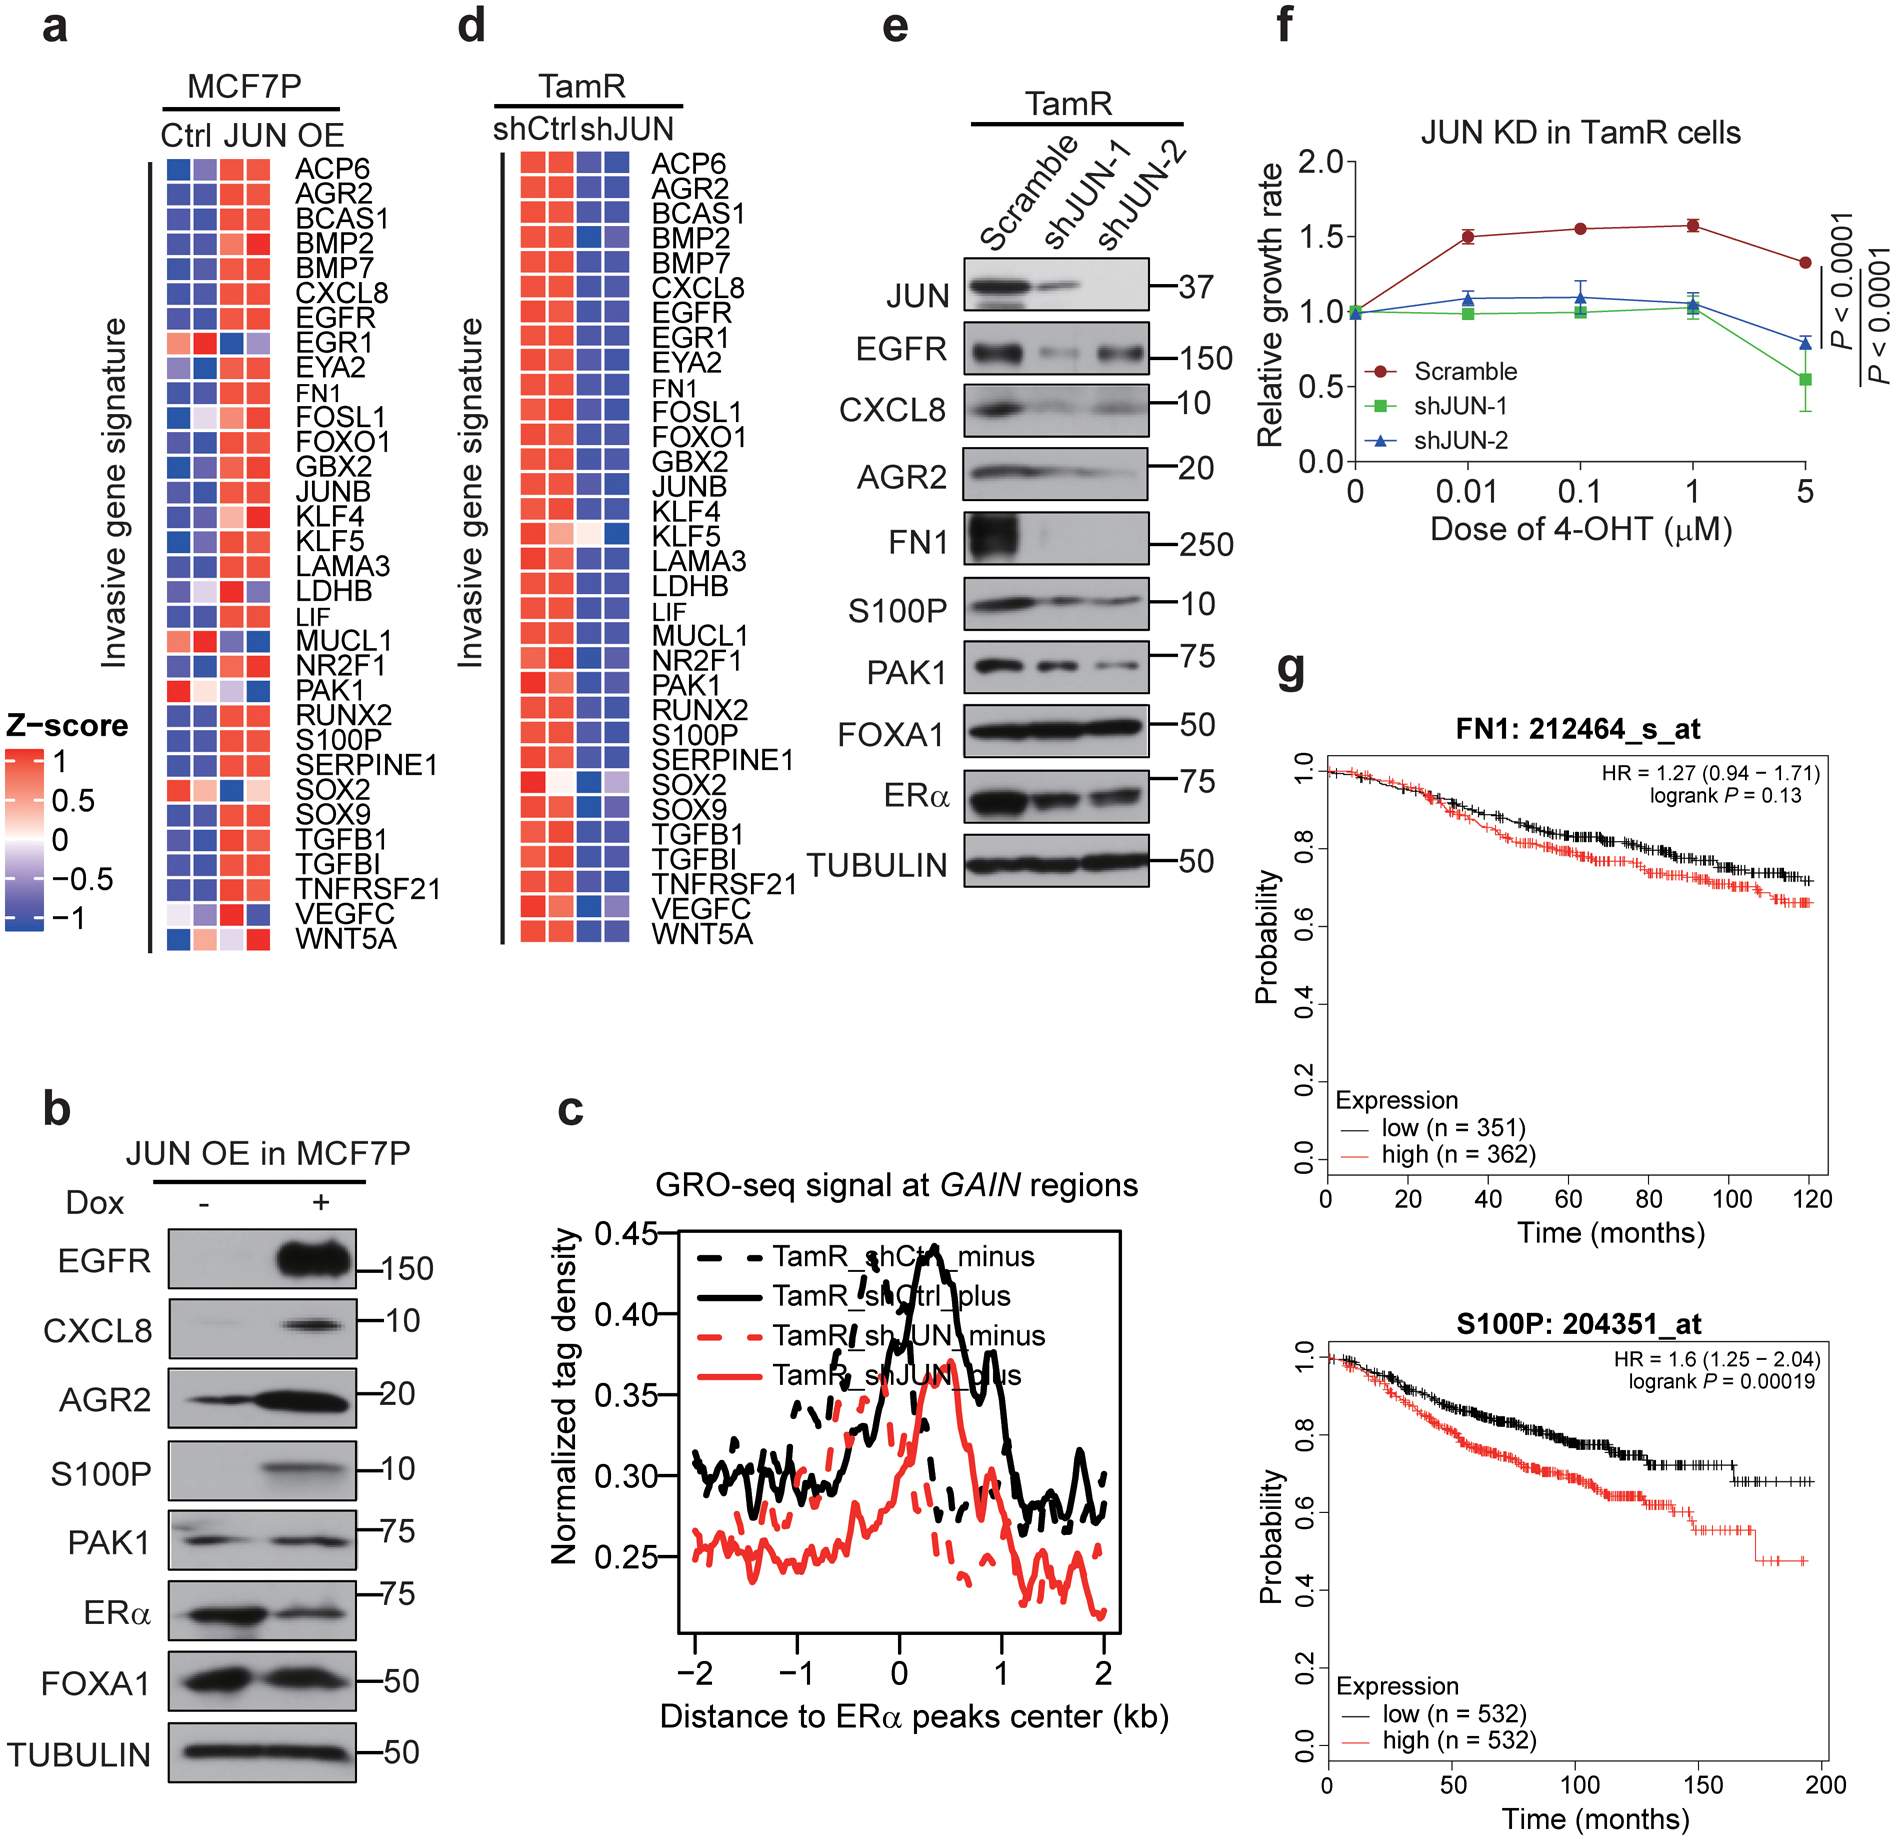
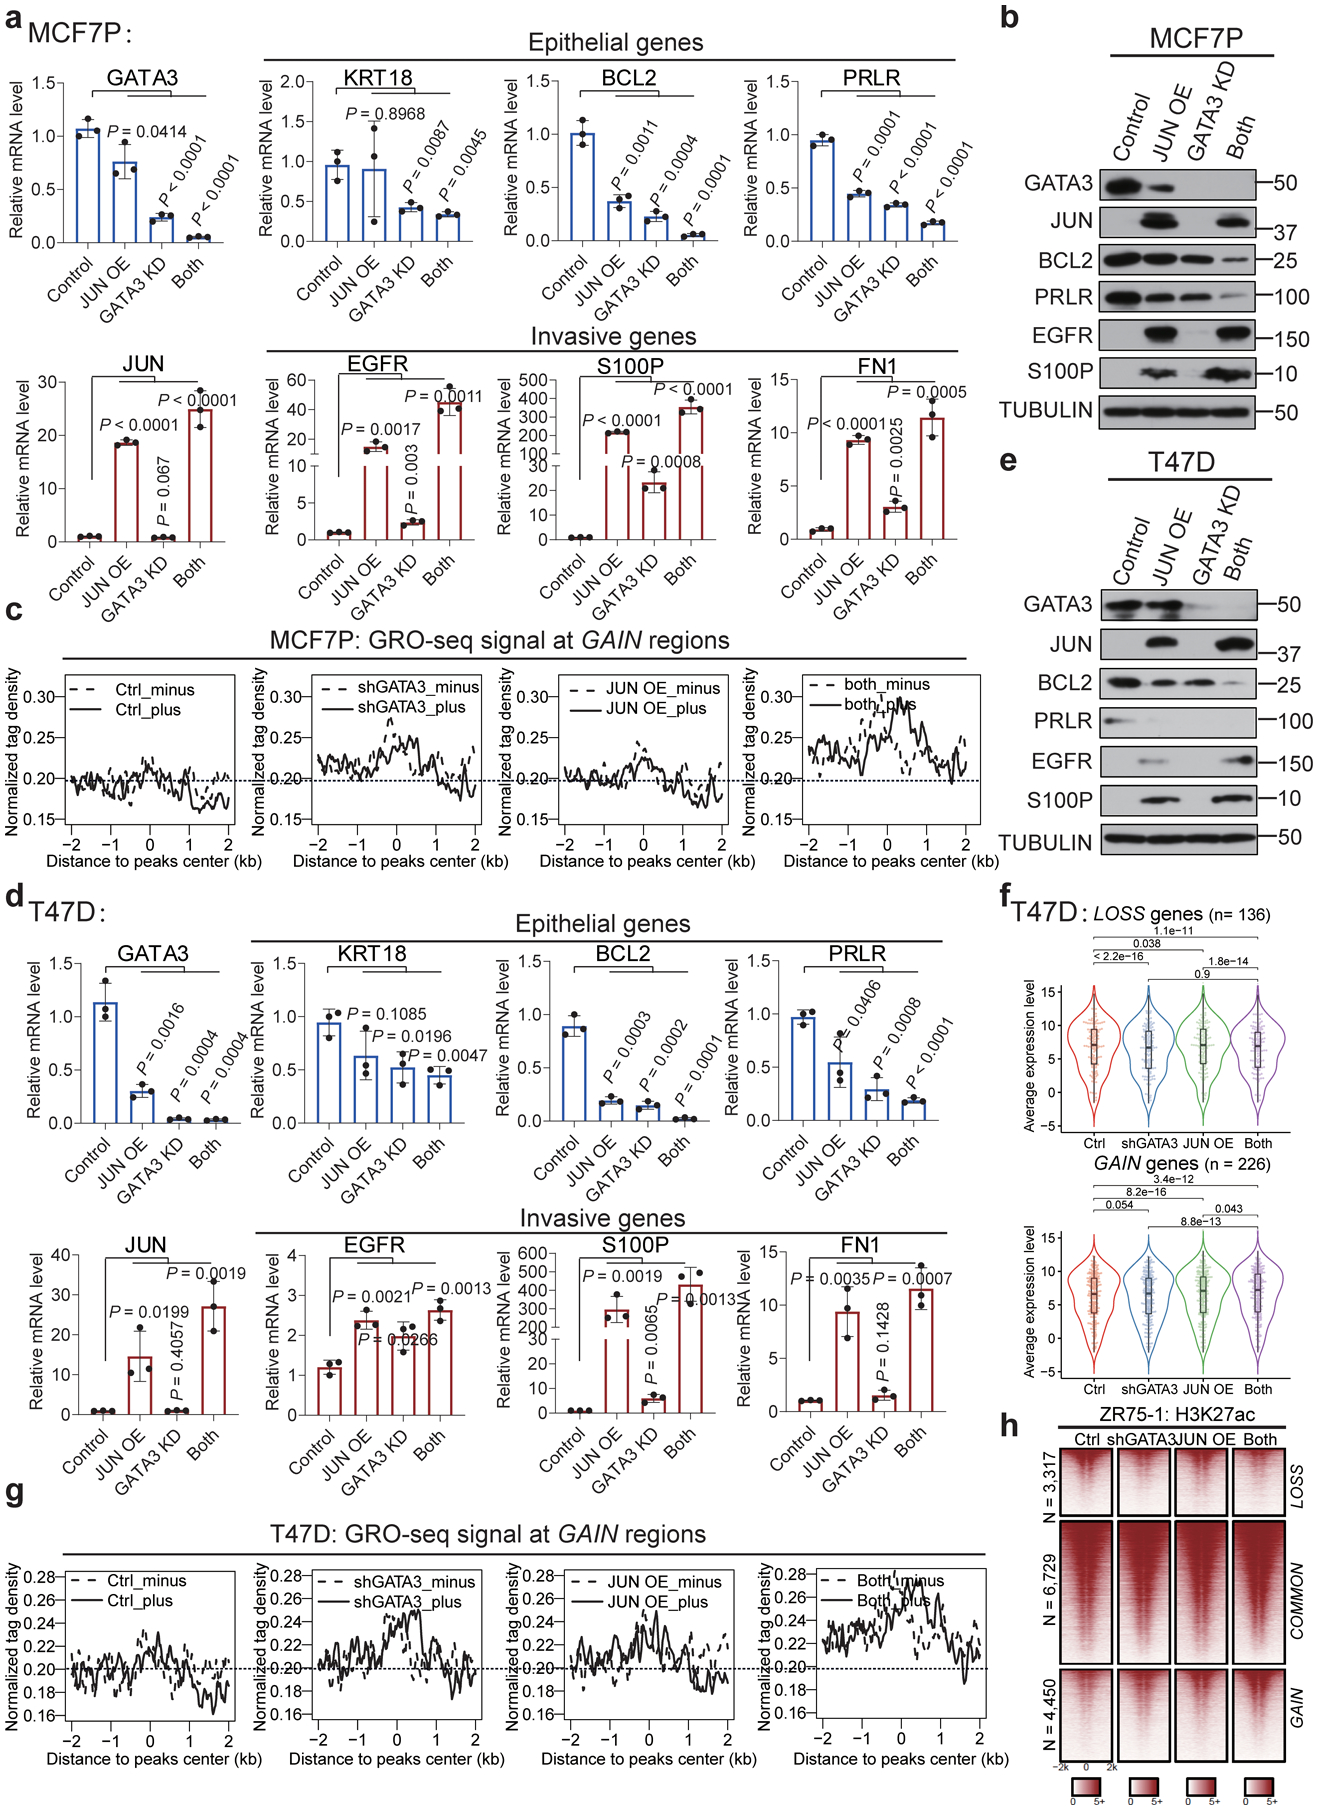
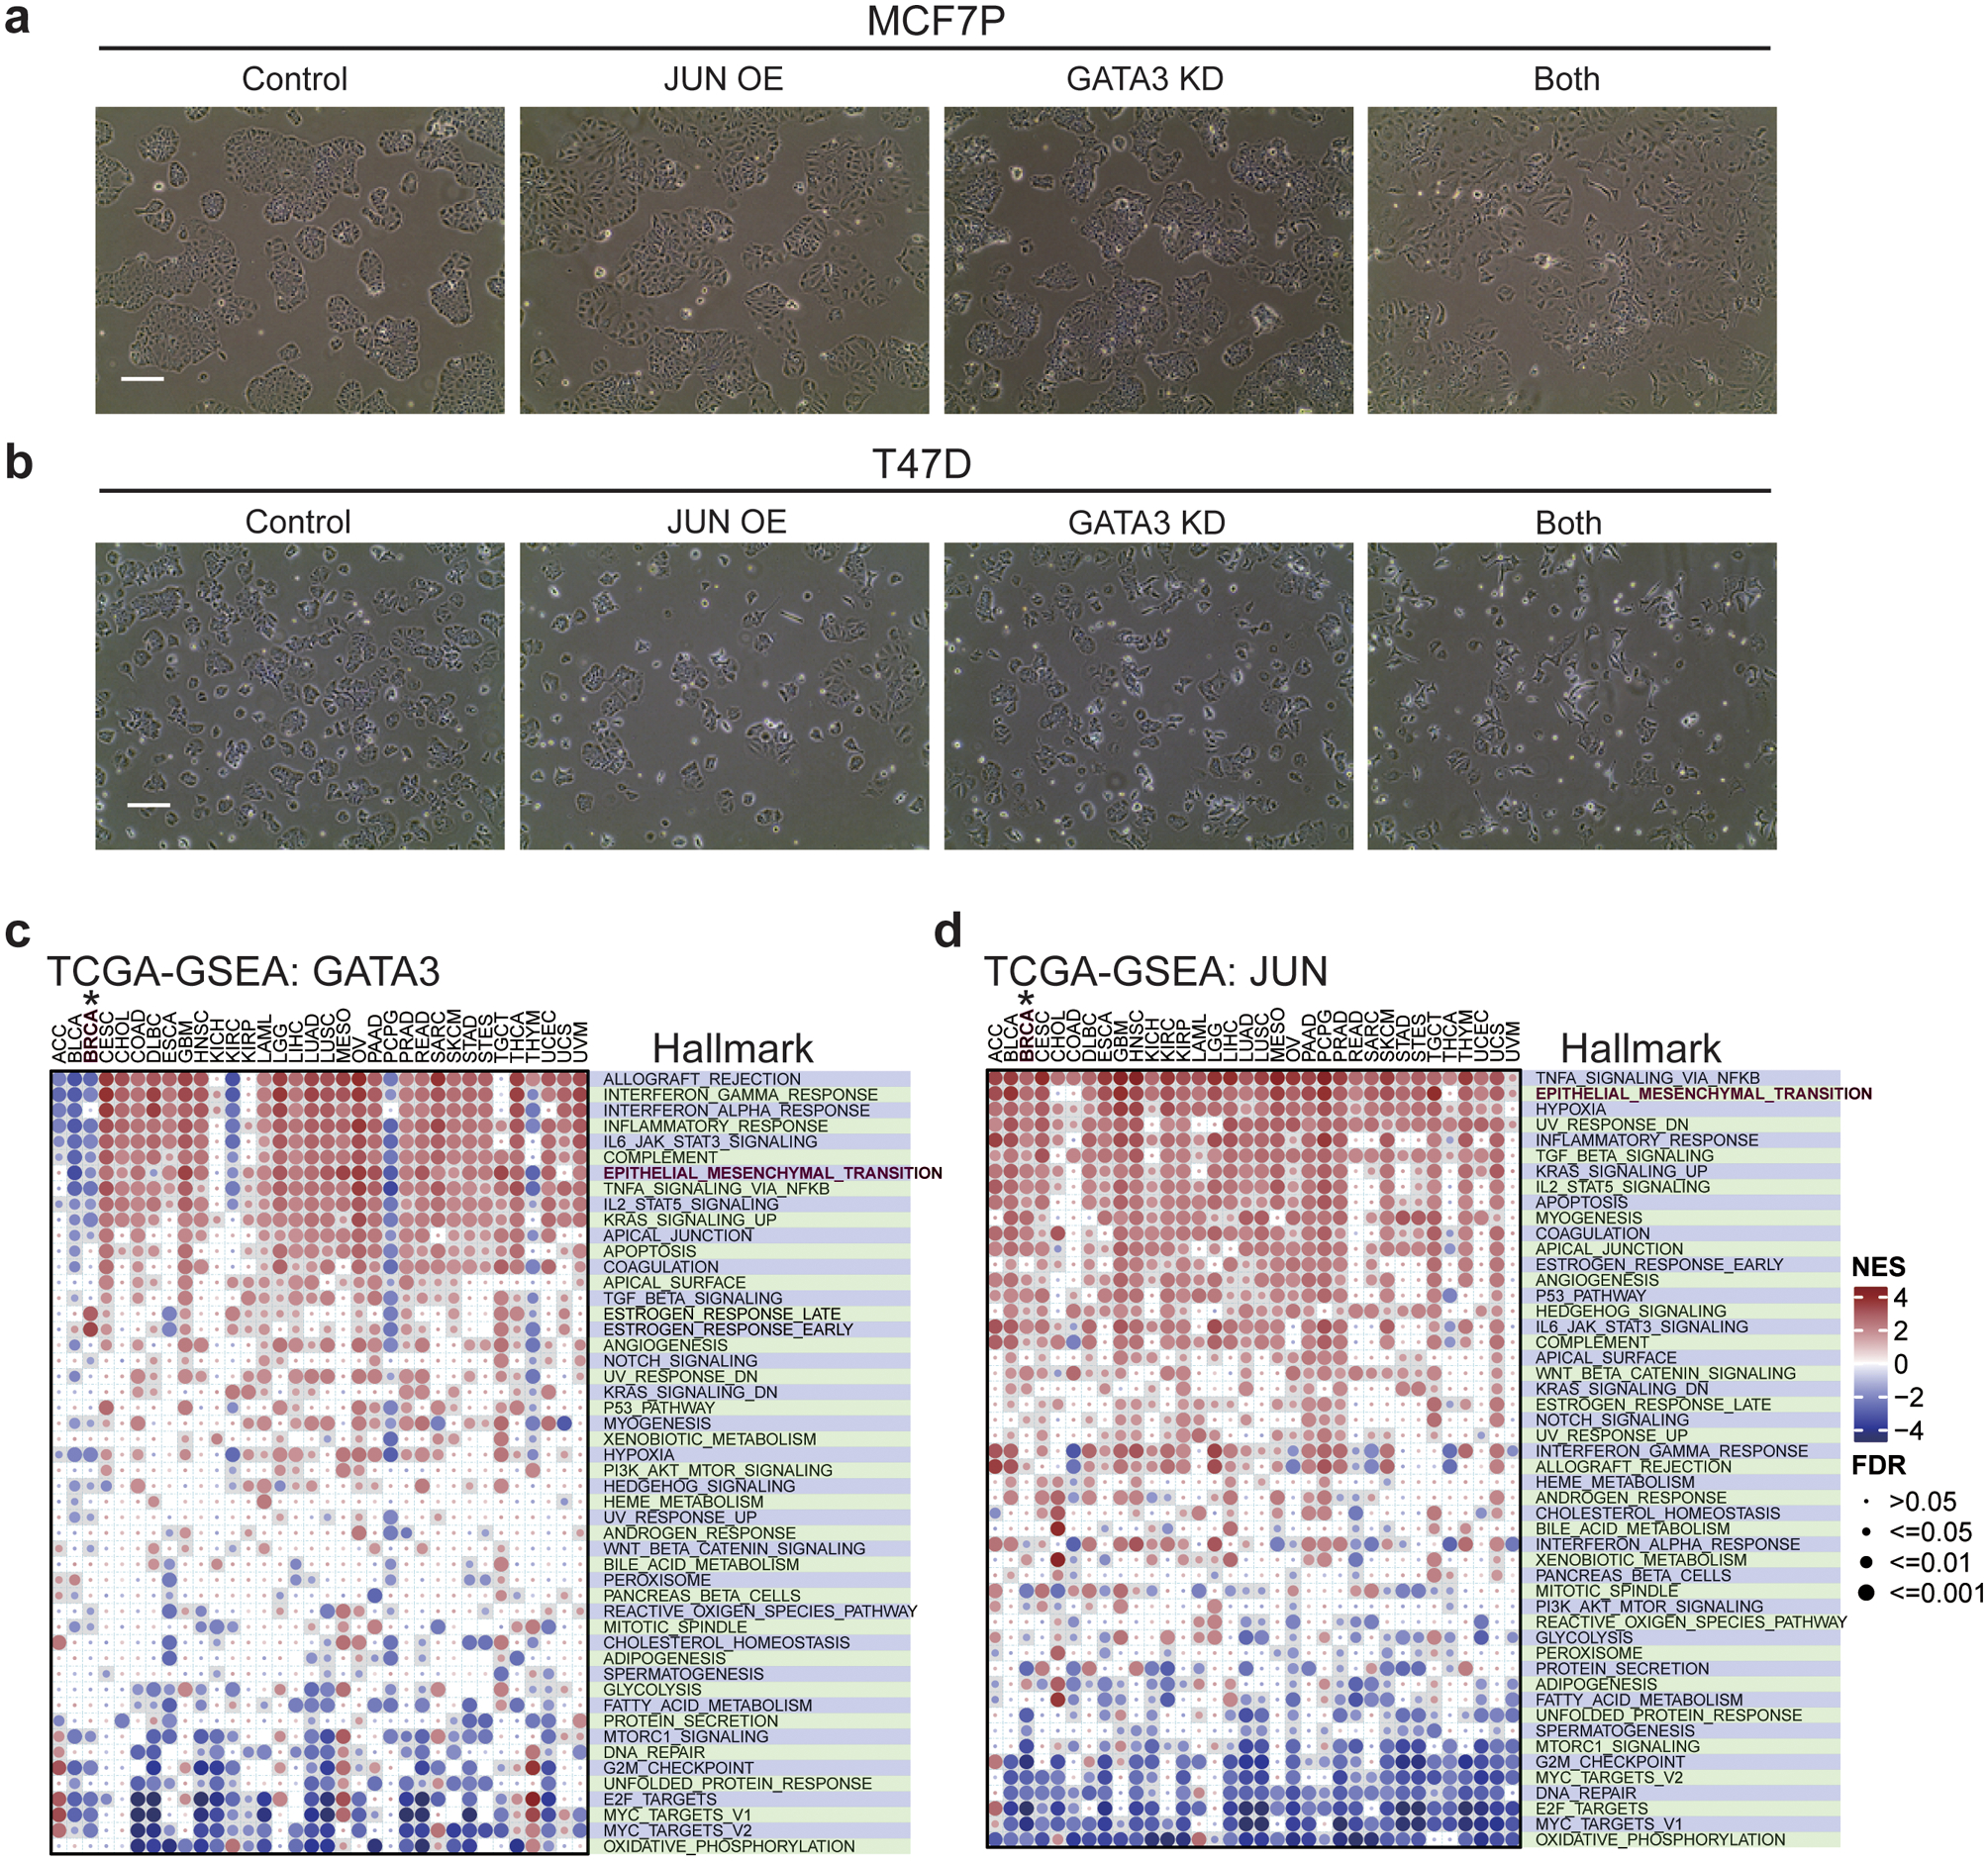
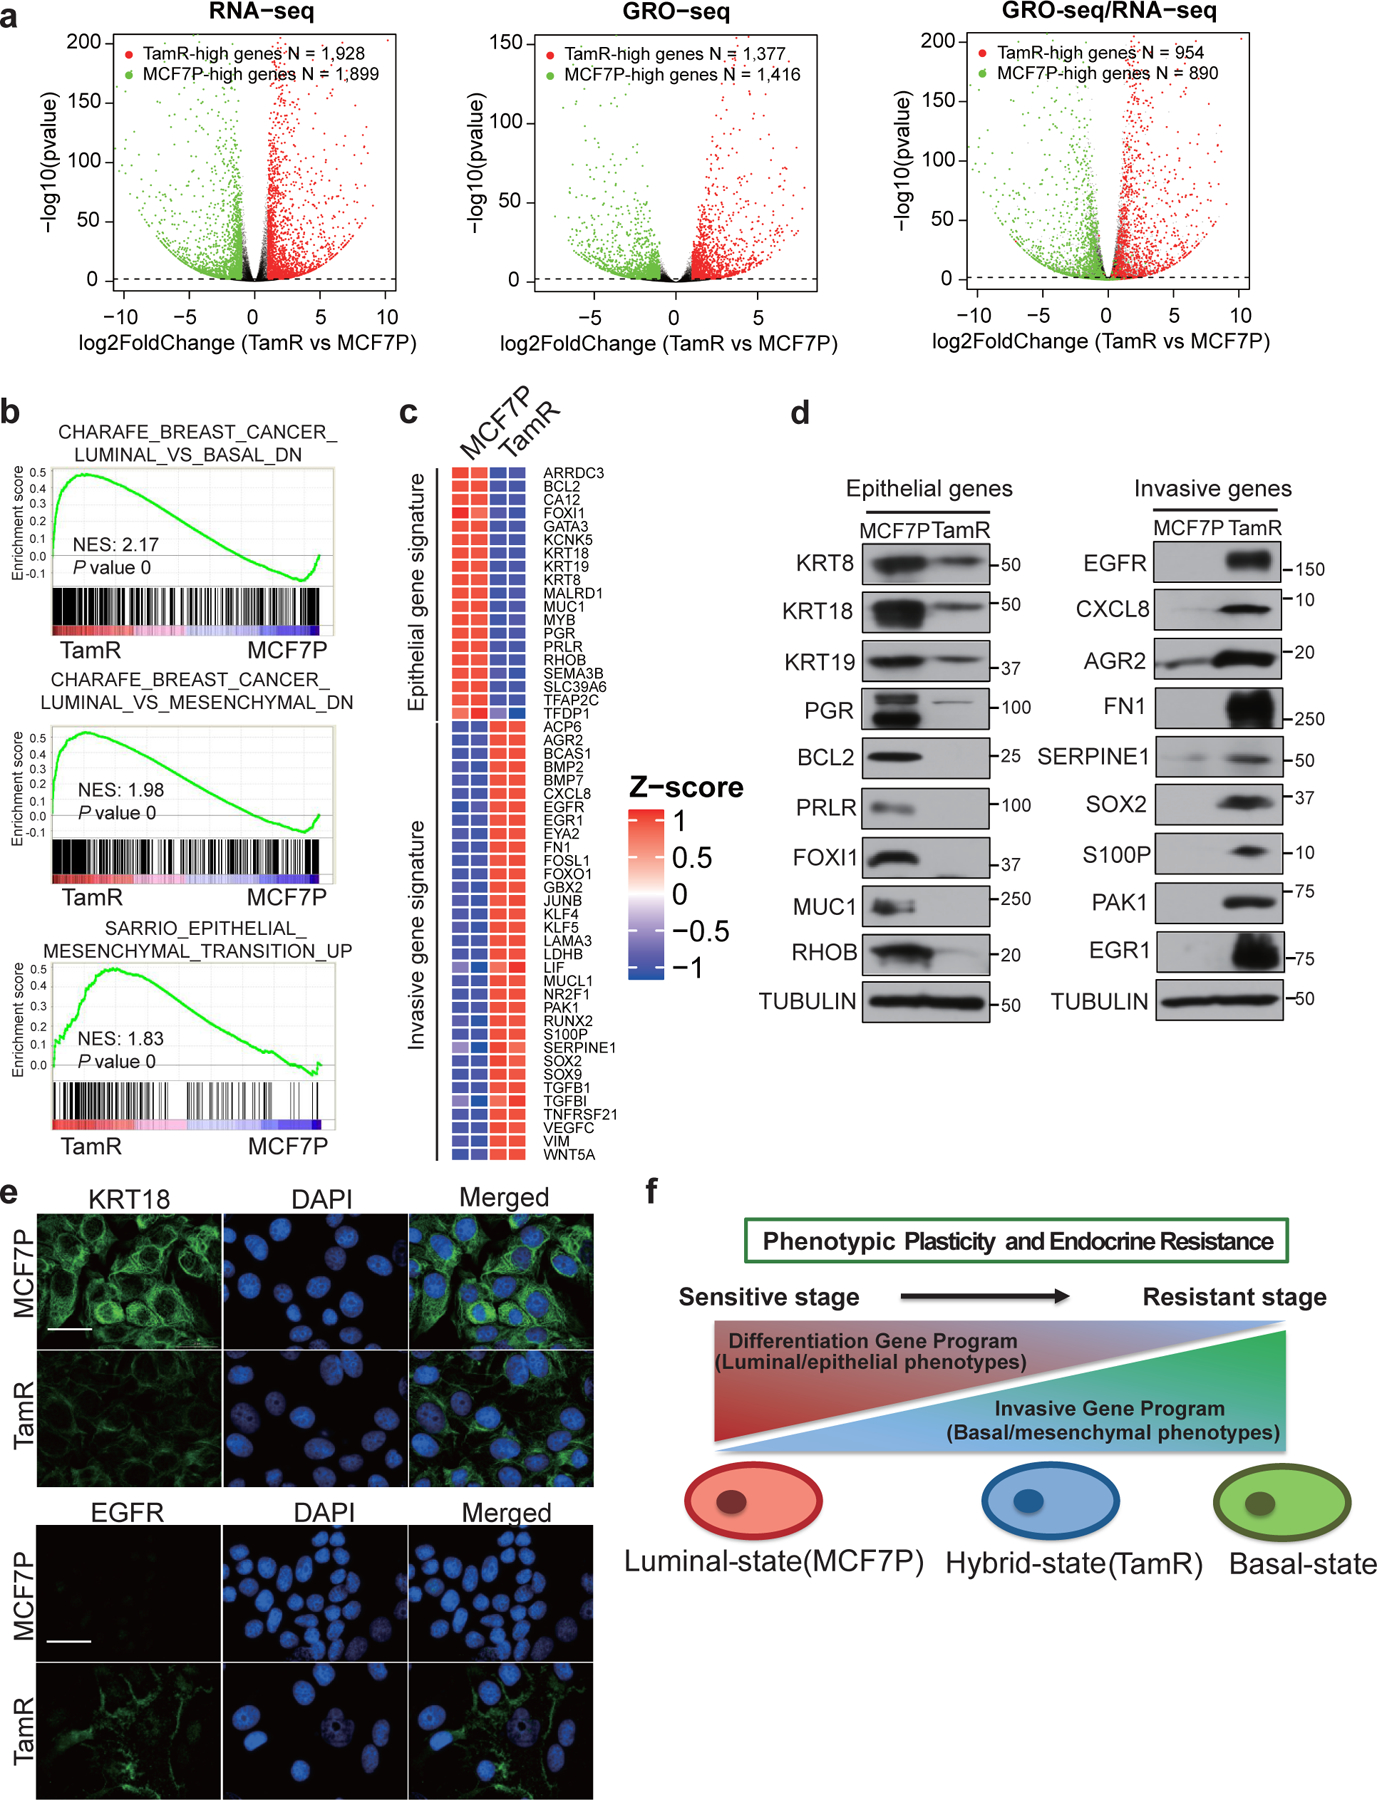
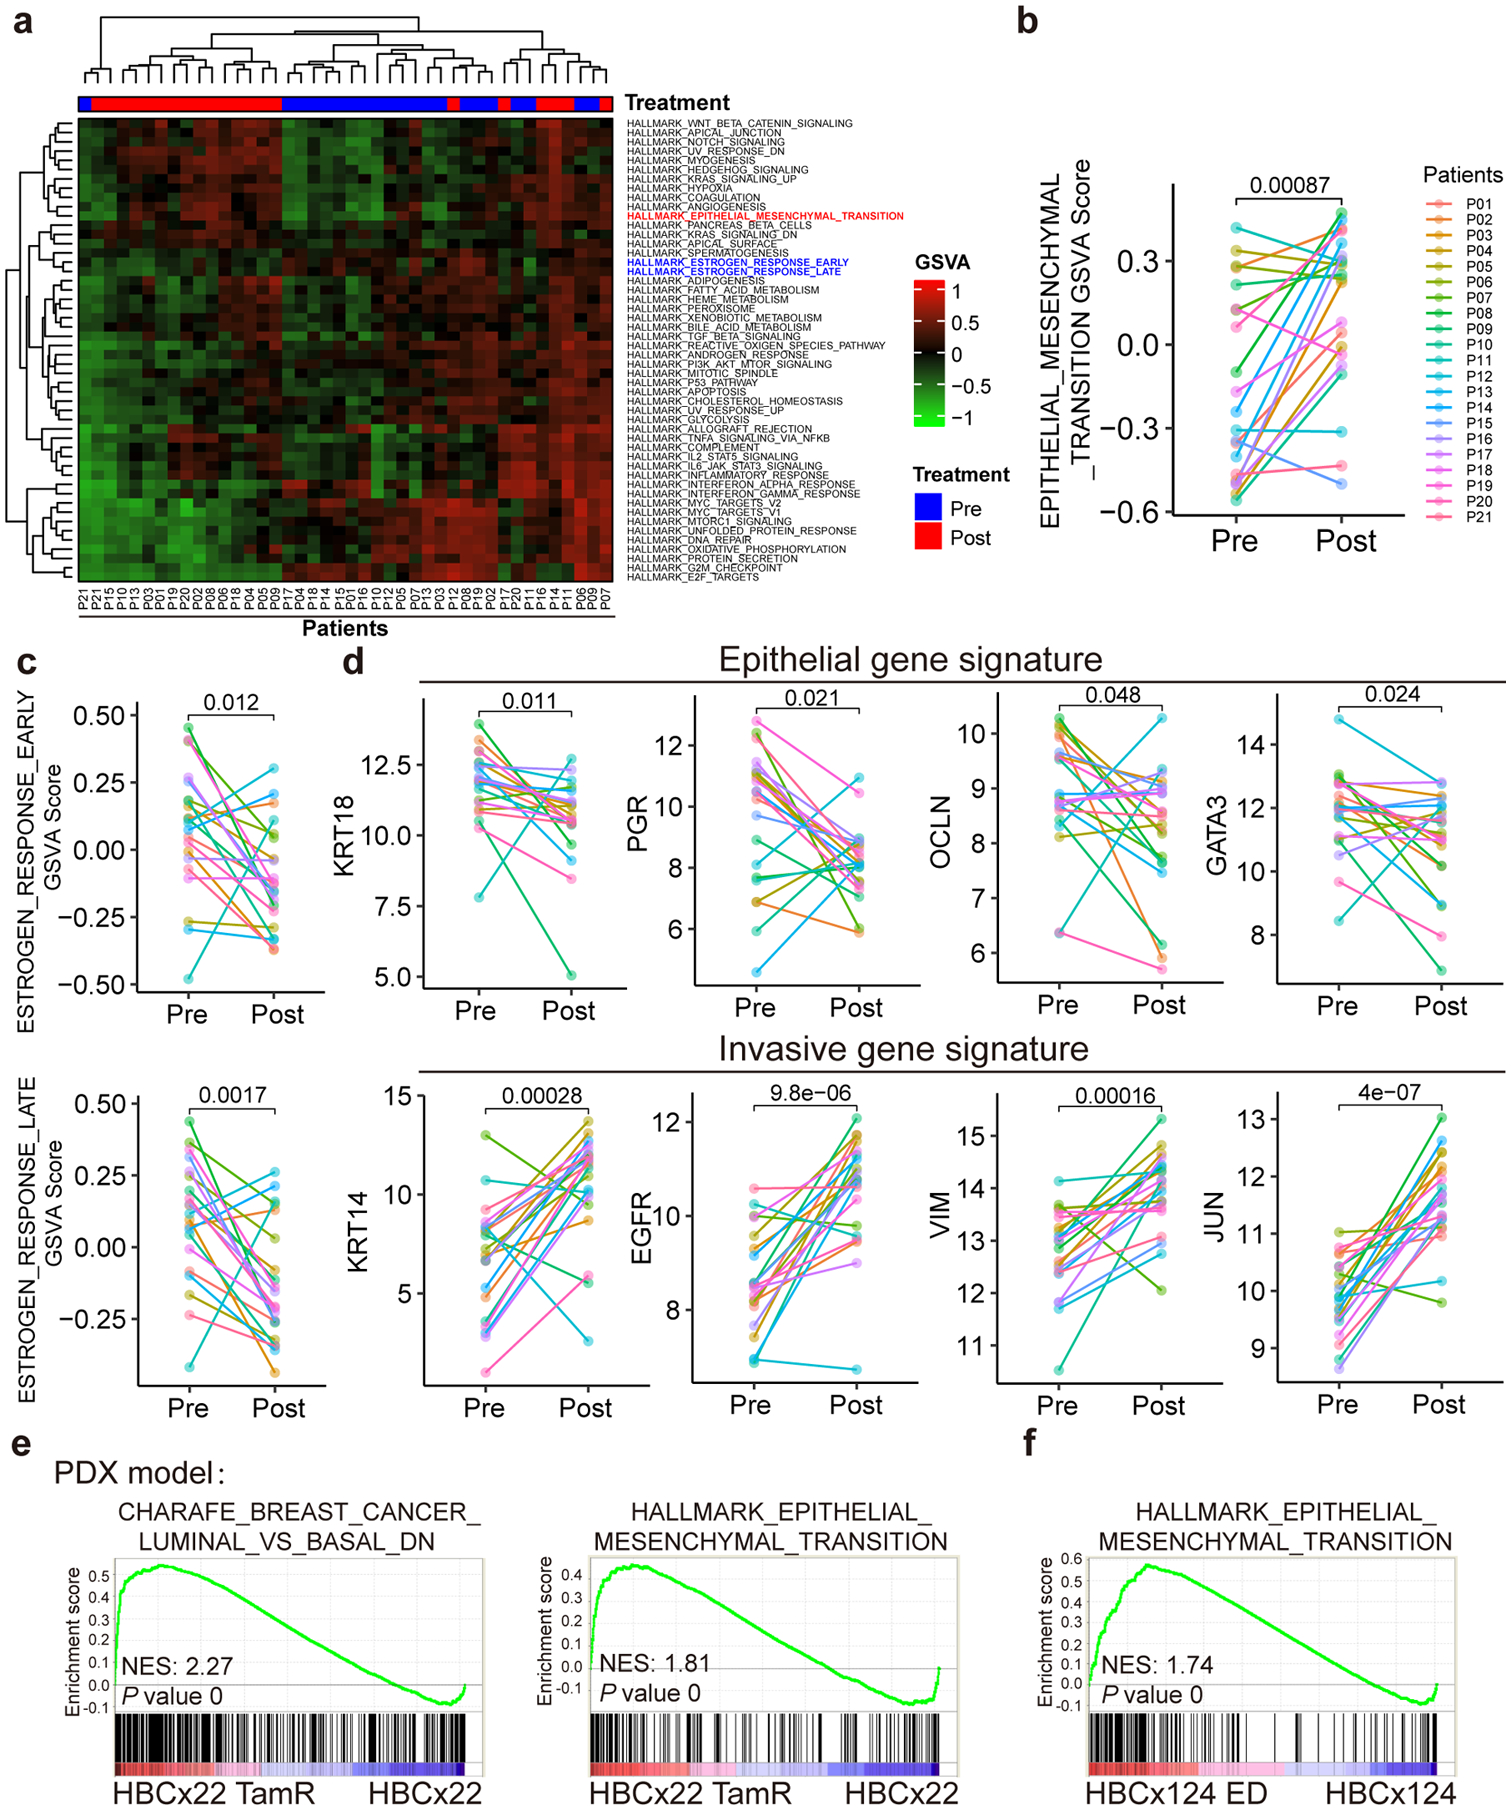
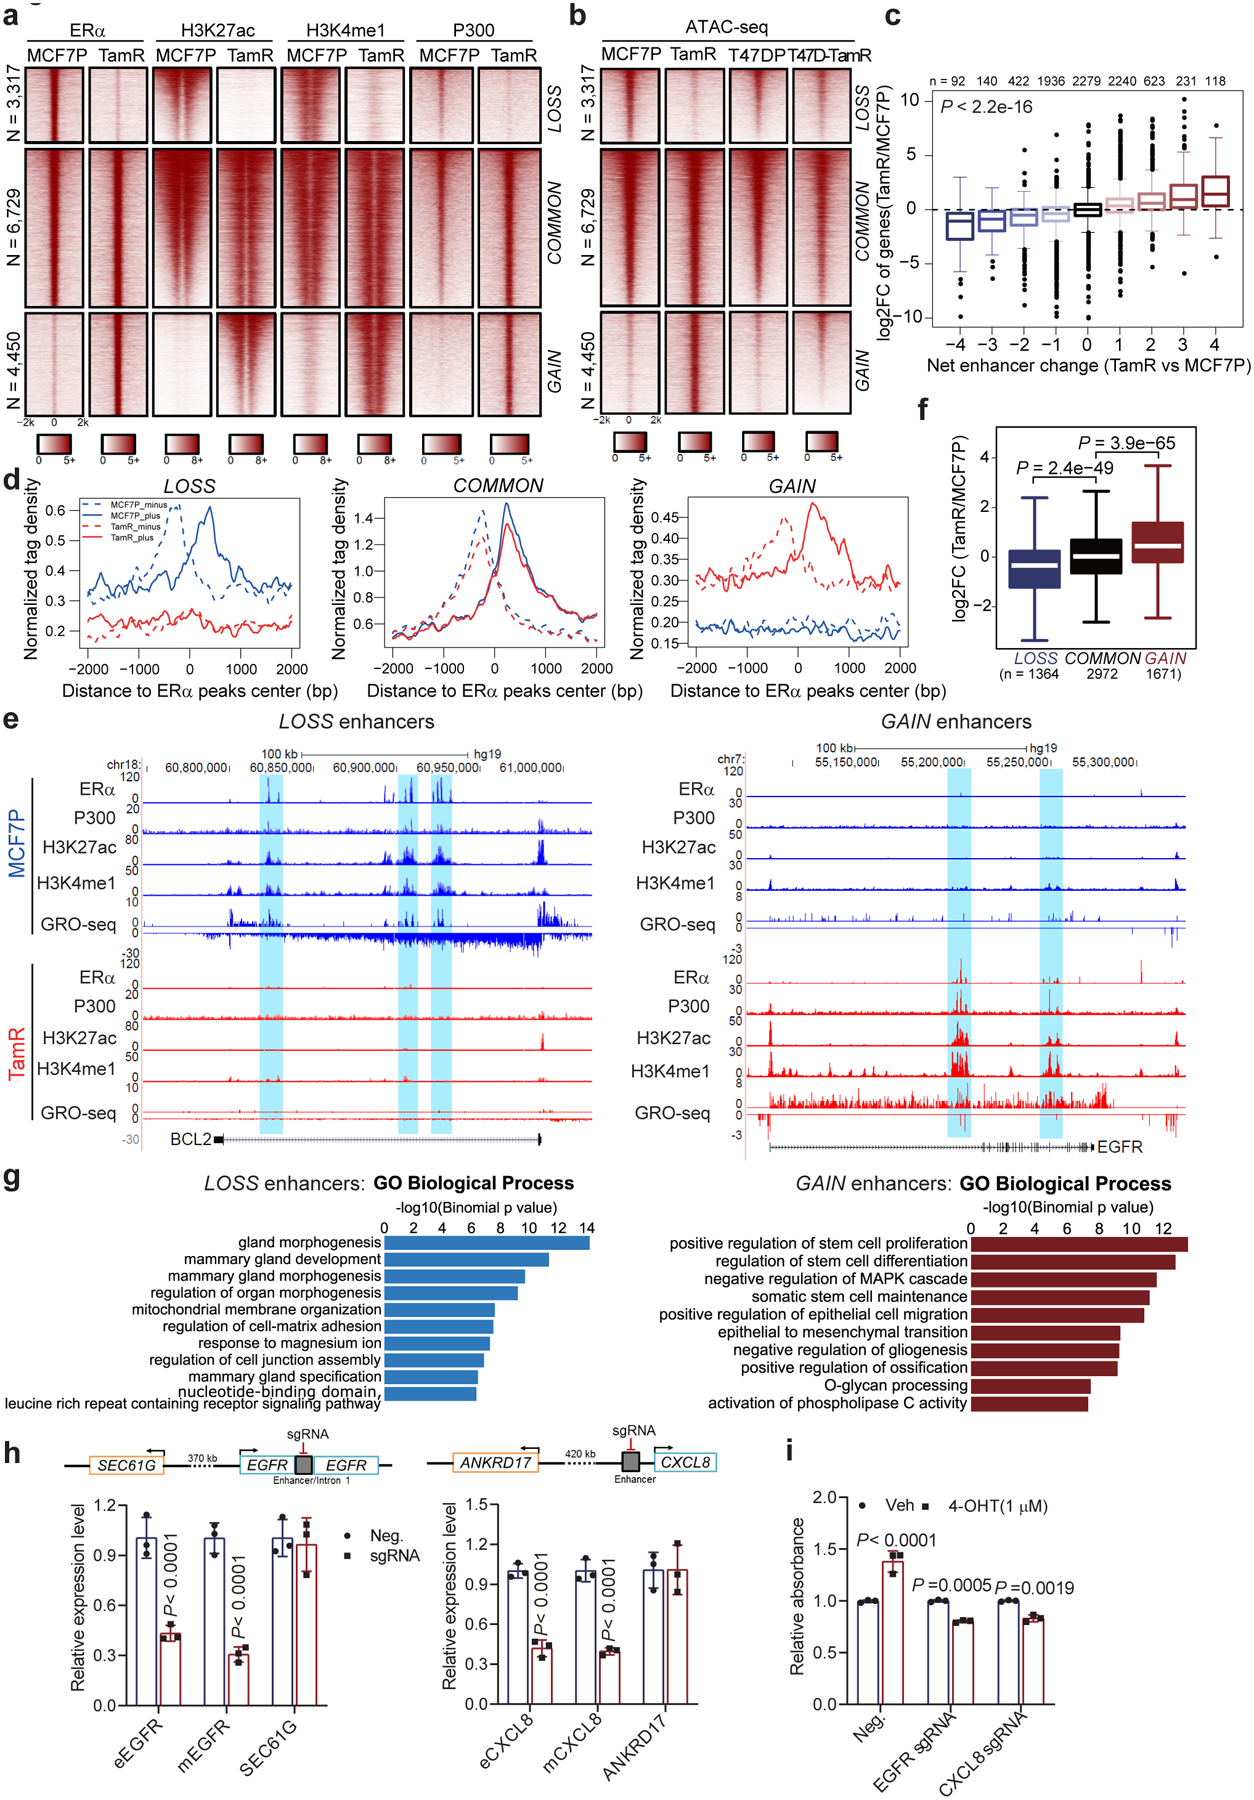
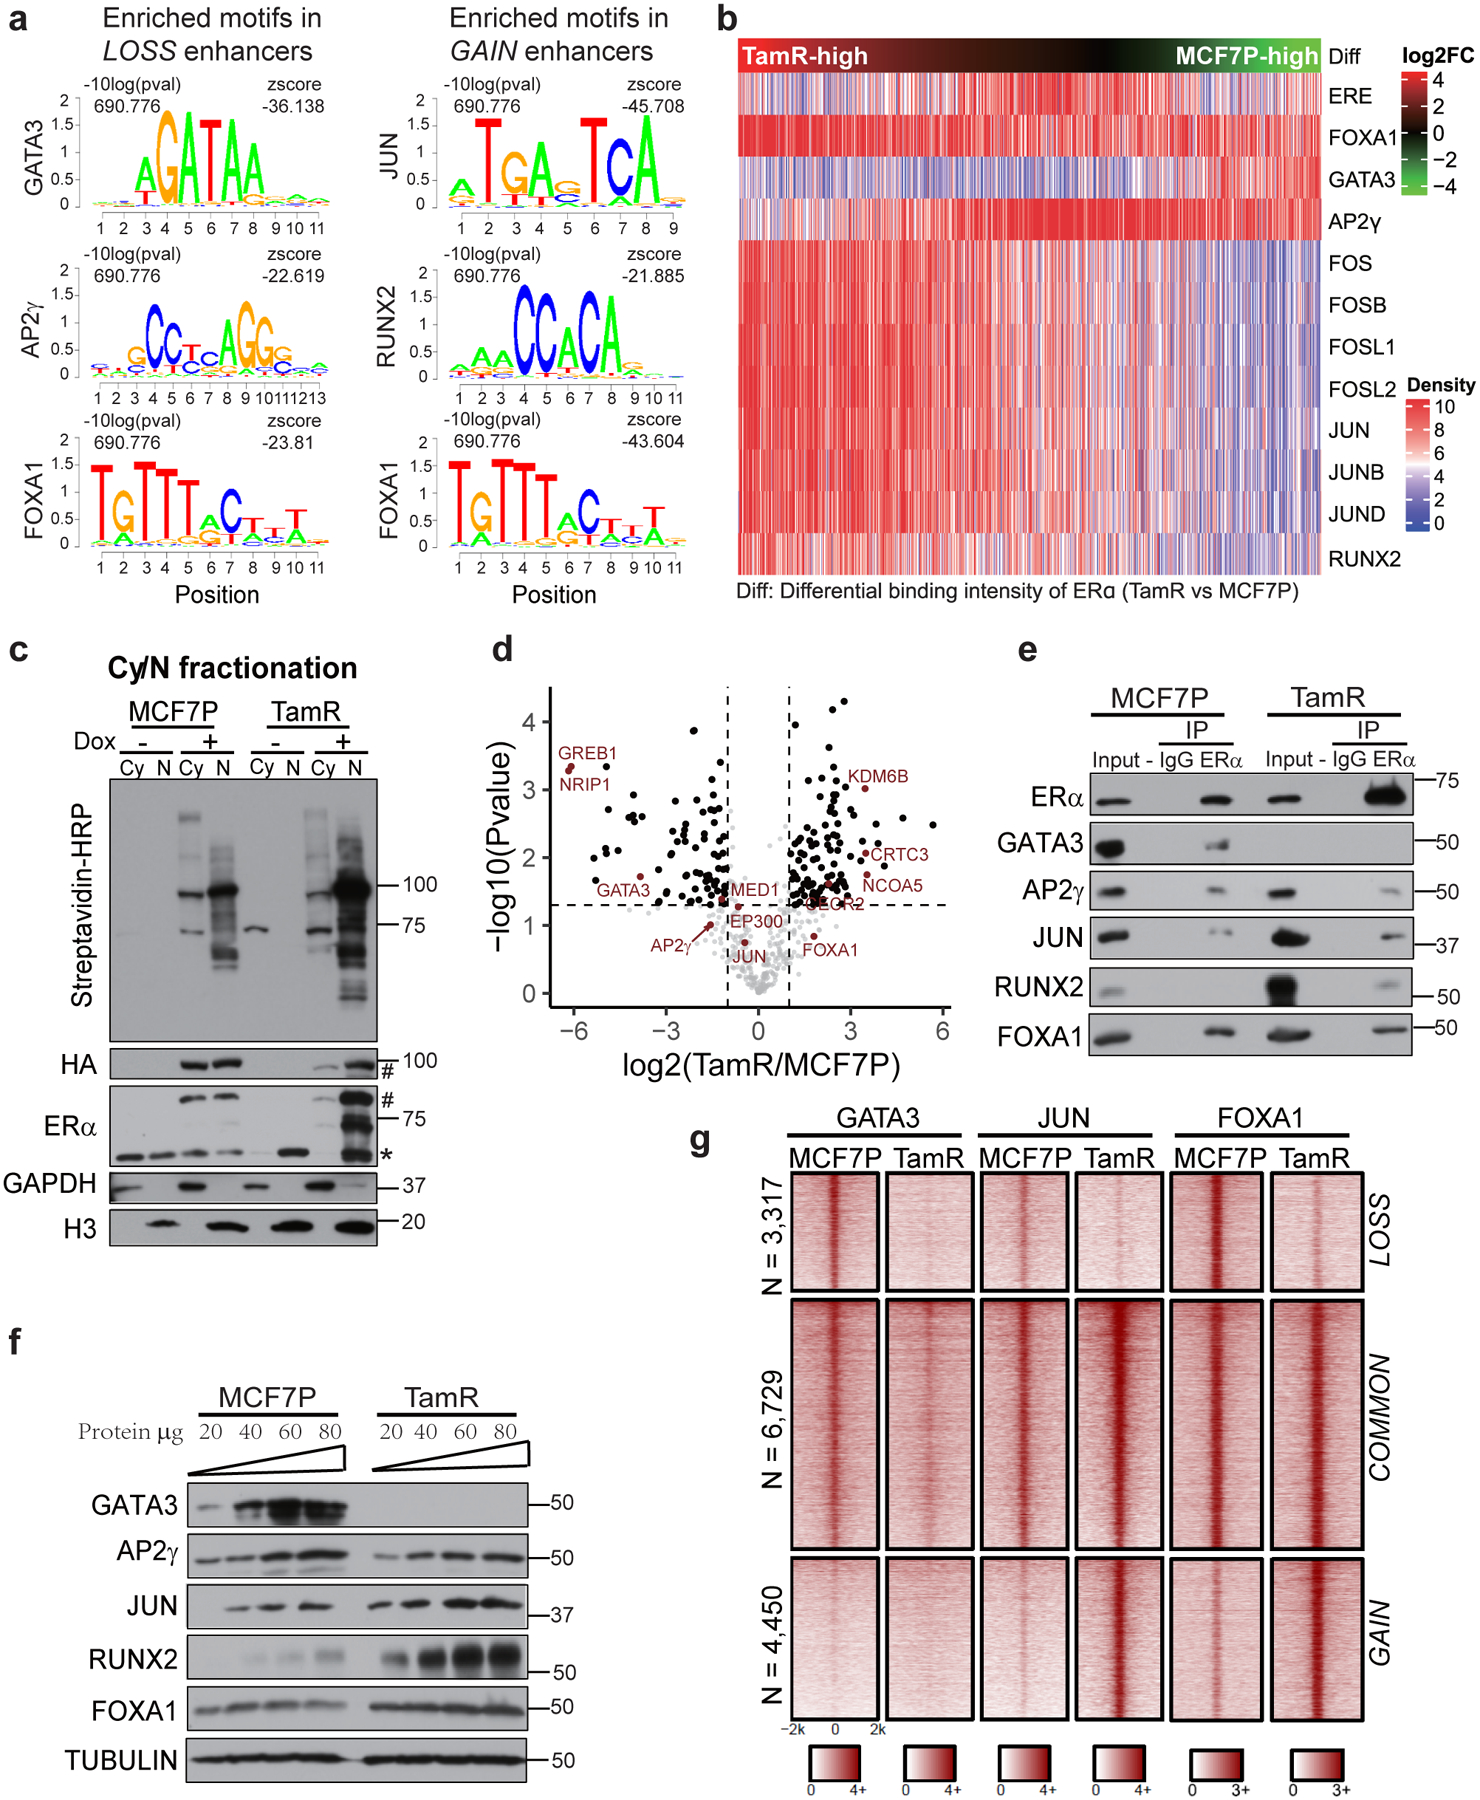
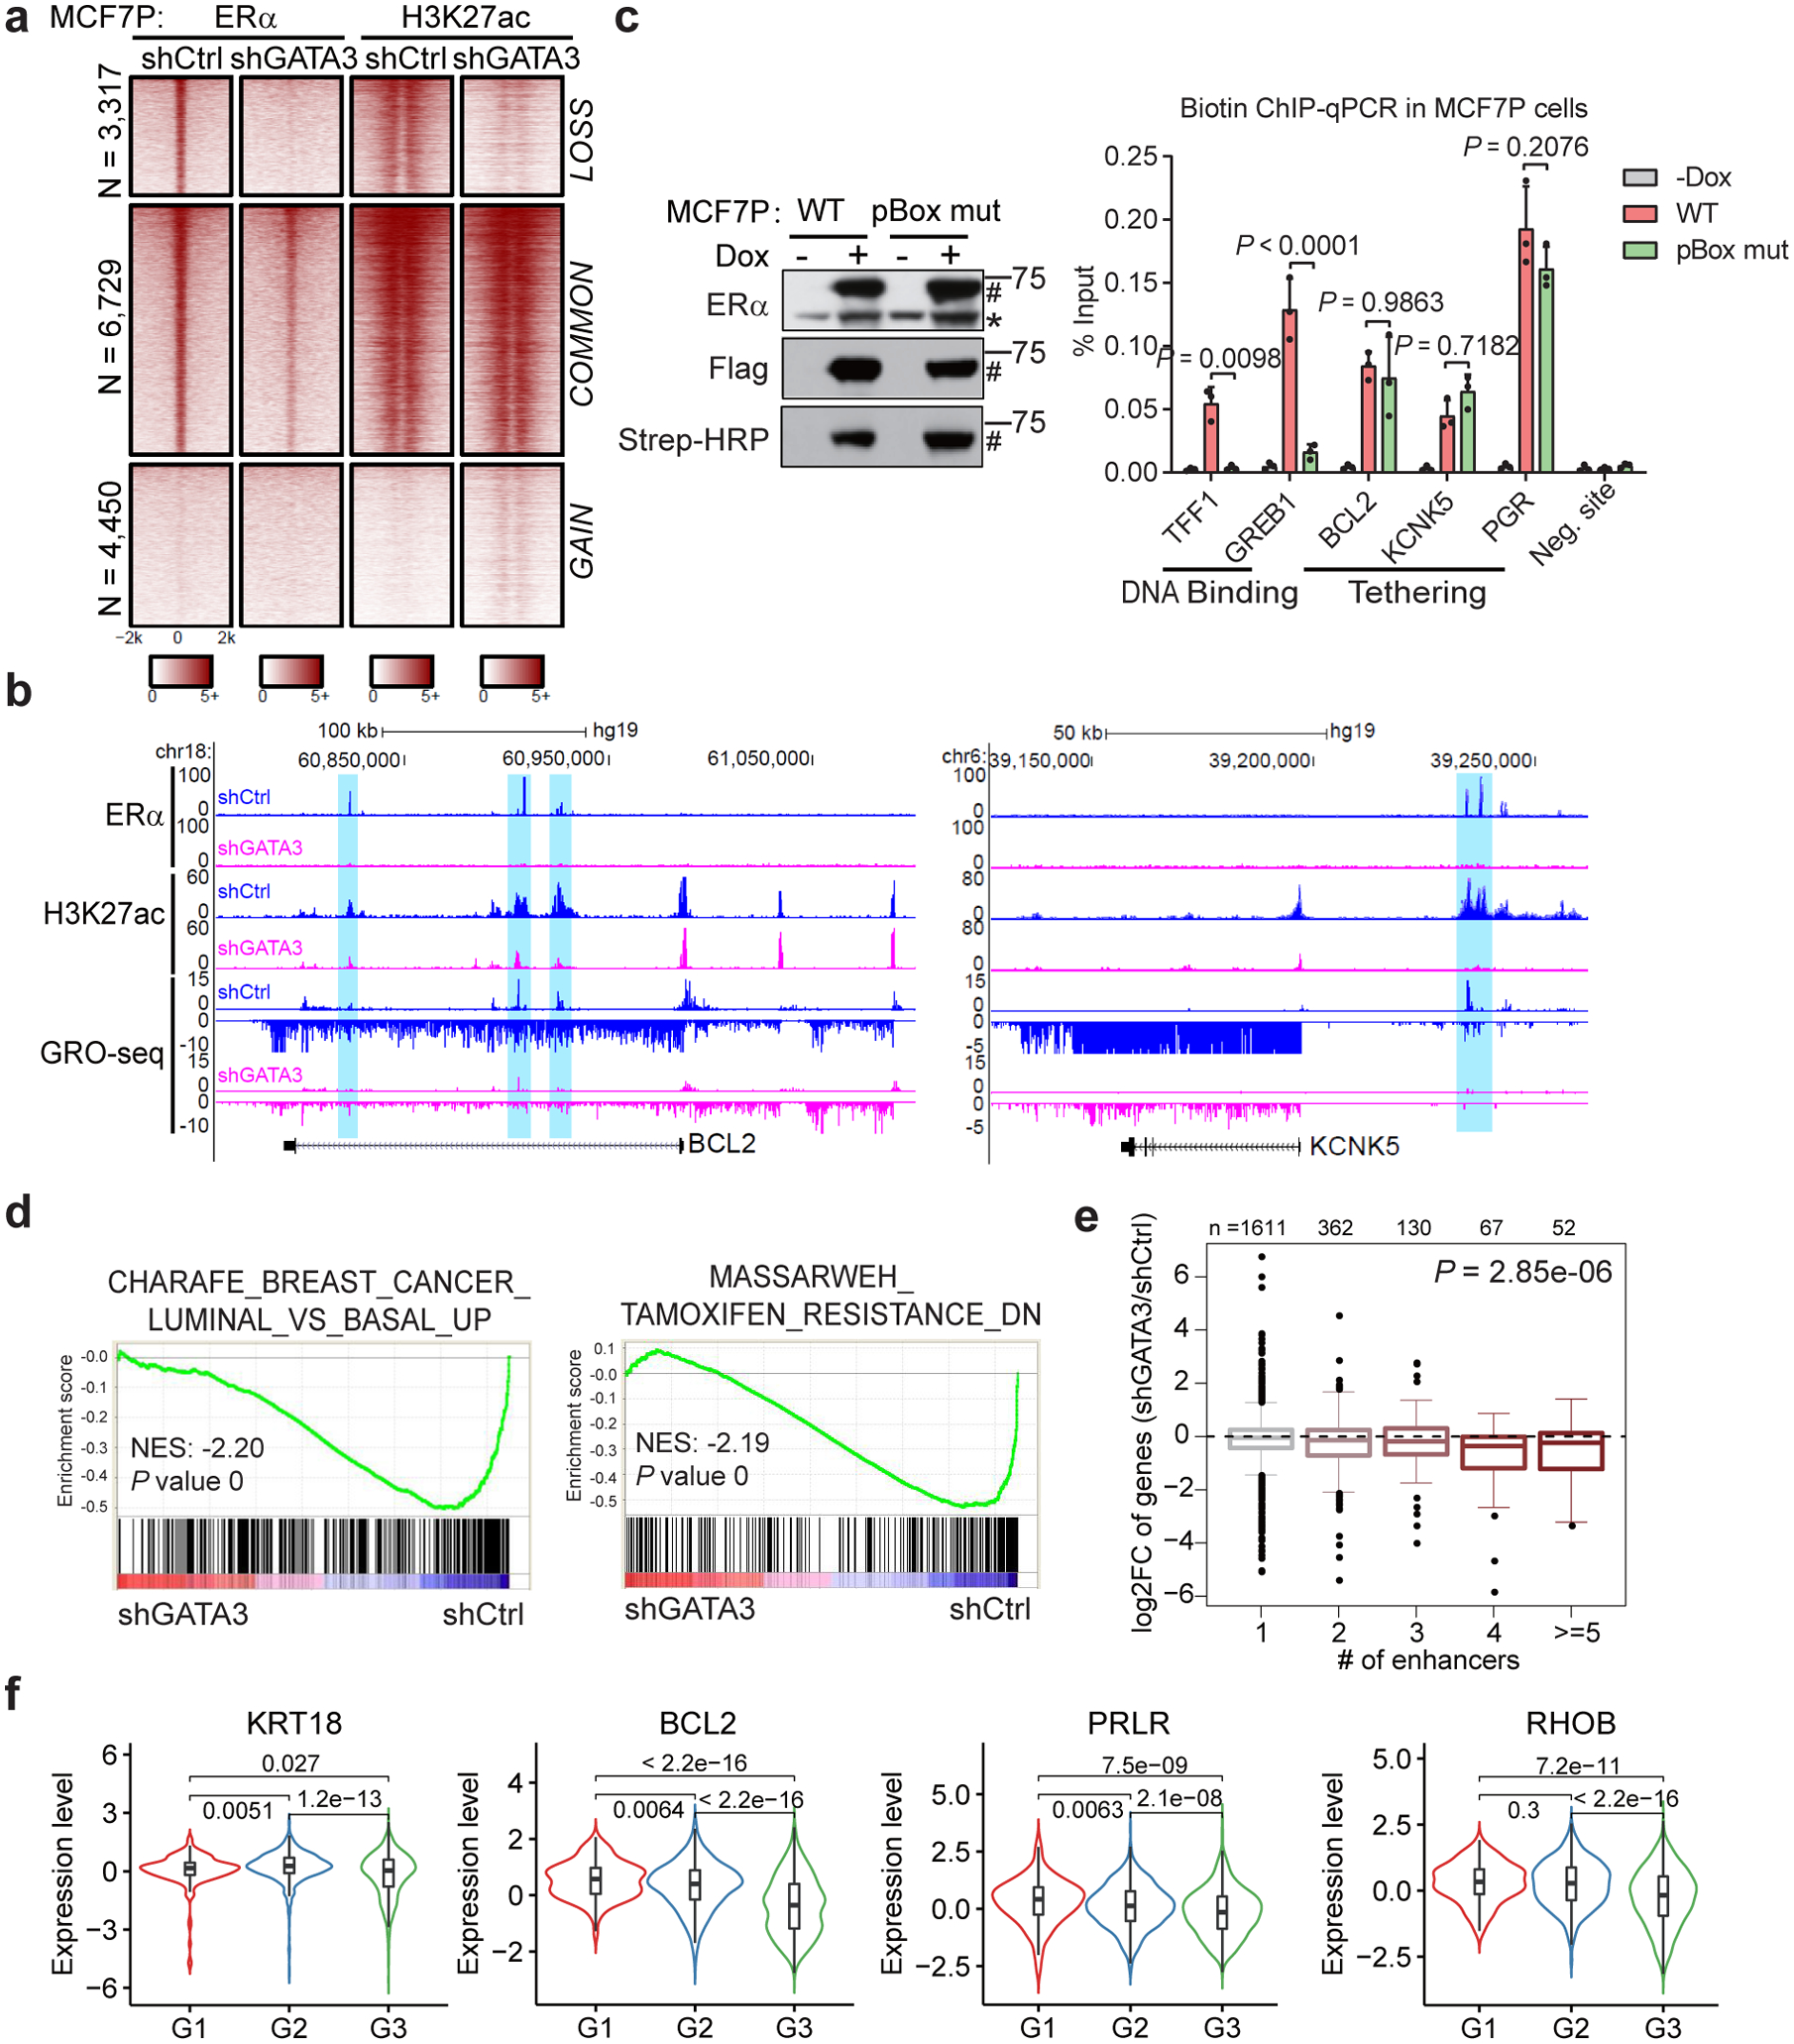
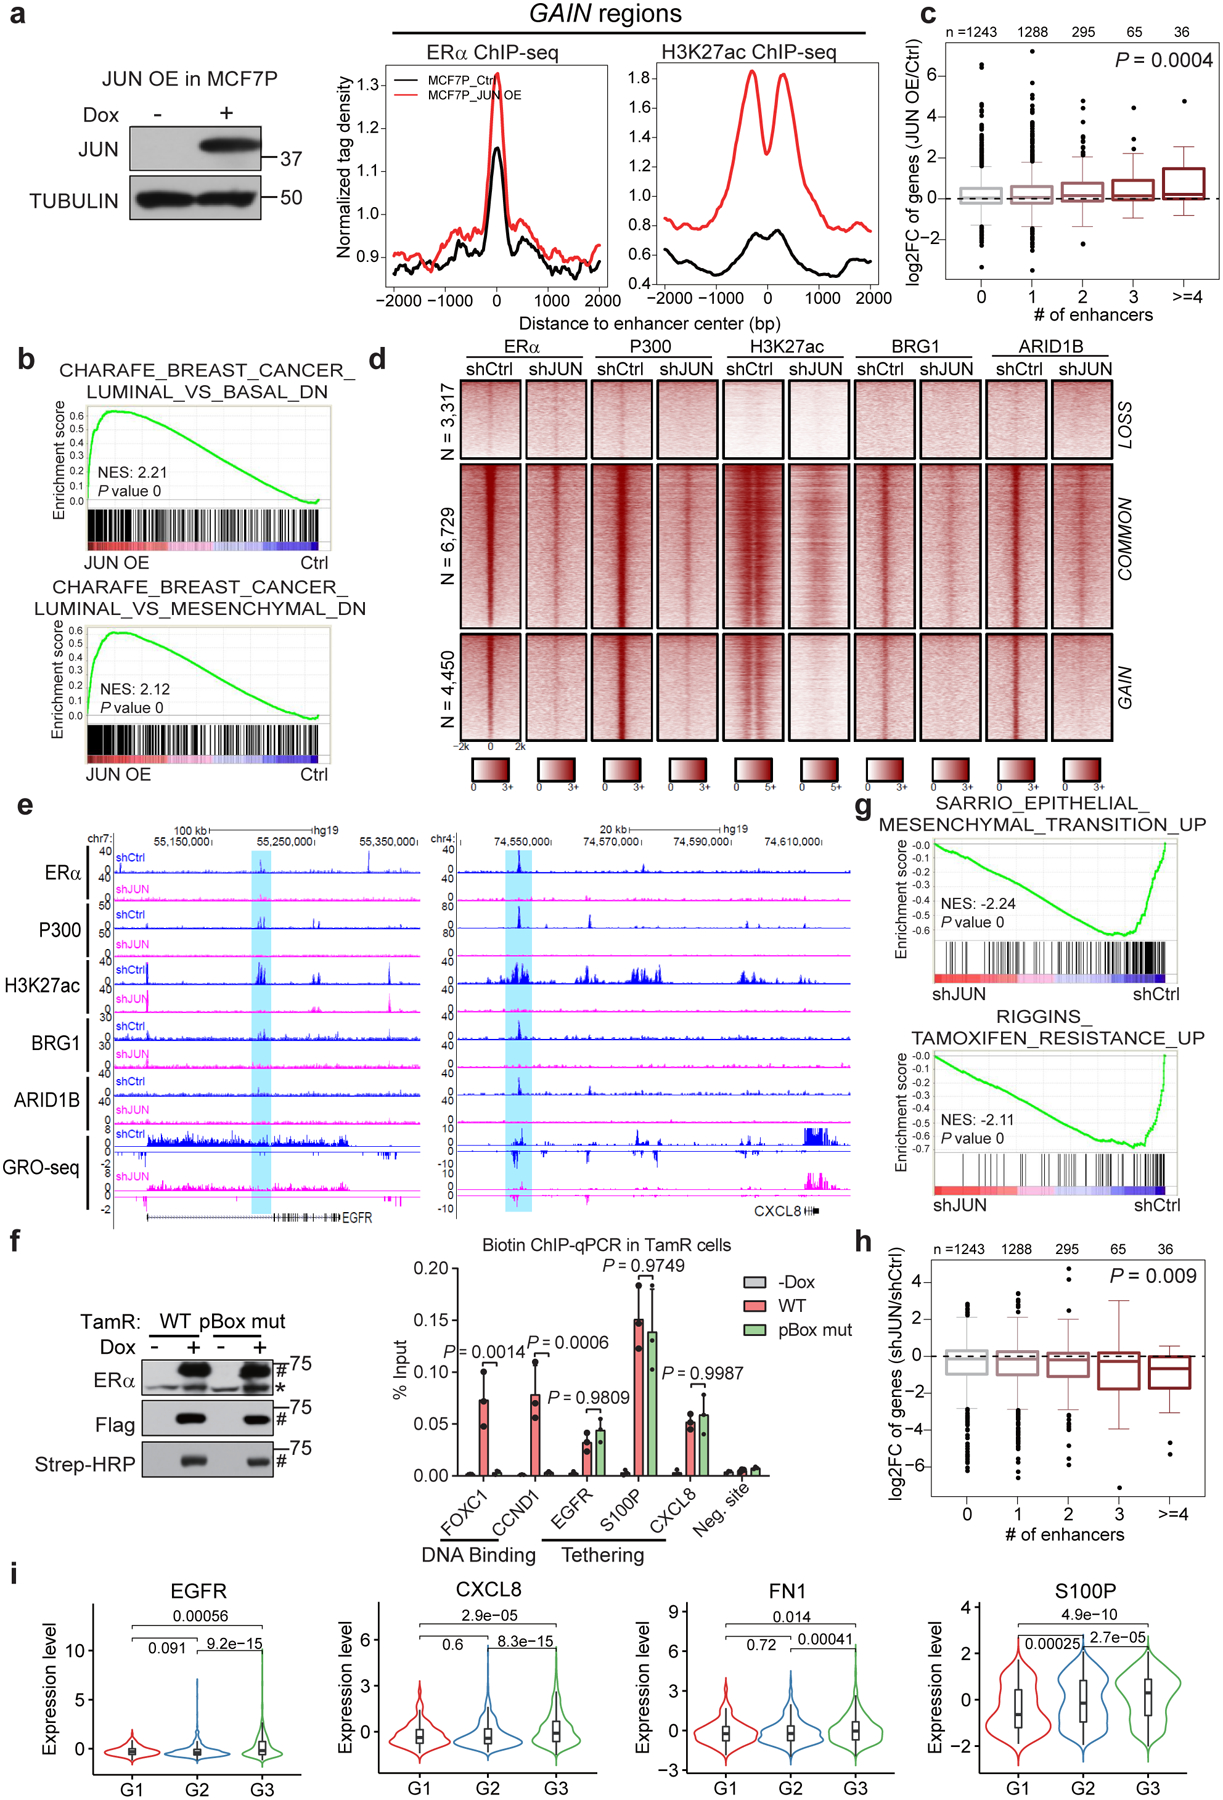
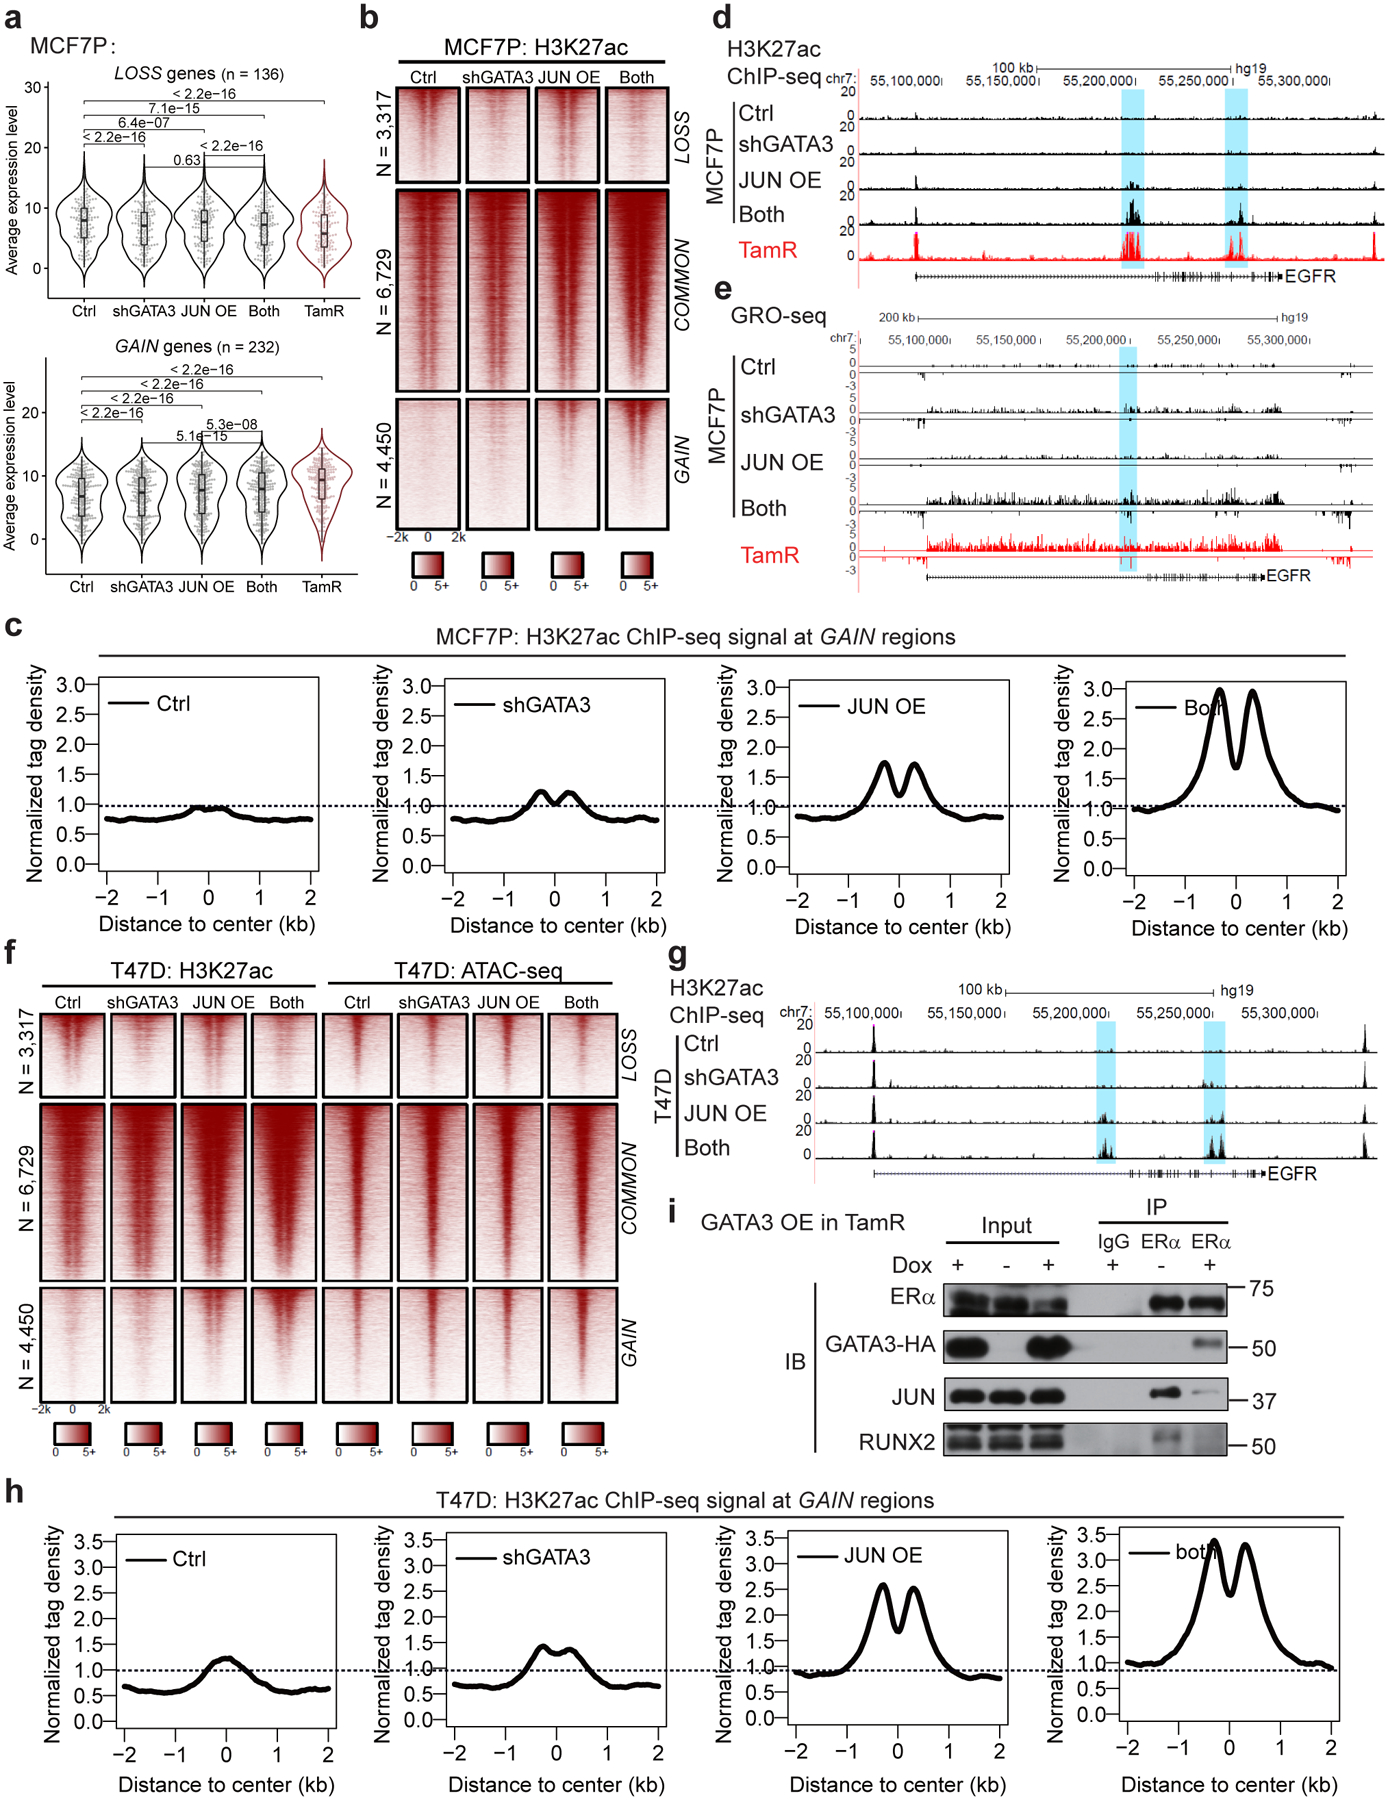
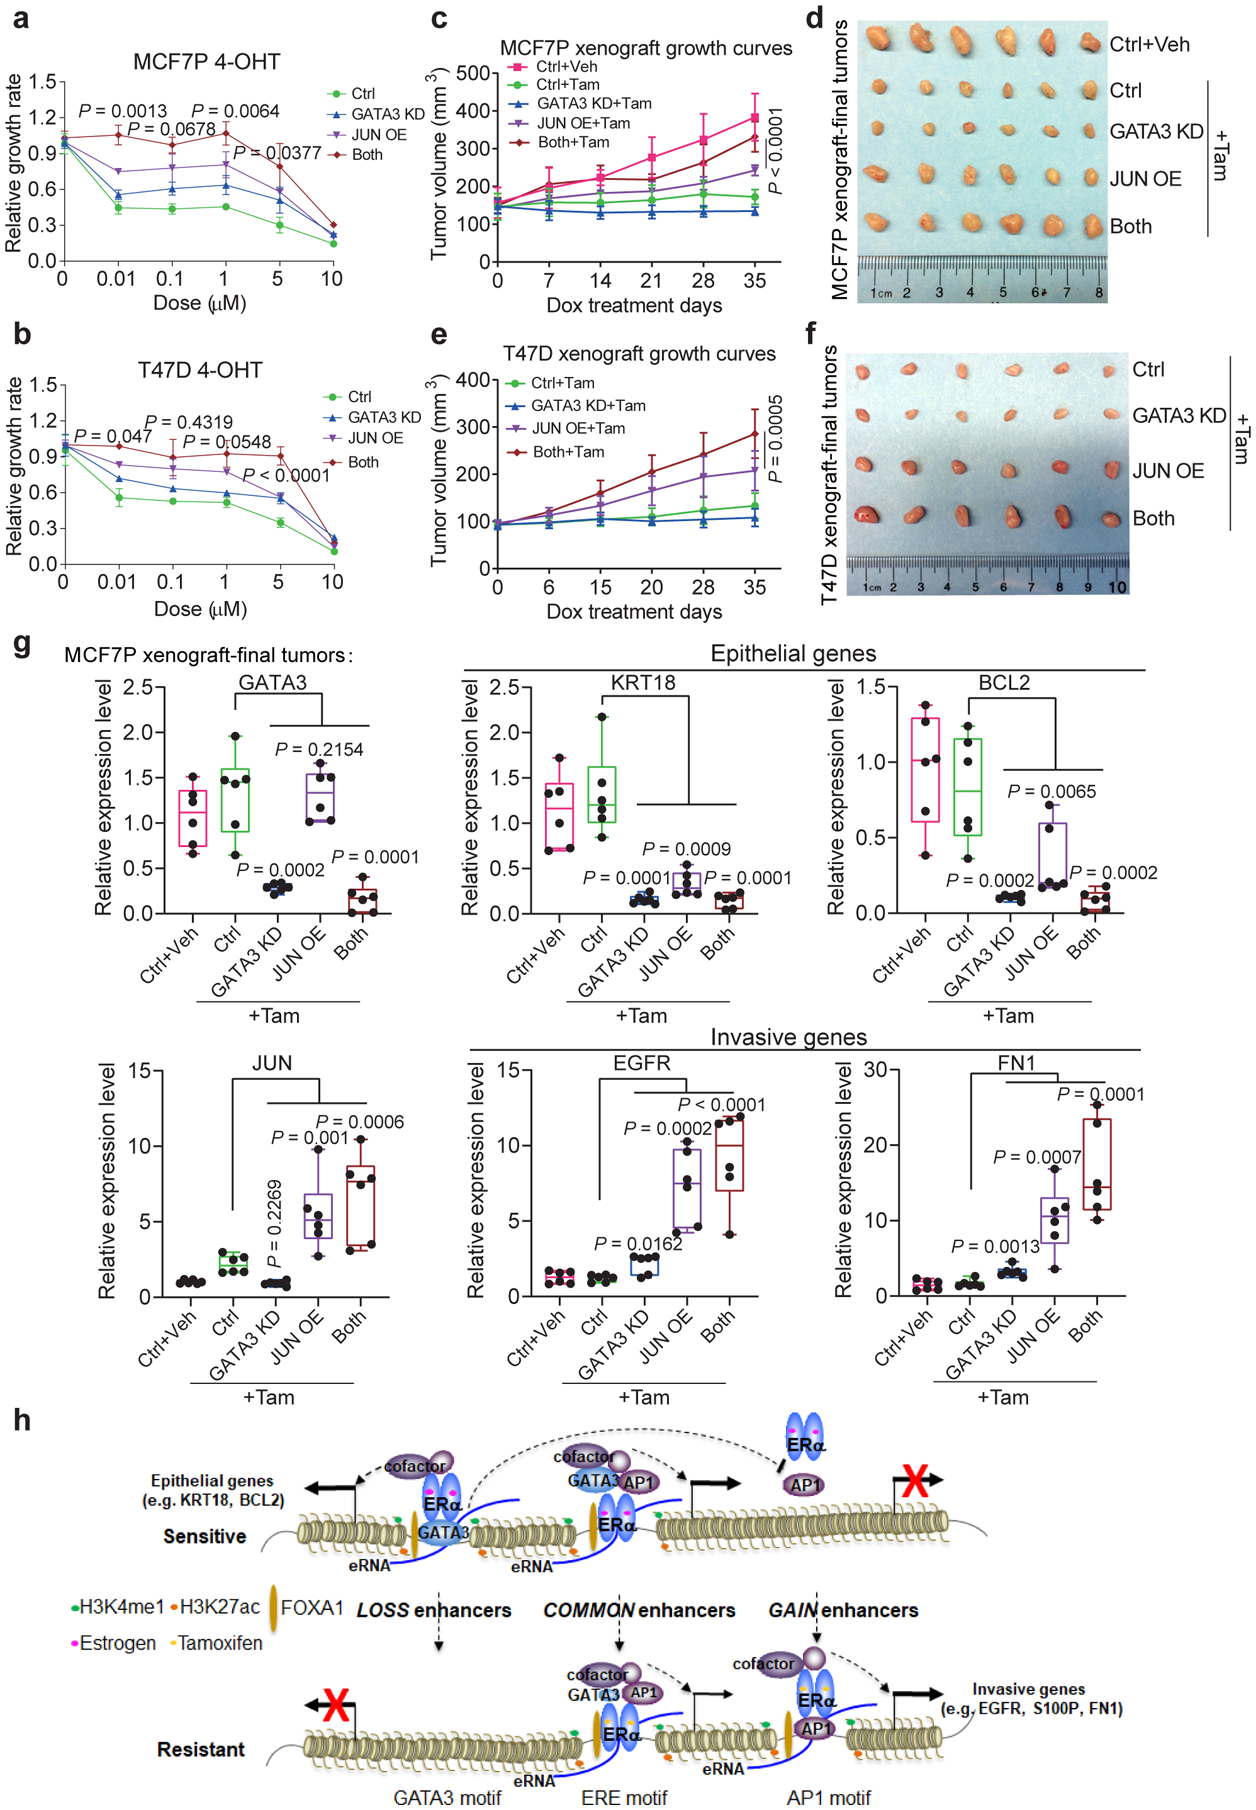
Acquired therapy resistance is a major problem for anticancer treatment, yet the underlying molecular mechanisms remain unclear. Using an established breast cancer cellular model, we show that endocrine resistance is associated with enhanced phenotypic plasticity, indicated by a general downregulation of luminal/epithelial differentiation markers and upregulation of basal/mesenchymal invasive markers. Consistently, similar gene expression changes are found in clinical breast tumours and patient-derived xenograft samples that are resistant to endocrine therapies. Mechanistically, the differential interactions between oestrogen receptor α and other oncogenic transcription factors, exemplified by GATA3 and AP1, drive global enhancer gain/loss reprogramming, profoundly altering breast cancer transcriptional programs. Our functional studies in multiple culture and xenograft models reveal a coordinated role of GATA3 and AP1 in re-organizing enhancer landscapes and regulating cancer phenotypes. Collectively, our study suggests that differential high-order assemblies of transcription factors on enhancers trigger genome-wide enhancer reprogramming, resulting in transcriptional transitions that promote tumour phenotypic plasticity and therapy resistance.


Figures

Extended Data Fig. 1
Extended Data Fig. 1. Genomic analyses identify phenotypic plasticity-related transcriptional changes in breast cancer cells with endocrine resistance.
a, Cell growth rate assays of MCF7P and TamR lines in the presence of 4-OHT showing the endocrine resistance of TamR line. P values were determined by two-sided t-tests. b, Brightfield images of MCF7P and TamR lines at ×100 magnification showing different morphology for these two lines. MCF7P displayed a typical epithelial cell-like morphology and grew in tightly packed cobblestone-like clusters. TamR began spreading as individual cells, a phenotype similar to mesenchymal cells. Scale bar, 100 μm. c, ERα protein levels in MCF7P and TamR cells detected by Western blots using a serial dilution of whole cell extract for semi quantitative purpose. GAPDH was used as a loading control. d, Structural diagram of ERα protein showing the positions of point mutations in the ligand-binding domain (LBD) that were reported in endocrine-resistant or metastatic ERα+ breast cancers before (left). No LBD point mutation was detected in this TamR cell line with Sanger sequencing (right). e, Genome browser snap images of the GRO-seq and RNA-seq signals at PGR and PRLR loci showing a significant downregulation of these two epithelial markers in TamR cells. f, Genome browser snap images of the GRO-seq and RNA-seq signals at gene body regions for S100P and FN1, showing a significant upregulation of these two cancer invasiveness-associated genes in TamR cells. g, h, RT-qPCR analyses of mRNA levels of selected epithelial markers (g) or invasive genes (h) in MCF7P and TamR cell lines. The epithelial markers are downregulated and invasiveness-associated genes are upregulated in TamR cells. For a, g and h, data are presented as mean ± s.d. from n=3 independent experiments. b and c are representative of two independent experiments. Unprocessed immunoblots are shown in Source Data Extended Data Fig. 1. Statistical source data are available in Statistical Source Data Extended Data Fig. 1.
Extended Data Fig. 2
Extended Data Fig. 2. Analyses using patient tumor tissues and PDX samples revealed phenotypic plasticity-enhancing transcriptional changes associated with therapy resistance.
a, b, Genome browser snap images of the RNA-seq signals at gene body regions for KRT18 and GATA3 showing the significant downregulation of these two epithelial markers at post-treatment stage in the 8 randomly picked therapy-resistant patients. c, d, Genome browser snap images of the RNA-seq signals at gene body regions for EGFR and JUN showing the significant upregulation of these two invasive genes at post-treatment stage in the 8 randomly picked therapy-resistant patients. e, f, RT-qPCR analyses of mRNA levels of selected epithelial and invasive genes in paired parental (HBCx22) vs tamoxifen-resistant (HBCx22 TamR) PDX tumors (e), and in paired parental (HBCx124) vs estrogen deprivation derived resistant (HBCx124 ED) PDX tumors (f). The results show all of these epithelial markers are downregulated and all of these invasive genes are upregulated in endocrine-resistant PDX tumors. Data are presented as mean ± s.d. from n=3 independent experiments. P values were determined by two-sided t-tests. Statistical source data are available in Statistical Source Data Extended Data Fig. 2.
Extended Data Fig. 3
Extended Data Fig. 3. Endocrine resistance accompanies global enhancer reprogramming that drives plasticity-related gene transcription.
a, Genomic annotations of the H3K27ac ChIP-seq signals in MCF7P and TamR cell lines. b, Volcano plots showing the changes of H3K27ac signals at promoter regions correlate well with the changes in gene expression detected by RNA-seq in TamR cells. n=2 biologically independent experiments, and P values were determined by Wald test with Benjamini-Hochberg adjustment. c, Heatmap of H3K27ac, H3K4me1 and P300 ChIP-seq data for all identified lost, common and gained enhancers genome wide. Chromatin accessibility profiled by ATAC-seq at the corresponding genomic regions is also shown on the right. d, GSEA analyses on RNA-seq data showing the enrichment of oncogenic signatures from MSigDB database in MCF7P or TamR cells. The nominal P values were determined by empirical gene-based permutation test. e, Total super-enhancers (SEs) in MCF7P and TamR cell lines identified by the ROSE program ranked by H3K27ac signal intensities. f, Histograms of the log2(Fold Change) of genes nearest to the differential SEs showing that gained SEs correlate with gene upregulation and lost SEs correlate with gene downregulation. g, Genome browser snap images of lost SE at BCL2 locus and gained SE at CXCL8 locus. The SE gain/loss correlates well with gene upregulation and downregulation detected by GRO-seq.
Extended Data Fig. 4
Extended Data Fig. 4. High-order enhancer component assemblies mediated by differential TF-TF and TF-enhancer interactions correspond with endocrine resistance-associated enhancer reprogramming.
a, Schematic diagram of BioID (in vivo proximity-dependent biotin identification) approach for identification of ERα-interacting nuclear proteins including both TFs and other transcriptional cofactors in alive cells. This technology was used to explore the ERα-interacting (or in the close proximity) enhancer components in either endocrine-sensitive or -resistant cellular context. b, Western blot analyses of total JUN or phosphorylated JUN protein levels in MCF7P and TamR cells. Tubulin was used as a loading control. c-e, Genome browser snap images of ChIP-seq data showing the co-binding of GATA3, JUN, FOXA1 and ERα at the LOSS enhancer regions near BCL2 gene (c), the COMMON enhancer regions near TFF1 gene (d), and GAIN enhancer regions near CXCL8 gene (e) in both MCF7P and TamR cell lines. Immunoblots are representative of two independent experiments. Unprocessed immunoblots are shown in Source Data Extended Data Fig. 4.
Extended Data Fig. 5
Extended Data Fig. 5. GATA3 is required for maintenance of LOSS enhancers and expression of epithelial makers.
a, Our pyrosequencing analyses (bottom), and published DNA methylation data from three different endocrine-resistant MCF7-derived lines (TamR: tamoxifen-resistant, FASR: fulvestrant-resistant, MCF7X: estrogen deprivation-resistant) (top). DNA methylation level at GATA3 locus is significantly increased in endocrine-resistant lines. n=3 independent experiments, two-sided t-tests. b, RT-qPCR showing transcript levels of GATA3 in MCF7P and TamR with or without 5-Aza treatment for 100 hours. n=2 independent experiments. c, Heatmap generated by integrating TCGA data on GATA3 mRNA level, DNA methylation, and breast cancer subtype. High DNA methylation and low GATA3 expression are associated with invasive breast cancers (ER-/PR-/ HER2- and basal subtype). d, Aggregate plots of normalized GRO-seq tag density in MCF7P with shCtrl or shGATA3. e, Heatmap of ChIP-seq (bottom) showing that GATA3 OE in TamR can re-activate LOSS enhancers. Western blot confirms GATA3 overexpression (top). f, Heatmap depiction of the downregulation of epithelial genes after KD GATA3 in MCF7P. n=2 independent experiments. g, Western blot of the indicated epithelial markers in MCF7P cells upon GATA3 KD. h, CCK8 assays with 4-OHT treatment for 5 days. Dox-induced GATA3 overexpression in TamR re-sensitizes them to 4-OHT. n=3 independent experiments, mean ± s.d., two-sided t-tests. i, j, Tumor growth curves (i) and representative tumor images at end point (j) of orthotopic xenografts of manipulated TamR cells in nude mice (n=4/group). After tumors reached ~200mm3, tumor sizes were measured once a week upon starting doxycycline water diet and subcutaneous injections of tamoxifen (1 mg/mouse, three times/week). Mean ± s.d., two-sided t-tests. k, Relapse free survival (RFS) curves generated from kmplot website according to BCL2 levels in patients receiving endocrine therapy. P values were determined by log-rank test. Immunoblots are representative of two independent experiments. Unprocessed immunoblots are shown in Source Data Extended Data Fig. 5. Statistical source data are available in Statistical Source Data Extended Data Fig. 5.
Extended Data Fig. 6
Extended Data Fig. 6. AP1-mediated GAIN enhancer activation promotes endocrine resistance-associated gene program and phenotypes.
a, Heatmap depiction of the upregulation of indicated invasive genes after JUN overexpression in MCF7P cells. n=2 biologically independent experiments. b, Western blot images of indicated invasive markers in MCF7P cells with or without JUN overexpression, showing that JUN overexpression is sufficient to activate the expression of these invasive markers. c, Aggregate plots of the normalized GRO-seq tag density at GAIN enhancers in TamR cells transduced with shCtrl or shJUN lentiviruses showing that knockdown of JUN greatly reduces eRNA transcription due to enhancer inactivation. The dashed and solid lines represent the minus and plus strands of eRNA respectively. d, Heatmap depiction of the downregulation of indicated invasive genes after JUN knockdown in TamR cells. n=2 biologically independent experiments. e, Western blot analyses on indicated invasive markers in TamR cells transduced with a scramble control or two different lentiviral shRNAs for JUN, showing that JUN is required for the expression of these invasive markers. f, Knockdown of JUN in TamR cells re-sensitizes them to 4-OHT. TamR cells were stably knocked down with shJUN (a scramble shRNA was used as control) and CCK8 assays were used to check the relative cell viability of cells after treatment with indicated 4-OHT concentrations for 5 days. Data are presented as mean ± s.d. from n=3 independent experiments. P values were determined by two-sided t-tests. g, Relapse free survival (RFS) curves according to FN1 and S100P gene expression levels in patients receiving endocrine therapy. The curves were generated using data from kmplot website. P values were determined by log-rank test. n numbers for different groups of patients were listed in the figure. Immunoblots are representative of two independent experiments. Unprocessed immunoblots are shown in Source Data Extended Data Fig. 6. Statistical source data are available in Statistical Source Data Extended Data Fig. 6.
Extended Data Fig. 7
Extended Data Fig. 7. GATA3 and AP1 function coordinately to promote TamR-associated enhancer reprogramming and gene expression.
a, d, RT-qPCR analyses of selected epithelial markers and invasion-related genes in MCF7P (a) or T47D (d) cells with indicated manipulations, showing the coordinate gene regulation effects by GATA3 and JUN. Data are presented as mean ± s.d. P values were determined by two-sided t-tests. b, e, Western blot analyses of selected epithelial markers and invasion-related genes in MCF7P (b) and T47D (e) cells with indicated manipulations, showing the coordinate role of GATA3 and JUN in regulating gene expression. c, g, The aggregate plots of the normalized GRO-seq tag density at GAIN enhancers in MCF7P (c) and T47D (g) cells under indicated treatments. GATA3 KD and JUN OE demonstrate a synergistic effect on eRNA transcription. The dashed line represents the minus strand and solid line indicates the plus strand of eRNA. f, Box plots representation of gene expression in T47D cells. Simultaneously depleting GATA3 and overexpressing JUN (“both”) shows a more dramatic effect on the lost and gained gene expression in T47D cells compared to manipulating individual gene alone. P values were calculated by Wilcoxon signed rank test. The lower and upper hinges correspond to the first and third quartiles, and the midline represents the median. The upper and lower whiskers extend from the hinge up to 1.5 * IQR (inter-quartile range). Outlier points are indicated if they extend beyond this range. h, Heatmaps of H3K27ac ChIP-seq data at LOSS, COMMON and GAIN enhancers in ZR75–1 cells with the indicated treatments. For a and d, the data are from n=3 independent experiments. Immunoblots are representative of two independent experiments. Unprocessed immunoblots are shown in Source Data Extended Data Fig. 7. Statistical source data are available in Statistical Source Data Extended Data Fig. 7.
Extended Data Fig. 8
Extended Data Fig. 8. GATA3 and AP1 cooperate to regulate endocrine resistance and tumor growth in vitro and in vivo.
a, b, Representative brightfield pictures of MCF7P cells (a) and T47D cells (b) with indicated manipulations. The control cells display a typical epithelial cell-like morphology and grow in tightly packed clusters. Cells with both GATA3 knockdown and JUN overexpression have become more spread out (a phenotype of more invasive cancer cells) than the control and the cells with individual manipulation. Magnification, ×100. Scale bar, 100 μm. n=2 independent experiments were performed with similar results. c, d, GSEA analyses of RNA-seq data for 34 different cancer types including breast cancer (BRCA) from TCGA database showing the correlation of GATA3 (c) and JUN (d) expression levels with the enrichment of cancer hallmark gene sets from MSigDb database. We found that high expression level of JUN was positively associated with the enrichment of EMT pathway in breast cancer, however high expression level of GATA3 was negatively correlated with EMT pathway in breast cancer. The circle size indicates significance level; and the color represents the normalized enrichment score (NES). The nominal P values were determined by empirical gene-based permutation test with Benjamini-Hochberg adjustment.
Fig. 1.
Fig. 1.. Genomic analyses identify phenotypic plasticity-related transcriptional changes in breast cancer cells with endocrine resistance.
a, Volcano plots showing the genes with differential expression levels in MCF7P and TamR lines detected by RNA-seq (left panel) or GRO-seq (middle panel), and the comparison of their distributions detected by both GRO-seq and RNA-seq (right panel). Each dot represents a gene. In all panels, the green dots are genes significantly downregulated in TamR cells, and the red dots are genes significantly upregulated in TamR cells. In the right panel, the differential genes detected by GRO-seq were re-plotted based on their expressional changes measured by RNA-seq. n=2 biologically independent experiments, and P values were determined by Wald test with Benjamini-Hochberg adjustment. b, Gene Set Enrichment Analyses (GSEA) of RNA-seq data for MCF7P and TamR revealing the association of the gene program in TamR cells with the basal/mesenchymal and EMT gene signatures. The nominal P values were determined by empirical gene-based permutation test. c, RNA-seq heatmap depiction of selected epithelial marker genes and invasive mesenchymal genes that are differentially expressed in MCF7P and TamR lines. n=2 biologically independent experiments. d, Western blot detection of the protein levels of selected epithelial markers and invasive genes using total cell lysates from MCF7P and TamR lines. Tubulin was used as a loading control. e, Immunofluorescence staining for KRT18 and EGFR in MCF7P and TamR lines. Cell nuclei were stained with DAPI (blue). Scale bar, 30 μm. n= 3 wells × 2 independent experiments. f, Schematic diagram demonstrating the plasticity-elevating phenotypic transition during the development of endocrine resistance. The luminal breast cancer cells undergo transcriptome transition by reducing differentiation gene program and enhancing invasiveness gene program to achieve resistance. Immunoblots are representative of two independent experiments. Unprocessed immunoblots are shown in Source Data Fig. 1.
Fig. 2.
Fig. 2.. Analyses using patient tumor tissues and PDX samples revealed phenotypic plasticity-enhancing transcriptional changes associated with therapy resistance.
a, Heatmap of unsupervised clustering of 21 pairs of RNA-seq data (before and after receiving chemoendocrine treatment) from 21 ER+ and HER2× breast cancer patients using Gene Set Variation Analysis (GSVA) analyses for the 50 cancer hallmark gene sets from the Molecular Signature Database (MsigDB). The results demonstrate that EMT gene signature is upregulated and estrogen response early/late gene signatures are downregulated post-treatment. b-d, Line plot comparison of GSVA scores of EMT signature (b), estrogen response early/late signatures (c), and representative epithelial and invasive genes (d) for the paired RNA-seq data (pre- and post-treatment) from the 21 patients. The results show the downregulation of luminal/epithelial genes (including estrogen response early/late signatures) and the upregulation of EMT signature and representative invasive genes at post-treatment condition. n=21 biologically independent patient samples, and P values were determined by two-sided paired t-test. e, GSEA analysis of microarray data for paired parental (HBCx22) vs tamoxifen-resistant (HBCx22 TamR) PDX tumor samples showing the downregulation of luminal markers and upregulation of EMT markers in tamoxifen-resistant PDX samples. n=2 independent samples and the nominal P values were determined by empirical gene-based permutation test. f, GSEA analysis of RNA-seq data for paired parental (HBCx124) vs estrogen deprivation derived resistant (HBCx124 ED) PDX tumor samples showing that the EMT gene signatures were upregulated in hormone-independent PDX samples. n=2 independent samples and the nominal P values were determined by empirical gene-based permutation test. Statistical source data are available in Statistical Source Data Fig. 2.
Fig. 3.
Fig. 3.. Endocrine resistance accompanies global enhancer reprogramming that drives plasticity-related gene transcription.
a, Heatmaps of ERα, H3K27ac, H3K4me1, and P300 ChIP-seq data in MCF7P and TamR lines for the three groups of ERα-bound enhancers (LOSS, COMMON and GAIN). b, Heatmaps of ATAC-seq data in two paired endocrine-resistant cell models (parental vs resistant). c, Integration of RNA-seq and ChIP-seq data to correlate changes in gene expression with enhancer gain/loss. Box plots showing log2(Fold Change) of gene expression for all the genes stratified by the net enhancer change (total number of TamR-specific enhancers minus total number of MCF7P-specific enhancers) within 200 kb from the TSS site of each gene. Statistics: ANOVA analysis. d, Aggregate plots of the normalized GRO-seq tag density at LOSS, COMMON and GAIN enhancers in MCF7P and TamR showing the correlation between enhancer activation and the transcription of eRNA (dashed line: minus strand; solid line: plus strand of eRNA). e, Genome browser views of ChIP-seq and GRO-seq signals at representative ERα LOSS and GAIN enhancers and their target genes BCL2 and EGFR. f, Box plot of the fold changes in expression level of genes adjacent to LOSS, COMMON and GAIN enhancers. Statistics: two-sided Wilcoxon rank-sum test. g, GREAT analyses on the annotations of nearby genes of LOSS and GAIN enhancers. Top ten enriched annotations are shown. Statistics: one-sided binomial test. h, Downregulation of both eRNA and mRNA for EGFR or CXCL8 upon CRISPRi-mediated enhancer repression in TamR cells. The close genes SEC61G and ANKRD17 served as controls. i, Cell proliferation assays on TamR cells showing the re-sensitization of TamR cells to 4-OHT treatment after CRISPRi-mediated enhancer repression. Cell proliferation was measured by CCK8 after 6 days of treatment. Statistics for h and i: n=3 independent experiments, mean ± s.d., two-sided t-tests. For the box plots in c and f, the lower and upper hinges correspond to the first and third quartiles, and the midline represents the median. The upper and lower whiskers extend from the hinge up to 1.5 * IQR (inter-quartile range). Outlier points are indicated if they extend beyond this range. Statistical source data are available in Statistical Source Data Fig. 3.
Fig. 4.
Fig. 4.. High-order enhancer component assemblies mediated by differential TF-TF and TF-enhancer interactions correspond with endocrine resistance-associated enhancer reprogramming.
a, Enriched TF-binding motifs in different enhancer groups. P values were determined by one tailed Z-test. b, Heatmap of motif densities for the listed TFs at all LOSS, COMMON and GAIN enhancers arranged by the binding intensities of ERα measured as the ratio of normalized ERα reads in TamR to MCF7P. A motif is considered occurred in an enhancer if the P value for the region with maximum score is less than 1e-4 by FIMO scanning of this enhancer. c, Western blots confirming the inducible expression and in vivo biotinylation in the established ERα-BioID tet-on stable cell lines. The fractionation of cytoplasmic (Cy) and nuclear (N) fractions of MCF7P or TamR cells was confirmed with Western blots for GAPDH (cytoplasm-specific marker) and Histone H3 (nucleus-specific marker). The doxycycline-induced ERα-BirA*-HA fusion protein expression was detected by antibodies recognizing HA or ERα. * and # indicate endogenous and tagged exogenous ERα respectively. Proteins biotinylated by ERα-BirA* were detected using streptavidin-HRP blot. d, Volcano plot showing the log2(LFQ) value for ERα-associated proteins identified in all four BioID replicates. Several ERα-interacting TFs and cofactors are highlighted in red. n=4 biologically independent experiments, and P values were determined by two-sided t-test. e, Co-IP showing the interactions between ERα and indicated TFs in MCF7P and TamR. Endogenous ERα was immunoprecipitated using anti-ERα antibody, and IgG was used as a negative control. f, Western blot analyses of the protein levels of indicated TFs in MCF7P and TamR cells. Tubulin was used as a loading control for different samples. (Note: GATA3 is non-detectable at the presented condition, but detectable with longer exposure). g, Heatmaps of GATA3, JUN and FOXA1 ChIP-seq data in MCF7P and TamR demonstrating their differential occupancy on ERα-bound LOSS, COMMON and GAIN enhancers. Immunoblots are representative of two independent experiments. Unprocessed immunoblots are shown in Source Data Fig. 4.
Fig. 5.
Fig. 5.. GATA3 is required for maintenance of LOSS enhancers and expression of epithelial makers
a, Heatmaps of ERα and H3K27ac ChIP-seq demonstrating that knockdown of GATA3 in MCF7P cells results in enhancer inactivation for the LOSS enhancers. b, Genome browser views of GRO-seq data and ChIP-seq data at BCL2 and KCNK5 gene loci demonstrating enhancer inactivation and downregulation of gene expression upon depletion of GATA3 in MCF7P cells. c, Western blots (left) showing doxycycline-induction and in vivo biotinylation of BLRP-tagged ERα WT and pBox mutant in MCF7P cells. * and # indicate endogenous and tagged exogenous ERα respectively. ChIP-qPCR showing that ERα binding on the classical ERE-containing enhancers at TFF1 and GREB1 loci was abolished by the mutation in ERα’s pBox DNA-binding domain. However, the recruitment of ERα to LOSS enhancers (on BCL2, KCNK5 and PGR) is not affected by the mutation. Statistics: n = 3 independent experiments, mean ± s.d., two-sided t-tests. d, GSEA analyses on RNA-seq data for MCF7P cells treated with shCtrl or shGATA3. The nominal P values were determined by empirical gene-based permutation test. e, Integration of RNA-seq and ChIP-seq data to correlate gene regulation effects by GATA3 knockdown and GATA3-bound LOSS enhancers in MCF7P cells. Box plots showing GATA3 knockdown effects on these genes stratified by the numbers of nearest LOSS enhancers within 200 kb from the TSS site of each gene. P value was determined by ANOVA analysis. f, Negative correlation between the average gene expression levels of validated GATA3 direct targets and tumor grades (G1, G2 and G3). METABRIC dataset were used in the analyses. n=169, 767 and 951 for G1, G2 and G3 grade samples, respectively. P values were calculated by two-sided Wilcoxon rank-sum test. For the box plots in e and f, the lower and upper hinges correspond to the first and third quartiles, and the midline represents the median. The upper and lower whiskers extend from the hinge up to 1.5 * IQR (inter-quartile range). Outlier points are indicated if they extend beyond this range. Immunoblots are representative of two independent experiments. Unprocessed immunoblots are shown in Source Data Fig. 5. Statistical source data are available in Statistical Source Data Fig. 5.
Fig. 6.
Fig. 6.. AP1-mediated GAIN enhancer activation promotes endocrine resistance-associated gene program and phenotypes
a, Aggregate plots showing the normalized tag density of ERα and H3K27ac ChIP-seq data at GAIN enhancers in MCF7P (right). Western blot confirms the doxycycline-induced JUN expression (left). b, GSEA analyses of RNA-seq data from MCF7P with or without JUN OE. Empirical gene-based permutation test. c, Box plots representation of JUN OE effects on expression changes of genes stratified by the numbers of nearest JUN-bound GAIN enhancers within 200 kb from the TSS site of each gene. ANOVA analysis. d, Heatmaps of ChIP-seq data in TamR cells. JUN KD greatly deactivated GAIN enhancers and caused the loss of chromatin remodeling factors (BRG1 and ARID1B). e, Genome browser views of GRO-seq and ChIP-seq data. Depleting JUN in TamR cells leads to enhancer inactivation (shaded areas) and transcriptional downregulation at gene bodies. f, Western blots (left) showing that doxycycline-induction and in vivo biotinylation of BLRP-tagged ERα. *: endogenous ERα, #: tagged exogenous ERα. Biotin ChIP-qPCR (right) shows that ERα binding on GAIN enhancers (EGFR, S100P and CXCL8) was not affected by pBox mutation, unlike the binding to ERE-containing enhancers at FOXC1 and CCND1. n=3 independent experiments, mean ± s.d, two-sided t-tests. g, GSEA analyses on RNA-seq data. EMT and tamoxifen resistance-related gene signatures were downregulated upon JUN KD in TamR cells. Empirical gene-based permutation test. h, Box plots showing JUN KD effects on genes stratified by the numbers of nearest JUN-bound GAIN enhancers within 200 kb from the TSS site of each gene. ANOVA analysis. i, The average gene expression values of the indicated JUN direct targets positively correlate with tumor grades (G1=169, G2=767 and G3=951). METABRIC dataset were used. Two-sided Wilcoxon rank-sum test. For the box plots in c, h and i, the lower and upper hinges correspond to the first and third quartiles, and the midline represents the median. The upper and lower whiskers extend from the hinge up to 1.5 * IQR (inter-quartile range). Outlier points are indicated if they extend beyond this range. Immunoblots are representative of two independent experiments. Unprocessed immunoblots are shown in Source Data Fig. 6. Statistical source data are available in Statistical Source Data Fig. 6.
Fig. 7.
Fig. 7.. GATA3 and AP1 function coordinately to promote TamR-associated enhancer reprogramming and gene expression.
a, Box plots representation of gene expression in MCF7P cells. Simultaneously GATA3 KD and JUN OE (“both”) shows a more dramatic effect on the lost and gained gene expression in MCF7P cells compared to manipulating individual gene alone. P values were calculated by two-sided Wilcoxon signed-rank test. the lower and upper hinges correspond to the first and third quartiles, and the midline represents the median. The upper and lower whiskers extend from the hinge up to 1.5 * IQR (inter-quartile range). Outlier points are indicated if they extend beyond this range. b, Heatmaps of H3K27ac ChIP-seq data at LOSS, COMMON and GAIN enhancers in MCF7P cells with the indicated treatments. c, The aggregate plots of the normalized tag densities of H3K27ac ChIP-seq data at GAIN enhancers in MCF7P cells with indicated treatments. d, Genome browser snapshots of H3K27ac ChIP-seq signals at the EGFR gene locus in MCF7P cells. GATA3 KD and JUN OE show a synergistic effect. The combined treatment in MCF7P cells creates an enhancer landscape similar to that in TamR cells. e, Genome browser snapshots of GRO-seq signals at the EGFR gene locus in MCF7P cells. GATA3 KD and JUN OE (“both”) render MCF7P cells a TamR-like profile in enhancer landscape and gene expression. f, Heatmaps of H3K27ac ChIP-seq and ATAC-seq at LOSS, COMMON and GAIN enhancers in T47D cells with the indicated treatments. g, Genome browser snapshots of H3K27ac ChIP-seq signals at the EGFR gene locus in T47D cells. GATA3 KD and JUN OE show a synergistic effect. h, Aggregate plots of the normalized tag densities of H3K27ac ChIP-seq data at GAIN enhancers in T47D cells with indicated treatments. i, Western blots showing that doxycycline-induced GATA3 overexpression in TamR caused a significant decrease of interactions between endogenous ERα and JUN/RUNX2. Endogenous ERα was immunoprecipitated using anti-ERα antibody. IgG was used as a negative control. Immunoblots are representative of two independent experiments. Unprocessed immunoblots are shown in Source Data Fig. 7.
Fig. 8.
Fig. 8.. GATA3 and AP1 cooperate to regulate endocrine resistance and tumor growth in vitro and in vivo.
a, b, CCK8 assays using MCF7P (a) or T47D (b) stable cell lines expressing shGATA3 and/or JUN OE construct to measure relative cell viability with indicated treatments for 5 days to show the combined effect of GATA3 KD and JUN OE on the resistance to 4-OHT. n=3 independent experiments, mean ± s.d., two-sided t-tests. c, e, Tumor growth curves of orthotopic xenografts of manipulated MCF7P (c, n=5 per group) and T47D (e, n=4 per group) cells in nude mice. Cells with JUN OE showed enhanced tumor growth, which was further enhanced by GATA3 KD. Tamoxifen subcutaneously injections were performed right after the graft (1 mg/mouse, three times/week). Tumor sizes were measured once a week upon starting doxycycline (administrated in water). Statistics: mean ± s.d., two-sided t-tests. Based on the statistical analyses, GATA3 KD alone was not able to significantly promote or inhibit tumor growth in vitro or in vivo. P values from one-way ANOVA were calculated for GATA3 KD alone vs control: p=0.0604 for a, p=0.2007 for b, p=0.0987 for c, and p=0.0831 for e. d, f, Images of representative MCF7P (d) and T47D (f) xenograft tumors collected at the end points of the experiments in panel c and e. g, RT-qPCR analyses of selected epithelial markers and invasion-related genes in MCF7P xenograft tumors with indicated treatments, showing the coordinate role of GATA3 and JUN in regulating gene expression in vivo in the xenograft tumors. Data are presented as mean ± s.d. from n=6 independent samples. P values were determined by two-sided t-tests. The box plot elements represent the minimum, 25th percentile, median, 75th percentile, and maximum values. h, A proposed model of high-order assemblies of TFs in regulating enhancer reprogramming. Enhancer reprogramming mediated by the altered interactions between ERα and other TFs (exemplified by FOXA1, GATA3 and AP1) promote phenotypic plasticity during the acquisition of therapy resistance and invasive progression. Statistical source data are available in Statistical Source Data Fig. 8.

Comment in

References

    1. Dai X et al. Breast cancer intrinsic subtype classification, clinical use and future trends. Am J Cancer Res 5, 2929–2943 (2015). - PMC - PubMed
    1. Fu J & Jeffrey SS Transcriptomic signatures in breast cancer. Mol Biosyst 3, 466–472 (2007). - PubMed
    1. Murphy CG & Dickler MN Endocrine resistance in hormone-responsive breast cancer: mechanisms and therapeutic strategies. Endocr Relat Cancer 23, R337–352 (2016). - PubMed
    1. Musgrove EA & Sutherland RL Biological determinants of endocrine resistance in breast cancer. Nat Rev Cancer 9, 631–643 (2009). - PubMed
    1. Hnisz D et al. Super-enhancers in the control of cell identity and disease. Cell 155, 934–947 (2013). - PMC - PubMed

Publication types

MeSH terms