

doi: 10.1038/s41593-020-0635-5.
Epub 2020 May 18.
Shared proteomic effects of cerebral atherosclerosis and Alzheimer's disease on the human brain
Affiliations
- PMID: 32424284
- PMCID: PMC7269838
- DOI: 10.1038/s41593-020-0635-5
Item in Clipboard
Shared proteomic effects of cerebral atherosclerosis and Alzheimer's disease on the human brain
Nat Neurosci.
2020 Jun.
Erratum in
-
Publisher Correction: Shared proteomic effects of cerebral atherosclerosis and Alzheimer's disease on the human brain.Nat Neurosci. 2020 Aug;23(8):1034. doi: 10.1038/s41593-020-0662-2. Nat Neurosci. 2020. PMID: 32576978
Abstract
Cerebral atherosclerosis contributes to dementia via unclear processes. We performed proteomic sequencing of dorsolateral prefrontal cortex in 438 older individuals and found associations between cerebral atherosclerosis and reduced synaptic signaling and between RNA splicing and increased oligodendrocyte development and myelination. Consistently, single-cell RNA sequencing showed cerebral atherosclerosis associated with higher oligodendrocyte abundance. A subset of proteins and modules associated with cerebral atherosclerosis was also associated with Alzheimer's disease, suggesting shared mechanisms.
Conflict of interest statement
Competing interests
The authors declare no competing interests.
Figures

This figure summarizes the association between CA and oligodendrocyte abundance estimated from single-cell nuclear RNA sequencing of human dorsolateral prefrontal cortex in an independent dataset. Higher cerebral atherosclerosis was associated with higher oligodendrocyte abundance in the dorsolateral prefrontal cortex after adjusting for sex, age, and 8 other measured pathologies using linear regression (p=0.003, β=0.077, N=48). For each box plot, the box reflects the first and third quartile, the dark horizontal line reflects the median, the vertical lines extending from the boxes show the 1.5x the interquartile range, and points beyond the lines are outliers.
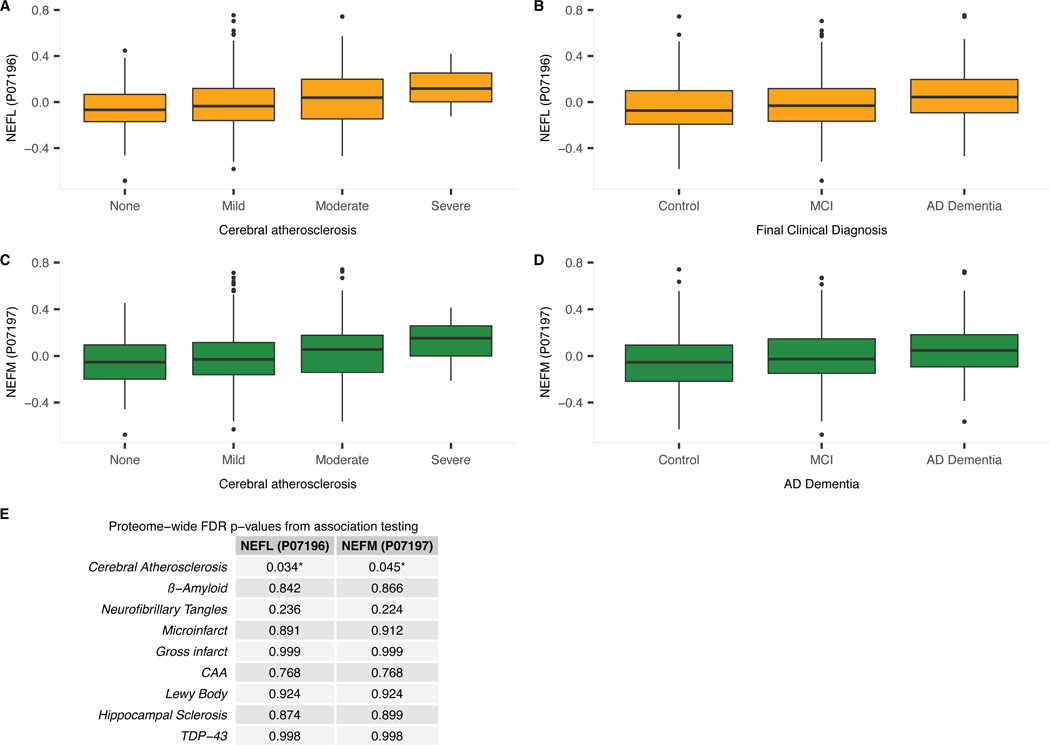
a) Boxplot of dorsolateral prefrontal cortex NEFL protein level for each level of CA (i.e., none to severe). NEFL protein levels were identified as associated with CA using linear regression adjusted for relevant covariates and 8 other pathologies (N=375; p=0.0002; adjusted p=0.034; Figure 1). b) Boxplot of dorsolateral prefrontal cortex NEFL protein level by clinical diagnosis (i.e., cognitive normal control [control], mild cognitive impairment [MCI], and AD dementia). MCI is generally regarded as an intermediate stage between cognitively normal and AD. NEFL protein levels were identified as associated with AD dementia by logistic regression adjusted for relevant covariates (N=383; p=0.0025; adjusted p=0.0322; Figure 1). c) Boxplot of dorsolateral prefrontal cortex NEFM protein level for each level of CA (i.e., none to severe). NEFM protein levels were identified as associated with CA using linear regression adjusted for relevant covariates and 8 other pathologies (N=375; p=0.0006; adjusted p=0.045). d) Boxplot of dorsolateral prefrontal cortex NEFM protein level by clinical diagnosis (i.e., cognitive normal control [control], mild cognitive impairment [MCI], and AD dementia). NEFM protein levels were identified as associated with AD dementia by logistic regression adjusted for relevant covariates (N=383; p=0.0019; adjusted p=0.028). For each boxplot, the box reflects the first and third quartile, the dark horizontal line reflects the median, the vertical lines extending from the boxes show the 1.5x the interquartile range, and points beyond the lines are outliers. e) Proteome-wide adjusted p-values for associations between NEFL and NEFM brain protein levels and each of the 9 measured pathologies adjusting for the remaining 8 measured pathologies. Associations were tested with regression and the provided p-values were adjusted for multiple testing using Benjamin-Hochberg false discovery rate.
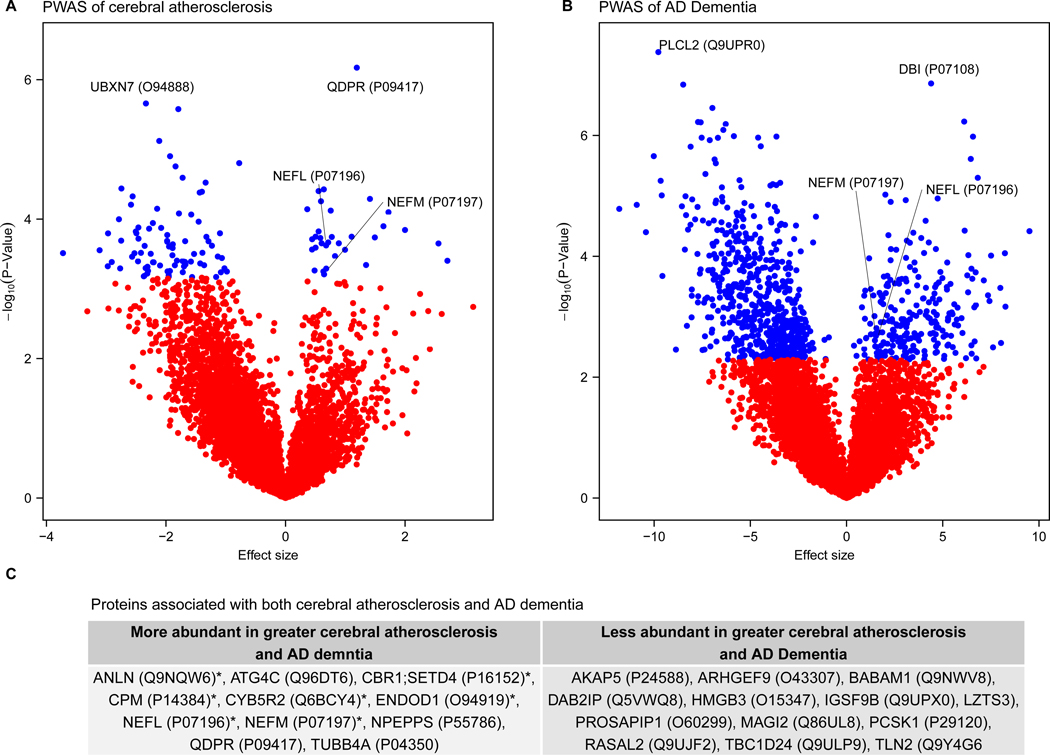
Differential protein expression in cerebral atherosclerosis (CA) and Alzheimer’s Disease (AD). This figure summarizes the proteome-wide association study (PWAS) of CA and AD in the discovery dataset (N=375) and gives the genes associated with both CA and AD. a) Volcano plot of the PWAS of CA plotting the effect sizes and p-values estimated from linear regression of each protein and CA adjusted for clinical covariates and 8 other measured pathologies. For each protein, points are either blue or red to reflect whether the protein was or was not significantly associated with CA at proteome-wide significant level, respectively. Labels are given as gene symbols and Uniprot IDs in parentheses for the top two associated proteins and for NEFL and NEFM. b) Volcano plot of the PWAS of AD plotting the effect sizes and p-values estimated from logistic regression of each protein and AD adjusted for clinical covariates. For each protein, points are either blue or red to reflect whether the protein was or was not significantly associated with AD at proteome-wide significant level, respectively. Labels are given as gene symbols and Uniprot IDs tested, in parentheses, for the top two associated proteins and for NEFL and NEFM. c) Gene symbols and the Uniprot ID of the proteins associated with both AD and CA at proteome-wide adjusted p <0.05.
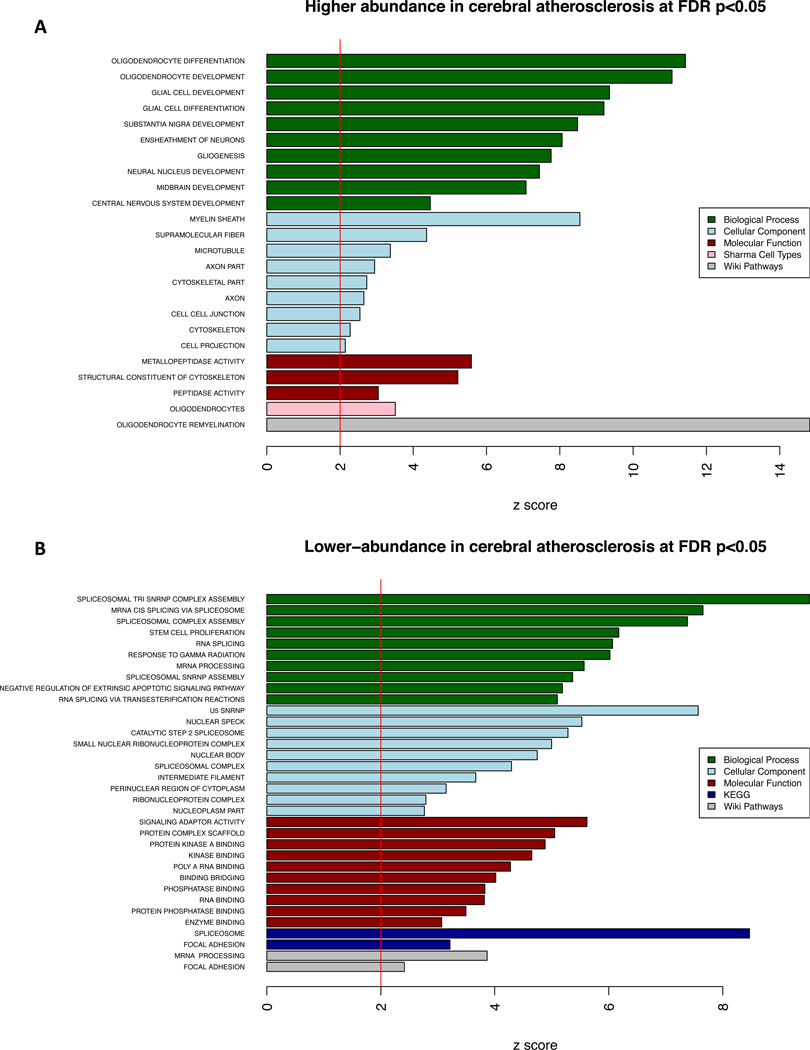
Enrichment analysis of proteins associated with cerebral atherosclerosis (CA). This figure shows the results of the gene set enrichment analysis (GSEA) for the 114 proteins associated with CA independently of the 8 other measured pathologies at proteome-wide adjusted p <0.05 in the discovery dataset (N=375). a) Proteins with significantly higher-abundance in cerebral atherosclerosis (n=32) were used for GSEA, and one-sided Z-scores above 2 were plotted for results of each of the five annotation databases used. b) Proteins with significantly lower-abundance in cerebral atherosclerosis (n=82) were used for GSEA and a one-sided Z-scores above 2 were plotted for results of each of the five annotation databases used.
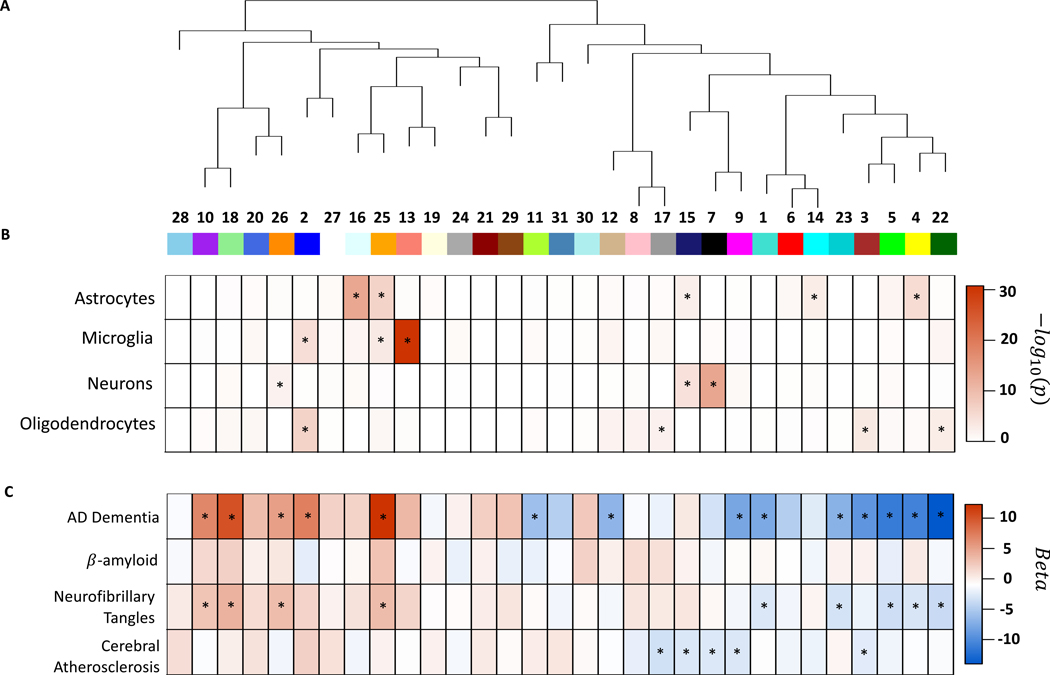
Protein co-expression network analysis for brain cell types and clinical and neuropathologic outcomes. This figure summarizes the protein co-expression modules and their associations with AD, β-amyloid, neurofibrillary tangles, and cerebral atherosclerosis in the discovery dataset (N=375). a) Dendrogram for 31 protein co-expression modules derived using WGCNA. b) Brain cell-type enrichment for each module. The heatmap shows the one-sided Z-test for each brain cell-type and module and significant enrichment is indicated by an asterisk. c) Results of association testing between modules and AD dementia, β-amyloid, neurofibrillary tangles, and cerebral atherosclerosis, respectively. The heatmap gives the beta values of the regression models for each outcome using the module as the predictor adjusted for relevant covariates as described in the text. For the three neuropathologic outcomes (i.e., β-amyloid, neurofibrillary tangles, and cerebral atherosclerosis), linear regression adjusted for 8 other neuropathologies and relevant covariates was used. Benjamin-Hochberg false discovery rate were used to adjust p-values and associations with adjusted p<0.05 are indicated with asterisk. No module was associated with β-amyloid after adjusting for all the other 8 measured pathologies. Nine modules were associated with tangles after adjusting for the 8 other measured pathologies at adjusted p<0.05. Five modules were associated with cerebral atherosclerosis after adjusting for the 8 other measured pathologies.
Comment in
-
Revisiting atherosclerosis and dementia.Nat Neurosci. 2020 Jun;23(6):691-692. doi: 10.1038/s41593-020-0626-6. Nat Neurosci. 2020. PMID: 32424283 Free PMC article.
References
-
- Qureshi AI & Caplan LR Intracranial atherosclerosis. Lancet (London, England) 383, 984–998 (2014). - PubMed
REFERENCES (for Methods)
-
- McKhann G, et al. Clinical diagnosis of Alzheimer’s disease: report of the NINCDS-ADRDA Work Group under the auspices of Department of Health and Human Services Task Force on Alzheimer’s Disease. Neurology 34, 939–944 (1984). - PubMed
-
- Schneider JA, et al. Relation of cerebral infarctions to dementia and cognitive function in older persons. Neurology 60, 1082–1088 (2003). - PubMed
Publication types
MeSH terms
Substances
Grants and funding
- U01 AG046152/AG/NIA NIH HHS/United States
- P30 AG066507/AG/NIA NIH HHS/United States
- R01 AG061800/AG/NIA NIH HHS/United States
- R01 MH117292/MH/NIMH NIH HHS/United States
- P30 AG066511/AG/NIA NIH HHS/United States
- U01 AG061356/AG/NIA NIH HHS/United States
- R01 AG053960/AG/NIA NIH HHS/United States
- R01 AG017917/AG/NIA NIH HHS/United States
- P30 AG010161/AG/NIA NIH HHS/United States
- R01 AG064233/AG/NIA NIH HHS/United States
- RC2 AG036547/AG/NIA NIH HHS/United States
- P50 AG005146/AG/NIA NIH HHS/United States
- RF1 AG057470/AG/NIA NIH HHS/United States
- U01 MH115484/MH/NIMH NIH HHS/United States
- R01 AG042210/AG/NIA NIH HHS/United States
- R01 AG056533/AG/NIA NIH HHS/United States
- I01 BX003853/BX/BLRD VA/United States
- R56 AG062256/AG/NIA NIH HHS/United States
- R56 AG062633/AG/NIA NIH HHS/United States
- R01 AG057911/AG/NIA NIH HHS/United States
- R21 AG055844/AG/NIA NIH HHS/United States
- U01 AG061357/AG/NIA NIH HHS/United States
- R56 AG060757/AG/NIA NIH HHS/United States
- P50 AG025688/AG/NIA NIH HHS/United States
- U01 AG046161/AG/NIA NIH HHS/United States
- U19 AG033655/AG/NIA NIH HHS/United States
- P30 NS055077/NS/NINDS NIH HHS/United States
- R01 AG015819/AG/NIA NIH HHS/United States
