. 2020 Jul;23(7):819-831.
doi: 10.1038/s41593-020-0637-3. Epub 2020 May 18.

Motor learning promotes remyelination via new and surviving oligodendrocytes

Affiliations

Motor learning promotes remyelination via new and surviving oligodendrocytes

Clara M Bacmeister et al. Nat Neurosci. 2020 Jul.

Abstract

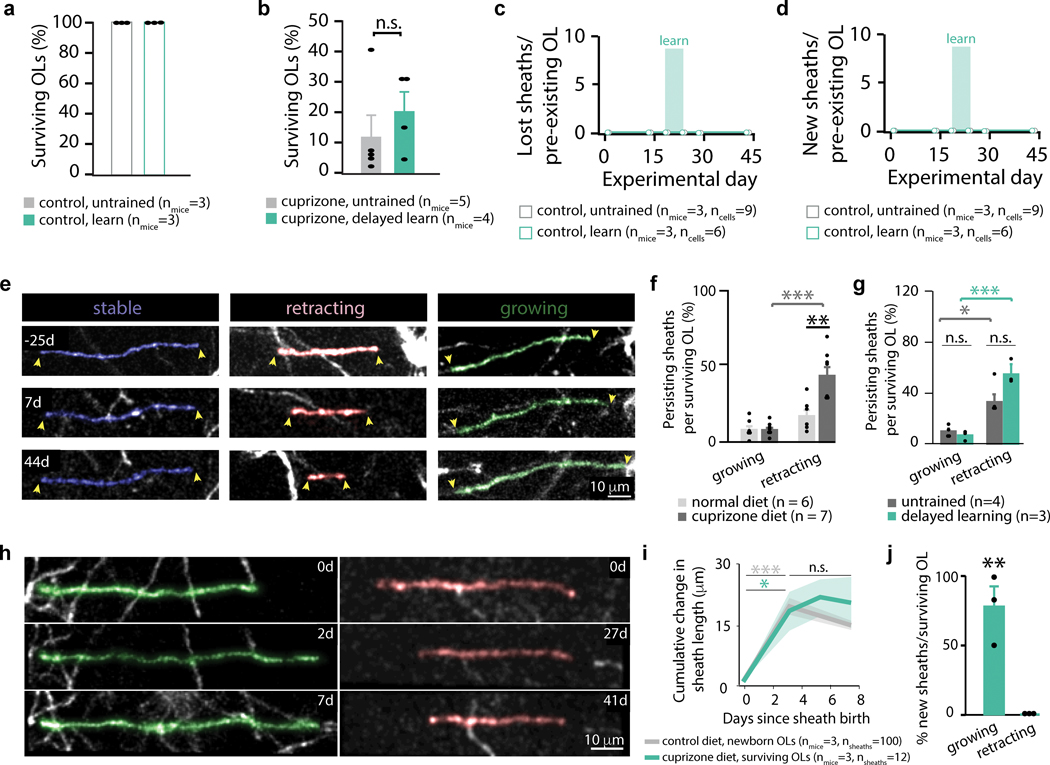
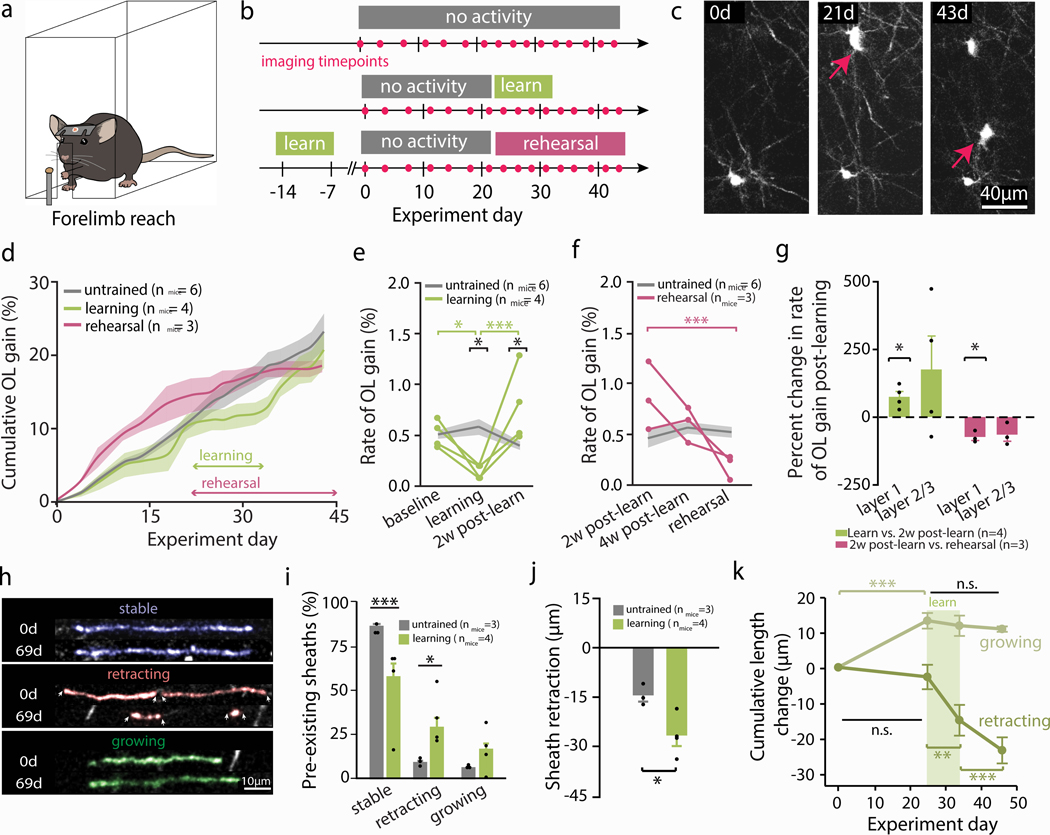
Oligodendrocyte loss in neurological disease leaves axons vulnerable to damage and degeneration, and activity-dependent myelination may represent an endogenous mechanism to improve remyelination following injury. Here we report that, while learning a forelimb reach task transiently suppresses oligodendrogenesis, it subsequently increases oligodendrocyte precursor cell differentiation, oligodendrocyte generation and myelin sheath remodeling in the forelimb motor cortex. Immediately following demyelination, neurons exhibit hyperexcitability, learning is impaired and behavioral intervention provides no benefit to remyelination. However, partial remyelination restores neuronal and behavioral function, allowing learning to enhance oligodendrogenesis, remyelination of denuded axons and the ability of surviving oligodendrocytes to generate new myelin sheaths. Previously considered controversial, we show that sheath generation by mature oligodendrocytes is not only possible but also increases myelin pattern preservation following demyelination, thus presenting a new target for therapeutic interventions. Together, our findings demonstrate that precisely timed motor learning improves recovery from demyelinating injury via enhanced remyelination from new and surviving oligodendrocytes.


Figures

Extended Data Fig. 1:
Extended Data Fig. 1:. Learning and rehearsal of a forelimb reach task induce skill refinement.
a, A large majority (93%) of mice successfully learn to perform the forelimb reach task. “Learners” (black) gradually improve their reaching performance over the seven days of training, whereas “non-learners” (grey) show a progressive decrease in success rate and eventually stop making reach attempts around day 4. Note, the lone point in the “non-learner” group at day 7 is due to only one mouse making attempts on the last day of training. The other two mice had stopped trying. b, Successful reaches (%) significantly increase between learning days 1 and 7 (paired samples t-test; t(6) = 4.80, p = 0.003) for mice placed in “learning” group. c, Peak performance during rehearsal (successful reaches; %) is significantly higher than peak performance during learning (paired samples t-test; t(6) = 5.47, p = 0.0016) for mice placed in “rehearsal” group. Individual colors and traces reflect performance by individual mice. *p < 0.05, **p < 0.01, ***p < 0.001. Bars and errors represent Mean±SEM, for statistics see Supplementary Table 2.1.
Extended Data Fig. 2:
Extended Data Fig. 2:. In vivo imaging of MOBP-EGFP faithfully reflects myelin sheath presence, length, and connection to oligodendrocyte cell body.
a, b, Maximum projections of cortical oligodendrocytes showing 98.24±0.92% colocalization of in vivo MOBP-EGFP and SCoRe signal in myelin sheaths, confirming MOBP-EGFP faithfully reflects presence of myelin (ANOVA, nmice = 3, F2,6 = 5596.220, p < 0.0001). c, Maximum projection of 4% paraformaldehyde fixed tissue, stained for myelin (blue, MBP), paranodes (Caspr, red), and sodium channels (NavPan, green). d, No significant difference between sheath lengths measured using Simple Neurite Tracer in in vivo two-photon images of control and cuprizone-treated MOBP-EGFP mice, and in confocal images of sheaths immunostained for MBP in fixed tissue (nsheaths = 306, 297 and 233, respectively; points represent individual sheaths; ANOVA; F2,833 = 2.53, p > 0.08; red points and error bars represent group means±SEM). e,f Semi-automated tracing with Simple Neurite Tracer faithfully reconstructs oligodendrocyte myelin sheaths and their connecting processes to the cell soma in layer I (e) and layer II/II (f). Top left: Maximum projection of an oligodendrocyte (OL) imaged using in vivo two-photon microscopy, spanning a depth of 3–33 μm (e) and 138–186 μm (f) in motor cortex. Bottom left: maximum projection of an isolated single sheath and process attached to the oligodendrocyte cell body. Center: maximum projection and pseudo-colored sheath and process (sheath and process pseudo-colored). Right: Three-dimensional (3D) reconstruction of the same oligodendrocyte generated from the raw in vivo imaging data using the Simple Neurite Tracer plugin in FIJI. View of 3D volume in xy plane from below (top) and view of 3D volume through z (bottom). *p < 0.05, **p < 0.01, ***p < 0.001. Bars and errors represent Mean±SEM, for statistics see Supplementary Table 2.1.
Extended Data Fig. 3:
Extended Data Fig. 3:. Oligodendrocyte lineage cell dynamics throughout motor learning.
a, Genetic lines for in vivo imaging of oligodendrocyte precursor cells (OPCs; NG2-mEGFP) and oligodendrocytes (OLs; MOBP-EGFP). b, Motor cortex oligodendrogenesis from age 10–20 weeks across six mice, showing a plateau ~17 weeks. Dashed box represents age during standard experimental timeline. c, Rate of oligodendrogenesis is altered in learning vs. untrained mice during learning (Wilcoxon Rank-Sum, p = 0.014), days 8–18 post-learning (p = 0.038), and days 14–24 post-learning (p = 0.024). No differences are observed by days 25–35 post-learning (p > 0.9). Points represent mice. d, Main effect of diet restriction on oligodendrogenesis rate (%; ANOVA; F2,8 = 18.13, p = 0.001). Diet-restricted and non-diet-restricted controls have higher rates of oligodendrogenesis than diet-restricted learning mice (Tukey’s HSD, p = 0.001 and p = 0.005, respectively). e, Mean success rate is related to fold change in oligodendrogenesis rate post-learning (R-square = 0.98, p = 0.01). Line and shaded area represent fit and 95% confidence of fit. f, Trained mice (learning and rehearsal) have increased maximum rates of oligodendrogenesis relative to controls (t(10.61) = −2.49, p = 0.03). g, h, Proliferation rates from Fig. 2d; colors represent individual mice. All mice show reduced proliferation rate during learning relative to baseline (t(4) = −3.89, p = 0.018; paired student’s t-test), but no main effect of time on proliferation rate across the five weeks of experiment - possibly due to high variability post-learning (F4,15 = 2.341). i, Only a minority of proliferation and differentiation events occurred in OPCs that had migrated into the field of view throughout the course of the experiment. j, No effect of learning on rate of migration into or out of the field of view. *p < 0.05, **p < 0.01, ***p < 0.001. Bars and errors represent Mean±SEM, for statistics see Supplementary Table 2.1.
Extended Data Fig. 4:
Extended Data Fig. 4:. Cuprizone treatment results in loss of myelin and oligodendrocytes.
a, b, Mean density of EGFP+ and PDGFRα+ cells in control and cuprizone-treated MOBP-EGFP mice; individual points represent individual mice. Interaction effect between drug (control vs. cuprizone) and cell type (EGFP+ vs PDGFRα+; (F1,5=22.39, p=0.0052) to predict cell density. While EGFP+ cell density is decreased in cuprizone-treated mice relative to controls (Tukey’s HSD; p=0.0086), there is no difference in PDGFRα+ cells between groups (p>0.5). c, Maximum projection of a EGFP+/ASPA+ oligodendrocyte (top) and a EGFP+/ASPA- oligodendrocyte (bottom). Note the large size of the ASPA-/EGFP+ cell soma suggesting it is a recently born oligodendrocyte in the early stages of the maturation process. d, After three weeks of cuprizone treatment, 70.73±12.78% of oligodendrocytes are EGFP+/ASPA+, 0.97±0.84% of cells are ASPA+/EGFP-, while the remainder are EGFP+-only (nmice=3, ncells=185). e, Maximum projection of an MBP+ myelin sheath with (top) and without EGFP (bottom) after three weeks of cuprizone. f, After three weeks of cuprizone, 76.21±7.11% of sheaths are MBP+/EGFP+, and 20.6±5.79% of sheaths are MBP+/EGFP- (nmice=3, nsheaths=351). g,h Maximum projections of oligodendrocytes showing colocalization of in vivo MOBP-EGFP and SCoRe imaging for myelin both before cuprizone administration (−21 days) and immediately following its removal (0 days). Note the surviving sheath (white arrow). i, Following 3 weeks of cuprizone diet, most myelin sheaths are MOBP-EGFP+/SCoRe+ (95.71±1.16; ANOVA, F2,6=2012.94, p<0.0001). j, Cuprizone administration modulates sheath density (F2,10=14.43, p=0.001). Cuprizone-fed mice have a reduced density of MOBP-EGFP+/SCoRe+ positive sheaths relative to controls (p=0.0001), but no difference in GFP-only or SCoRe-only sheaths. *p<0.05, **p<0.01, ***p<0.001. Bars and errors represent Mean±SEM, for statistics see Supplementary Table 2.3.
Extended Data Fig. 5:
Extended Data Fig. 5:. Dynamics of oligodendrocyte generation and loss during cuprizone treatment.
a, Oligodendrocyte loss occurred evenly across cortical depths. Shaded area represents cuprizone diet. b, Oligodendrogenesis is suppressed during cuprizone diet (n = 5 mice per group; t(6.54) = 4.10, p = 0.005; Student’s t-test). c, 85% of oligodendrocytes generated during cuprizone diet die within three weeks. d, Oligodendrocyte loss predicts gain (Spearman’s ρ = 0.89). e, Oligodendrocytes generated during remyelination are distributed across cortex similarly to developmental oligodendrogenesis (Wilcoxon Rank-sum, p > 0.1). f, Remyelination alters oligodendrogenesis rates (F29,2 = 27.67, p < 0.0001; ANOVA). Rates are higher during remyelination than in healthy trained and untrained mice (p < 0.0001 and p < 0.0001, respectively; Tukey’s HSD). g, h, i, Inter-individual variation in oligodendrocyte gain and loss is controlled for by normalizing gain to loss (“oligodendrocyte replacement”). j,k, Representative diagram and images of peri-electrode immunohistochemistry. Myelinated neurons within 150 microns of the electrode (indicated with white arrowhead; layer II/III XZ maximum projection) were co-labelled with MBP (myelin; cyan), beta-IV spectrin (axon initial segment; purple) and NeuN/NFH (neuron cell soma / distal axon; green; top), whereas unmyelinated axons did not co-localize with MBP (bottom). l, Cuprizone administration alters peri-probe axonal myelination (Two-way ANOVA; F3,8 = 110.51, p < 0.0001). Control mice have more myelinated versus unmyelinated axons (Tukey’s HSD, p < 0.0001). At the cessation of cuprizone, cuprizone-fed mice have fewer myelinated (p < 0.0001) and more unmyelinated axons than healthy controls (p < 0.0001), and more unmyelinated than myelinated axons (p = 0.004). Note: myelin may be present elsewhere on the axon. m, The proportion of unmyelinated neurons observed via IHC does not differ from the proportion of myelin loss predicted by sigmoidal demyelination characterized in Fig. 3e-h (one-sample t-test, t(2) = 1.10, p > 0.3). *p < 0.05, **p < 0.01, ***p < 0.001. Bars and errors represent Mean±SEM, points represent individual mice, for statistics see Supplementary Table 2.3.
Extended Data Fig. 6:
Extended Data Fig. 6:. Demyelination induces deficits in early, but not delayed, motor learning.
a, Timeline for “early-learning” intervention (3 days post-cuprizone). b, No difference in mean reach attempts per session during early-learning between control and cuprizone-treated mice (Student’s t-test, t(12.95) = 0.05, p > 0.9; coloured lines represent group means). c, Area plot of reach attempt outcome (success vs. failure) across forelimb reach learning days in both control and cuprizone-treated mice. d, Control mice have improved success rates day 7 of training relative to day 1 (Paired Student’s T-test; t(6) = 4.7, p = 0.003), but cuprizone-treated mice do not (t(7) = 1.96, p=0.09). e, Maximum oligodendrocyte loss is related to peak performance during training (R = 0.95, p = 0.02; line and shaded area represent line of fit and 95% confidence). f, No relationship between mean learning success rate (%) and asymptote of oligodendrocyte replacement in early learners. g, Timeline for “delayed-learning” intervention (10 days post-cuprizone) h, No difference in mean reach attempts per session during delayed-learning between control and cuprizone-treated mice (Student’s t-test, t(12.95) = 1.54, p > 0.1; coloured lines represent group means). i, Area plot of reach attempt outcome (success, rudimentary error, intermediate error, advanced error; see Supplementary Video 1) across delayed-learning days in both control and cuprizone-treated mice. j, Both control and cuprizone-treated mice improve their reaching success between days 1 and 7 of delayed-learning (Paired student’s t-test, p = 0.0005 and p = 0.004, respectively). k, No relationship between maximum oligodendrocyte loss and reaching performance during delayed learning. l, No relationship between delayed learning success rate and asymptote of oligodendrocyte replacement post-cuprizone. *p < 0.05, **p < 0.01, ***p < 0.001. Points represent individual mice, for statistics see Supplementary Table 2.5.
Extended Data Fig. 7:
Extended Data Fig. 7:. Motor skill rehearsal does not modulate remyelination.
a, Timeline of reach task rehearsal post cuprizone diet. b, Main effect of drug on reaching success during rehearsal (F(1,14) = 27.73, p < 0.0001). c,d, No effect of rehearsal on rate, inflection point, or asymptote of oligodendrocyte replacement. e, No effect of cuprizone on change in reaching behavior between learning and rehearsal. f, Area plot of reach attempt outcomes in control and cuprizone-demyelinated mice. g, Interaction effect between performance phase (learning vs. rehearsal) and drug (control vs. cuprizone) to predict success rate (F(1) = 4.62, p = 0.04). While control and cuprizone mice do not differ in success rate during pre-cuprizone learning, control mice perform significantly better during rehearsal relative to cuprizone-treated mice (Tukey’s HSD, p = 0.0004). Both cuprizone and cuprizone-treated mice have improved performance during rehearsal relative to learning (p = 0.0001 and p < 0.0001, respectively). h, No relationship between peak oligodendrocyte loss post-cuprizone and peak reaching success rate during rehearsal. i, No relationship between rehearsal success rate and asymptote of oligodendrocyte replacement. *p < 0.05, **p < 0.01, ***p < 0.001. Bars and errors represent Mean±SEM, points represent individual mice, for statistics see Supplementary Table 2.5.
Extended Data Fig. 8:
Extended Data Fig. 8:. Identification of oligodendrocytes that survive demyelination.
a, Representative image outlining the methodology for following surviving oligodendrocytes over time. Single plane image of the same oligodendrocyte at baseline (−25d), one week after demyelination (7d), and six weeks after demyelination (44d). Red boxes highlight one example of the same oligodendrocyte processes lasting for the duration of the study. The maintenance of the spatial relationship between the oligodendrocyte of interest and other oligodendrocytes in the field of view (yellow arrowheads) provide further confirmation of oligodendrocyte identity. Note the new cell that appears at 7d. b, Change in centroid position of reference oligodendrocytes within the z-stack and surviving cell bodies from baseline to day of peak remodeling—i.e. the day where the largest number of sheaths were added by a given oligodendrocyte. c, Surviving oligodendrocytes at baseline are significantly smaller than new oligodendrocytes (t(21.91) = −5.81, p < 0.0001, Student’s t-test). d, Change in volume of surviving oligodendrocytes from baseline to peak remodeling is significantly smaller than the volume of new oligodendrocytes (t(23.88 = −7.59, p < 0.0001). e, Dynamics of sheath addition over time. Each line represents an individual oligodendrocyte.*p < 0.05, **p < 0.01, ***p < 0.001. Bars and errors represent Mean±SEM, box plots represent Median and IQR, for statistics see Supplementary Table 2.7.
Extended Data Fig. 9:
Extended Data Fig. 9:. Dynamics of pre-existing and newly-generated myelin sheaths from surviving oligodendrocytes.
a, No oligodendrocytes are lost in healthy mice. b, No difference in percent of oligodendrocytes (OLs) surviving demyelination in untrained and delayed learning groups (Wilcoxon Rank-Sum, p > 0.5). c, d, No sheaths are lost (c) nor generated (d) on mature oligodendrocytes in healthy trained or untrained conditions. e, Behavior of pre-existing myelin sheaths that persist throughout study. Relevant sheaths are pseudo colored. f, Three weeks into remyelination, sheath retraction is significantly increased (F(3,22) = 18.65, p < 0.0001) when compared to age-matched controls (Tukey’s HSD, p = 0.0006) and when compared to the percent of sheaths growing in cuprizone-treated mice (p < 0.0001). g, No effect of delayed learning on sheath dynamics during remyelination. Sheaths retract more than they grow in both untrained (p = 0.016) and delayed learning mice (p = 0.0003). h, Maximum projection of new sheaths generated after cuprizone exhibiting growth (pseudo colored green, left) and retraction (pseudo colored red, right). i, New myelin sheaths change in length in the week following their generation, whether they are from new oligodendrocytes (control: F(3,302) = 47.94, p < 0.0001) or from surviving oligodendrocytes after cuprizone-demyelination (cuprizone diet: F(3,29) = 5.31, p = 0.0049). Sheaths in both control and cuprizone treatment stabilize their length within 3 days of sheath birth (d0 vs. d3, p < 0.0001 in control and p = 0.028 in cuprizone; Tukey’s HSD). Line and shading represent mean and SEM. j, Sheaths from pre-existing oligodendrocytes grow more often than they retract the first three days post-generation (Wilcoxon Rank-Sum, p = 0.0029). *p < 0.05, **p < 0.01, ***p < 0.001. Bars and errors represent Mean±SEM, for statistics see Supplementary Table 2.7.
Extended Data Fig. 10:
Extended Data Fig. 10:. Surviving oligodendrocyte cell soma volume changes during remyelination.
a, Maximum projection of surviving oligodendrocyte cell bodies at baseline (left, magenta), peak remodeling (middle, cyan), and overlaid (right). Scale bar is 10 μm. b, Oligodendrocytes in normal untrained mice display little change in cell body volume throughout the study, from baseline (0d) to 43d. Surviving cells in delayed learning mice show dramatic increase in cell soma volume from baseline to day of peak remodeling when compared to oligodendrocytes in normal untrained mice (t(12.24) = 2.56, p = 0.025, Student’s t-test). c, Percent change in volume between baseline and day of sheath addition for surviving cells engaging in remodeling.*p < 0.05, **p < 0.01, ***p < 0.001. Bars and errors represent Mean±SEM, for statistics see Supplementary Table 2.7.
Fig. 1 |
Fig. 1 |. Forelimb reach training modulates oligodendrogenesis and remodeling of pre-existing myelin sheaths.
a, b, Illustration and imaging timeline of behavioral interventions. c, Example of motor cortex oligodendrogenesis; red arrows indicate new cells. d, Cumulative oligodendrogenesis (% increase from baseline; Mean±SEM) by group. e, Learning modulates oligodendrogenesis rate (F2,16=15.61, p=0.0002; grey line±shaded area represents control Mean±SEM; green traces represent individual learning mice). Rate is suppressed during learning relative to baseline (p=0.046; Tukey’s HSD), resulting in a decreased rate relative to controls (p=0.016). Rate increases in the two weeks post-learning (p=0.0005; Tukey’s HSD), resulting in a higher rate than controls (p=0.05). f, Rehearsal modulates oligodendrogenesis rate (F2,14=10.33, p=0.002; grey line±shaded area represents control Mean±SEM; pink traces represent individual rehearsal mice). Rate decreases between two weeks post-learning and rehearsal (p=0.0009; Tukey’s HSD), but does not differ between untrained and rehearsal mice. g, Non-zero changes in oligodendrogenesis rate (both the increase two weeks post-learning and decrease during rehearsal) are restricted to layer I of cortex (one sample t-test; p=0.037 and p=0.027, respectively; points represent individual mice). h, i, Learning modulates pre-existing sheath stability (%; F5,42=69.72, p<0.0001; points represent means per mouse). Learning mice have fewer stable sheaths (p<0.0001; Tukey’s HSD) and more retracting sheaths (p=0.014; sheaths pseudocolored in h). j, Sheaths retract further in learning vs untrained mice (nmice=4, nsheaths=59 and nmice=3, nsheaths=22, respectively; Student’s t-test, t(4.62)=3.32, p=0.02). k, “Growing” sheaths lengthen before learning (Wilcoxon Signed-Rank; p=0.00006) but cease growth after the onset of learning. “Retracting” sheaths are initially stable but retract during (p=0.0047) and after learning (p=0.019). *p<0.05, **p<0.01, ***p<0.001, bars and error bars represent mean±SEM. For statistics, see Supplementary Table 2.1.
Fig. 2 |
Fig. 2 |. Forelimb reach learning increases OPC differentiation.
a, In vivo imaging of EGFP-positive OPCs in 10 wk old NG2-mEGFP mice. OPCs that undergo differentiation (yellow; top) retract their filopodia, increase branching, and lose mEGFP fluorescence intensity while surrounding OPC processes infiltrate their domain. Proliferating OPCs (cyan; middle top) undergo cytokinesis and migrate to form independent domains. Dying OPCs (magenta; middle bottom) retract fragmented processes and their cell bodies become enlarged prior to disappearance. A small percentage of OPCs undergo proliferation followed by differentiation (bottom). b, Experimental timeline with imaging timepoints. c, OPC differentiation rate varies by learning week (Mean±SEM; F4,14=4.85, p=0.011). Rate is increased during the first week following forelimb reach training compared to both baseline and learning week (p=0.015 and p=0.021, respectively; Tukey’s HSD). d, No effect of learning on proliferation rate. e, No effect of learning on death rate. f, The majority (87.4%) of OPCs undergo direct differentiation (left side of cell fate diagram) as opposed to proliferation followed by differentiation (prolif+diff, right side of cell fate diagram). g, The proportion of differentiation events that occurred following cell division (prolif+diff) did not differ between baseline and learning or post-learning timepoints. *p<0.05, **p<0.01, ***p<0.001; bars and error bars represent mean±SEM; points represent individual mice. For statistics, see Supplementary Table 2.2.
Figure 3 |
Figure 3 |. Demyelination results in incomplete oligodendrocyte replacement and functional deficits in motor cortex.
a, Timeline of cuprizone administration and in vivo two-photon imaging. b, c, Categorization of oligodendrocyte fates following cuprizone administration as “surviving” (grey), “lost” (red), and “new” (blue). Shaded area represents cuprizone administration. d, e, Biphasic oligodendrocyte loss: initial loss of EGFP+ myelin sheaths and subsequent shrinking of cell body before loss of EGFP signal in an MOBP-EGFP mouse. e, Myelin loss (nmice=3, ncells=45) occurs earlier than oligodendrocyte soma loss (nmice=3, ncells=47; Student’s t-test, t(90)=−5, p<0.0001; box plots represent median and IQR). f, Cumulative oligodendrocyte gain and loss relative to baseline (%); traces represent individual mice. g, Cumulative oligodendrocyte loss is tightly related to oligodendrocyte gain (Spearman’s ρ=0.922, p <0.0001). h, Delayed inflection point for oligodendrocyte replacement relative to loss (8.71±0.72 vs. 4.51±0.68 days post cuprizone, respectively; nmice=5; t(8)=4.24, p=0.0028; Student’s t-test), and decreased asymptote of replacement relative to loss (60.52±3.03% vs. 87.06±3.10%, respectively; t(8)=6.12, p=0.0003; Student’s t-test). i, Representative heat maps of neuronal firing rate (FR) in the motor cortex of healthy mice (left, control) versus remyelinating mice (right, cuprizone). j, Neuronal FR was comparable between control and cuprizone mice both prior to and during cuprizone administration, but was elevated in cuprizone mice both in the first and second week following cuprizone cessation (Wilcoxon Rank-Sum; p=0.0063 and p=0.0157, respectively; points represent individual neurons, lines and error bars represent median and IQR). By three weeks post-cuprizone, FR was indistinguishable between cuprizone and control mice. *p<0.05, **p<0.01, ***p<0.001, for statistics see Supplementary Table 2.3.
Figure 4 |
Figure 4 |. Myelin sheath number on new oligodendrocytes is regulated during remyelination.
a, b, Remyelination modulates sheath number (F1,19=8.03, p=0.0105). Oligodendrocytes generated in the first week of remyelination (top, a) generate more sheaths than age-matched control oligodendrocytes (bottom, a; p=0.010, Tukey’s HSD) or than oligodendrocytes formed after week 1 of remyelination (p=0.0023). FOV shown 2 days before oligodendrocyte birth and 7 days post-birth. Points represent individual oligodendrocytes. c, Day of oligodendrocyte generation relative to end of cuprizone predicts sheath number in demyelinated mice (R=0.48, F1,12=11.16, p=0.006; shaded area represents 95% confidence of fit; points represent oligodendrocytes). d, In the first three days post-generation, sheaths from new oligodendrocytes grow more often than they retract (F3,18=15.34, p<0.0001) in both control (p=0.0001, nmice=4) and cuprizone-treated mice (p=0.0096, nmice=6, Tukey’s HSD). Points represent individual oligodendrocytes. e, New sheaths change in length in the week following their generation (control: F3,302=47.94, p<0.0001, cuprizone: F3,293=29.71, p<0.0001; lines and shaded area represent mean±SEM). Sheaths in both control and cuprizone treatment stabilize their length within 3 days of sheath birth (d0 vs. d3, p<0.0001 in both treatments; Tukey’s HSD). f, Sheath length does not differ in control and cuprizone-treated mice 3 days after sheath generation (boxplots represent median and IQR; points represent sheaths). g, Remyelination shapes predicted total myelin ([mean sheath length] x [# of sheaths/OL]) generated by a new oligodendrocyte (F1,19=8.93,p=0.0077). It is higher in week 1 of remyelination than age-matched control oligodendrocytes (p<0.0001) or than oligodendrocytes generated after week 1 of remyelination (p=0.0016; Tukey’s HSD). h, New oligodendrocytes can place sheaths in previously unmyelinated areas (top, “Remodeling”) or previously myelinated areas (bottom, “Remyelinating”). Pink arrows point to location of junction between new sheath and new OL process. Relevant sheaths pseudo-colored. i, New oligodendrocytes engage in remodeling more often than remyelinating (t(20)=−5.08, p<0.0001,, nmice=5; Paired student’s t-test). *p<0.05, **p<0.01, ***p<0.001; bars and error bars represent mean±SEM, for statistics see Supplementary Table 2.4.
Figure 5 |
Figure 5 |. Motor learning modulates oligodendrogenesis after demyelination in a timing-dependent manner.
a,b, Cumulative OL replacement (%; lines and shaded areas represent mean±SEM) across post-cuprizone behavioral interventions. c, d, Neither maximum OL loss nor maximum rate of oligodendrogenesis differ between behavioral interventions (boxplots represent median and IQR). e, Demyelination modulates early-learning success rate (F6,78=3.00, p=0.011, points represent mean±SEM). Success rate improves from first to last day of reaching for control (p=0.005; Tukey’s HSD), but not cuprizone-treated mice. f, Both 3 and 10 days post-cuprizone, demyelinated mice have increased neuronal FR relative to controls (Wilcoxon Rank-Sum, p=0.006 and p=0.016, respectively; points represent neurons). g, Both 4d post-cuprizone and 10d post-cuprizone, demyelinated mice have decreased success rates relative to controls (F1,13=9.09, p=0.01; points represent mice). h, OL replacement rate is suppressed during early-learning relative to untrained demyelinated mice (Wilcoxon Rank-Sum, p=0.0043). i, Delayed inflection point of OL-replacement in early-learning vs. untrained demyelinated mice (Student’s t-test; t(10)=5.77, p=0.0002), colored line/shaded area represents asymptote±SEM. j, No effect of cuprizone treatment on overall delayed-learning performance. k, 10 days post-cuprizone, but not 17 days post-cuprizone, demyelinated mice have increased neuronal FR relative to controls (Wilcoxon Rank-Sum, p=0.016). l, 11 days post-cuprizone, but not 17 days post-cuprizone, demyelinated mice have impaired reaching performance relative to controls (Student’s t-test; t(12.28=−2.39, p=0.033). m, Delayed-learning modulates OL replacement rate (F2,14=4.61, p=0.029). Rate decreases in untrained, but not delayed-learning, mice by 21 days post-cuprizone (p=0.008; Tukey’s HSD). n, Delayed inflection point (Student’s t-test; t(8)=4.33, p=0.0025) and increased asymptote of OL-replacement (t(8)=3.35, p=0.01) in delayed-learning vs. untrained mice. *p<0.05, **p<0.01, ***p<0.001, bars and error bars represent mean±SEM; for statistics see Supplementary Table 2.5.
Figure 6 |
Figure 6 |. Delayed motor learning promotes remyelination via new oligodendrocytes.
a, Representative maximum-projections of superficial cortical oligodendrocytes (OLs) at baseline (left; −3 weeks), end of cuprizone diet (middle; 0 weeks), and following 7 weeks of remyelination (right) in untrained (top) and delayed-learning (bottom) mice. Yellow arrows designate new oligodendrocytes. b, c, Delayed-learners replace a greater proportion of lost oligodendrocytes (Student’s t-test; t(3.92)=−2.99, p=0.04) and have a higher density of cortical oligodendrocytes than untrained mice (t(3.72)=−3.87, p=0.02) by 7-weeks post-cuprizone (points represent individual mice). d, While new OLs have increased sheath numbers in first versus third week post-cuprizone (F5,15=5.14, p=0.006; p=0.0038, Tukey’s HSD), delayed-learning does not modulate this relationship (p=0.1; points represent individual OLs.) e, Delayed-learning modulates sheath dynamics (F3,10=6.65, p=0.0095). Sheaths on new OLs are more likely to grow than retract in untrained (p=0.007, Tukey’s HSD) but not delayed-learning mice (p>0.8; points represent individual OLs.) f, Sheaths from new OLs are equally likely to remyelinate denuded axons in untrained and delayed-learning mice (Student’s t-test; t(16.08)=−0.52, p=0.6; points represent individual OLs.) g, Population-level extrapolations suggest that delayed-learning modulates restoration of baseline sheath number (F3,8=7.80, p=0.0093; points represent mice). More sheaths are replaced after training in delayed-learning mice (Tukey’s HSD; p=0.018). h, Population-level extrapolations suggest that delayed-learners restore a greater proportion of baseline sheath number 7 weeks post-cuprizone (Student’s t-test; t(2.64)=−3.76, p=0.0407; points represent mice). i, Extrapolating sheath location probability to the population-level suggests that delayed-learners remyelinate a greater proportion of denuded axons than untrained mice (31% vs. 19%, respectively; Student’s t-test; t(3.14)=−5.07, p=0.013). *p<0.05, **p<0.01, ***p<0.001, bars and error bars represent mean±SEM; for statistics see Supplementary Table 2.6.
Figure 7 |
Figure 7 |. Delayed motor learning stimulates surviving mature oligodendrocytes to contribute to remyelination.
a, Identification of surviving oligodendrocytes (OLs) via conserved processes. Note the new process pointed out on the same oligodendrocyte in a and c (cyan arrow). b,c,d, Surviving OLs both lose (pink) and generate sheaths (green). Image manually resliced in c (44d) to show sheath and process connecting to cell body. e,f, Number of sheaths generated per surviving OL and minimum possible OL age at time of sheath generation (assuming age 0 at imaging onset). g, Delayed-learning modulates surviving OL sheath production (F2,51=9.30, p=0.0004). Sheath generation increases during learning (p<0.0001) and decreases post-learning (p=0.019), resulting in elevated generation relative to untrained mice both during (p<0.0001) and after learning (p=0.026). h, Learning modulates cumulative new sheaths on surviving OLs (F7,618=12.96, p<0.0001). Delayed-learning increases new sheaths relative to baseline (p=0.019) and relative to untrained mice both during (p=0.028) and after (p=0.033) learning. Sheath number increases up to 4 weeks post-learning (p<0.0001). i, Learning modulates cumulative lost sheaths on surviving OLs (F7,611=7.04, p<0.0001). Sheath loss initially increases in untrained and delayed-learning mice (p<0.0001 and p<0.0001, respectively) then ceases in delayed-learning (p>0.9) but not untrained mice (p<0.0001). j, No relationship between sheath loss and gain (*single outlier removed for analysis). k,l, Learning increases sheath generation by surviving OLs in both L1 and L/3 relative to controls (F1,6=7.05, p=0.038; p=0.0019 and p=0.0016, respectively), though generation is heightened within L1 versus L2/3 (p=0.044). Pink arrows point to location of junction between new sheath and surviving OL process. Relevant sheaths pseudo-colored. m,n, Three weeks post-cuprizone, new sheaths from surviving OLs are more likely to remyelinate denuded axons than sheaths from new OLs (t(2)=7.28, p=0.018). o, Surviving OLs in delayed-learning mice contribute more sheaths to the original pattern of myelination (via maintenance and addition) than untrained mice (t(35)=−2.25, p=0.031). *p<0.05, **p<0.01, ***p<0.001, bars and error bars represent mean±SEM; for statistics see Supplementary Table 2.7.

References

    1. Reich DS, Lucchinetti CF & Calabresi PA Multiple Sclerosis. N. Engl. J. Med. 378, 169–180 (2018). - PMC - PubMed
    1. Hauser SL, Chan JR & Oksenberg JR Multiple sclerosis: Prospects and promise. Ann. Neurol. 74, 317–327 (2013). - PubMed
    1. Périer O & Grégoire A. Electron microscopic features of multiple sclerosis lesions. Brain J. Neurol. 88, 937–952 (1965). - PubMed
    1. Tripathi RB, Rivers LE, Young KM, Jamen F & Richardson WD NG2 Glia Generate New Oligodendrocytes But Few Astrocytes in a Murine Experimental Autoimmune Encephalomyelitis Model of Demyelinating Disease. J. Neurosci. 30, 16383–16390 (2010). - PMC - PubMed
    1. Prineas JW & Connell F. Remyelination in multiple sclerosis. Ann. Neurol. 5, 22–31 (1979). - PubMed

Methods references

    1. Schain AJ, Hill RA & Grutzendler J. Label-free in vivo imaging of myelinated axons in health and disease with spectral confocal reflectance microscopy. Nat. Med. 20, 443–449 (2014). - PMC - PubMed
    1. Parslow A, Cardona A & Bryson-Richardson RJ Sample Drift Correction Following 4D Confocal Time-lapse Imaging. JoVE J. Vis. Exp. e51086 (2014) doi:10.3791/51086. - DOI - PMC - PubMed
    1. Peters A & Sethares C. Oligodendrocytes, their Progenitors and other Neuroglial Cells in the Aging Primate Cerebral Cortex. Cereb. Cortex 14, 995–1007 (2004). - PubMed
    1. Czopka T, ffrench-Constant C & Lyons DA Individual Oligodendrocytes Have Only a Few Hours in which to Generate New Myelin Sheaths In Vivo. Dev. Cell 25, 599–609 (2013). - PMC - PubMed
    1. Watkins TA, Emery B, Mulinyawe S & Barres BA Distinct Stages of Myelination Regulated by γ-Secretase and Astrocytes in a Rapidly Myelinating CNS Coculture System. Neuron 60, 555–569 (2008). - PMC - PubMed

Publication types

MeSH terms