. 2020 Jul;23(7):854-868.
doi: 10.1038/s41593-020-0632-8. Epub 2020 May 18.

General anesthetics activate a potent central pain-suppression circuit in the amygdala

Affiliations

General anesthetics activate a potent central pain-suppression circuit in the amygdala

Thuy Hua et al. Nat Neurosci. 2020 Jul.

Abstract

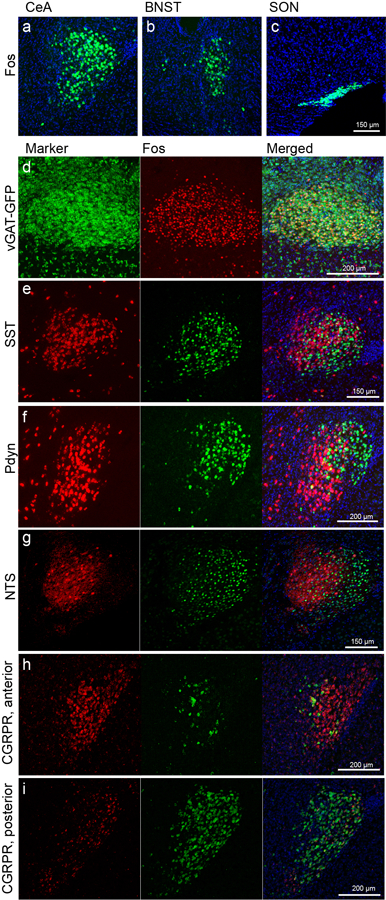
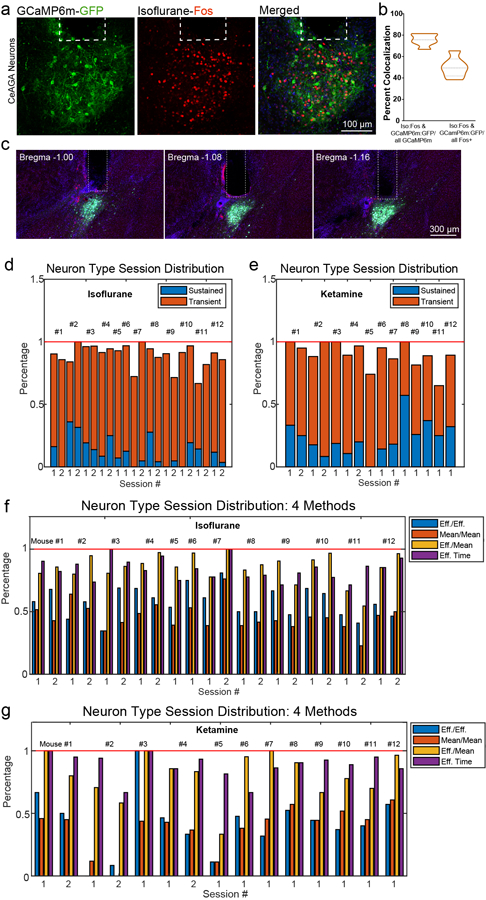
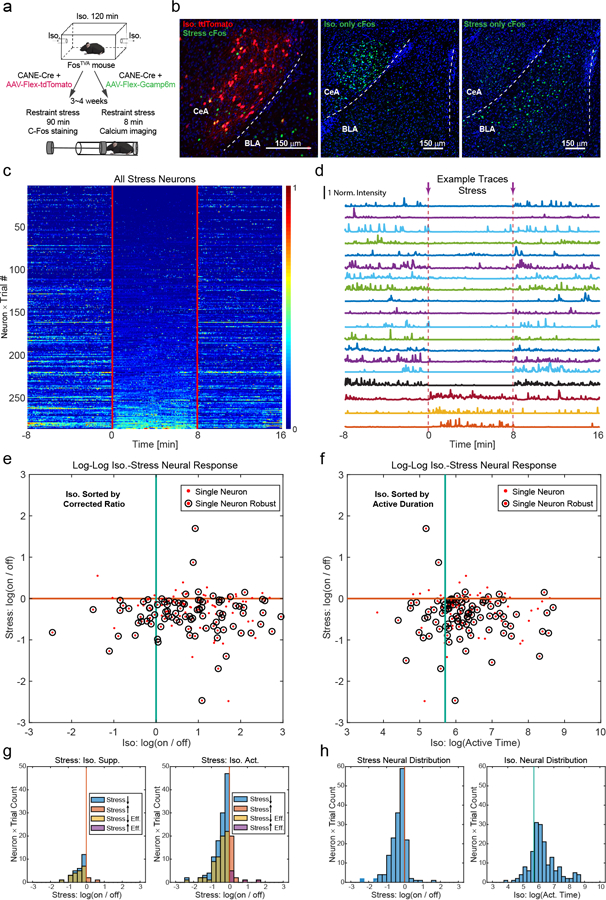
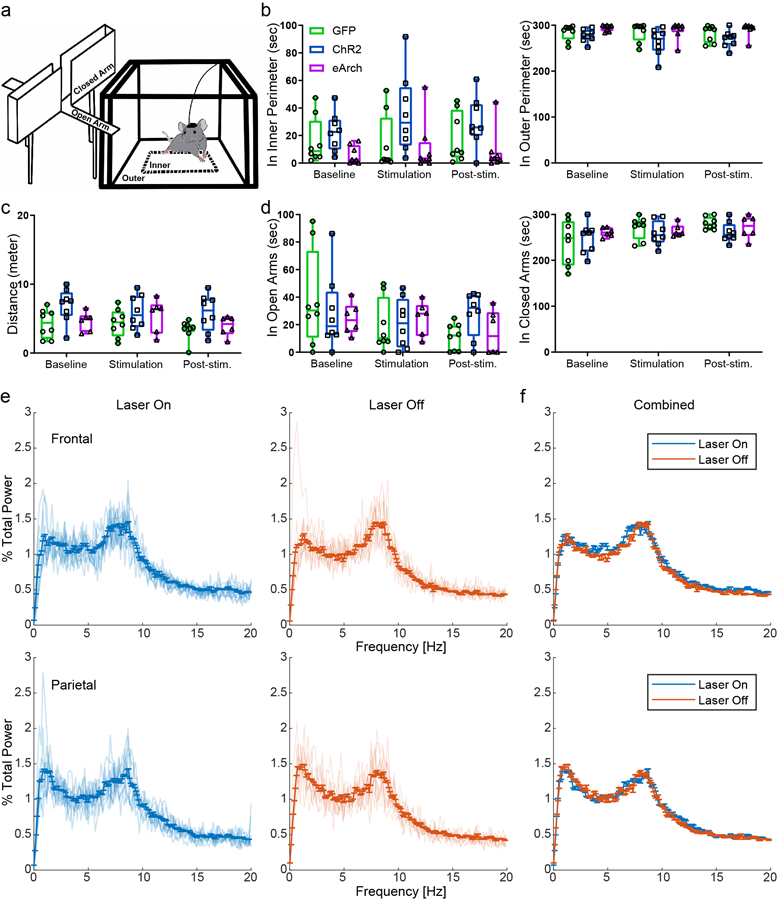
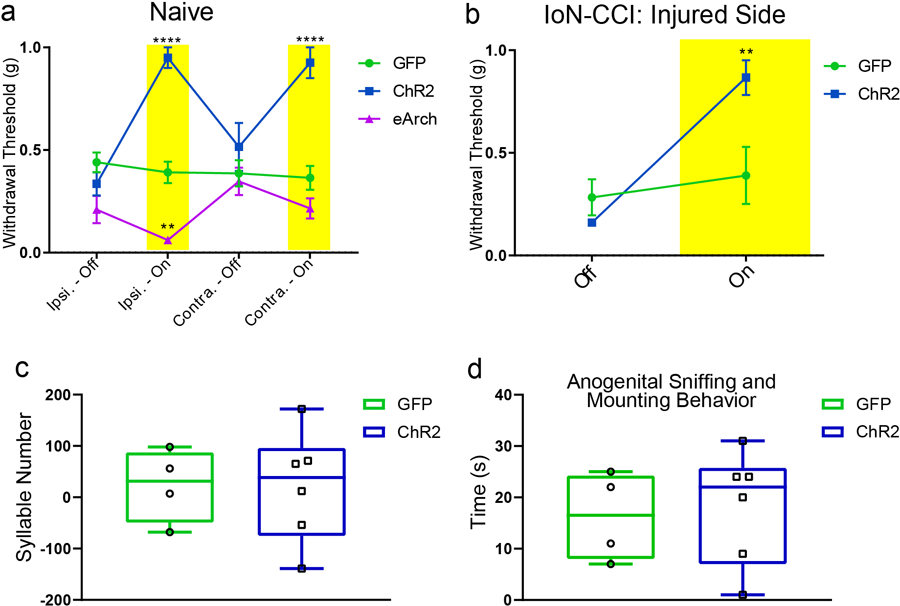
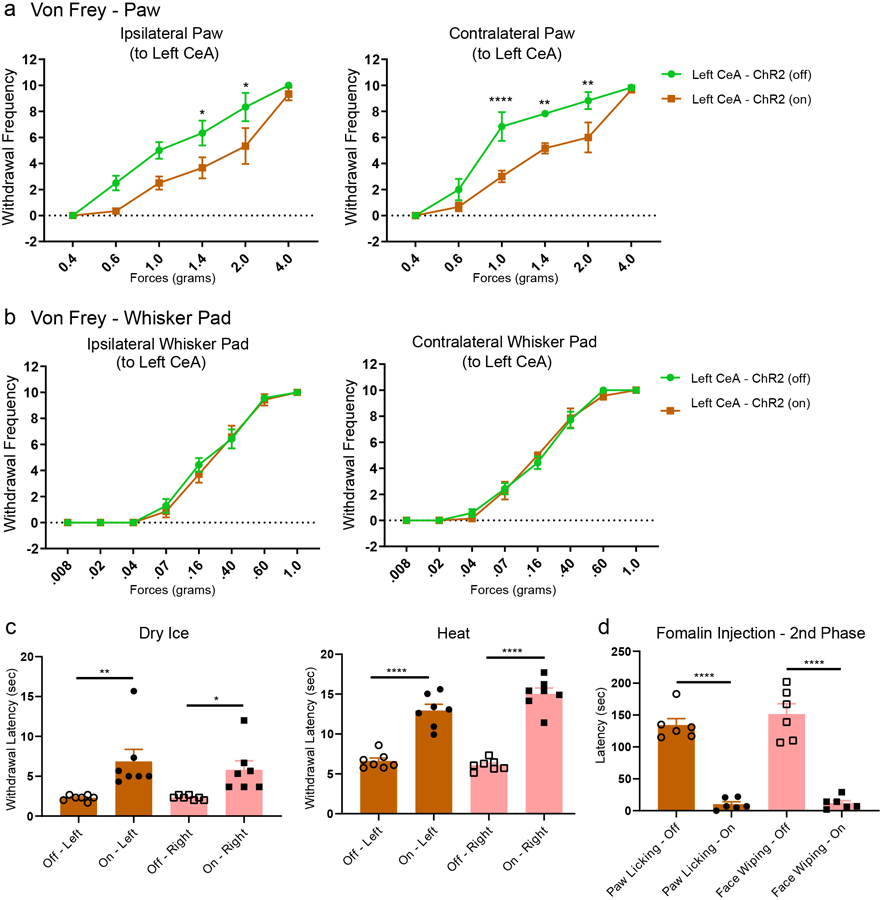
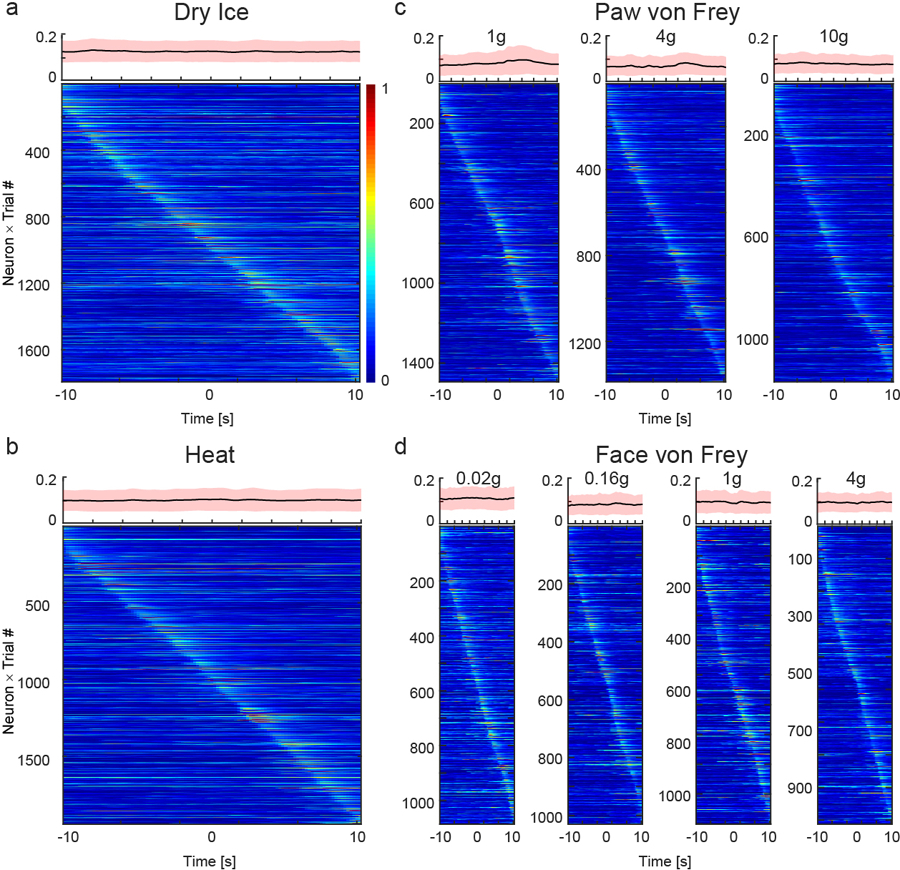
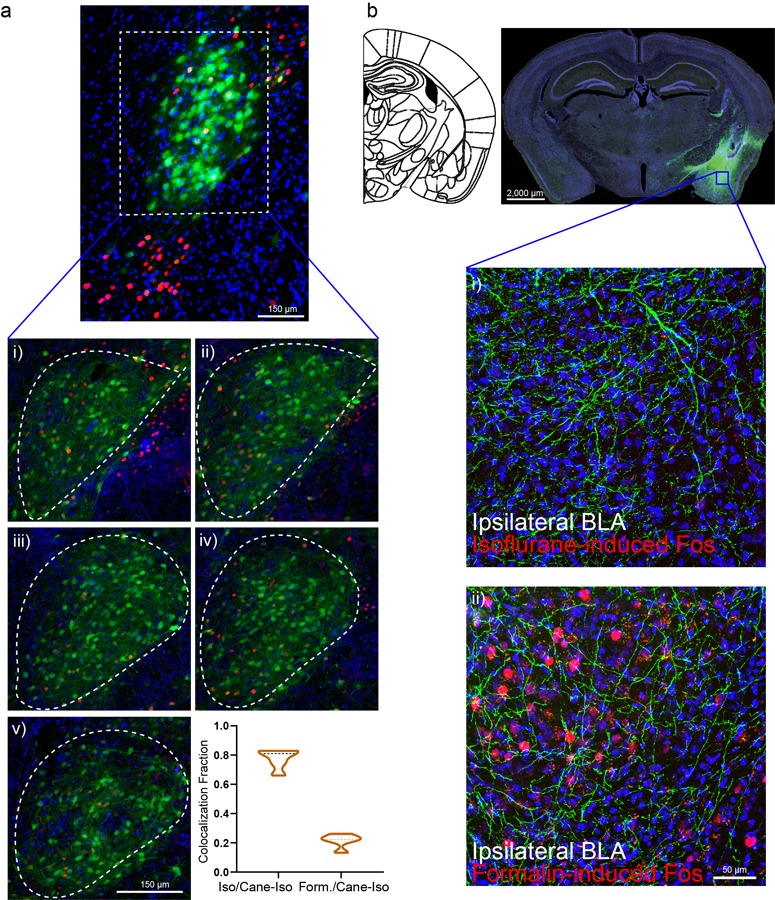
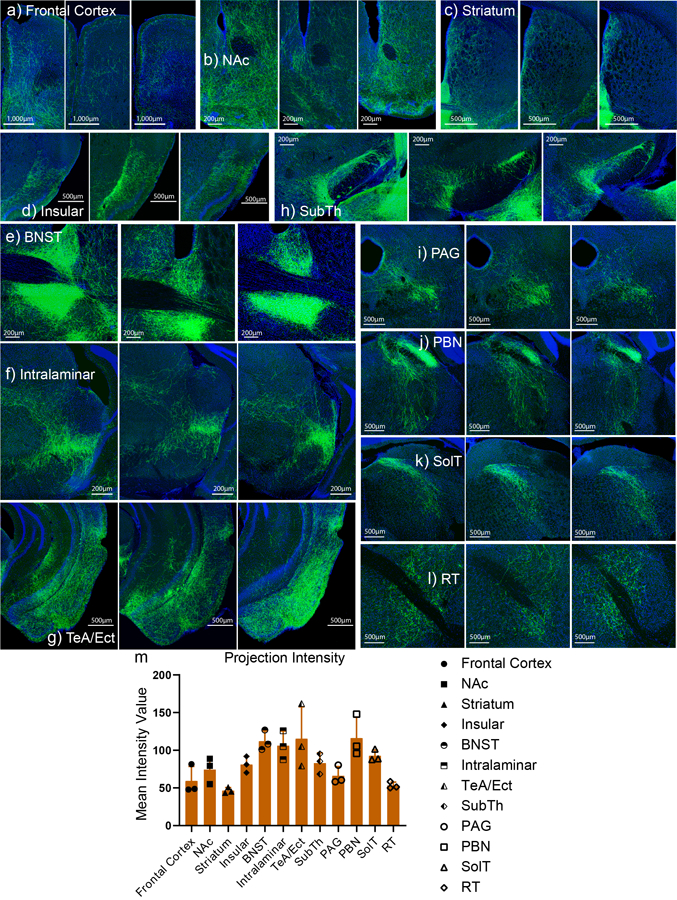
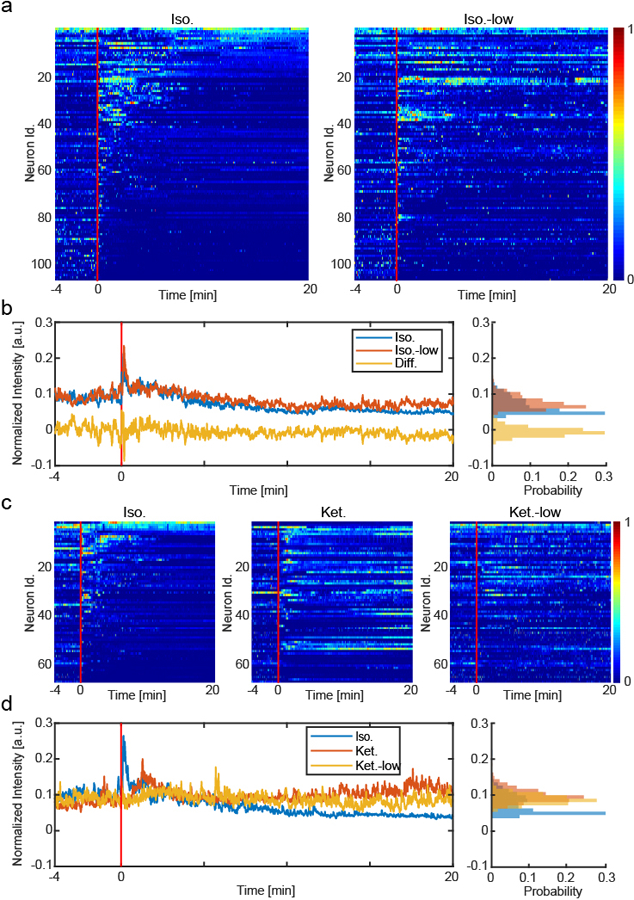
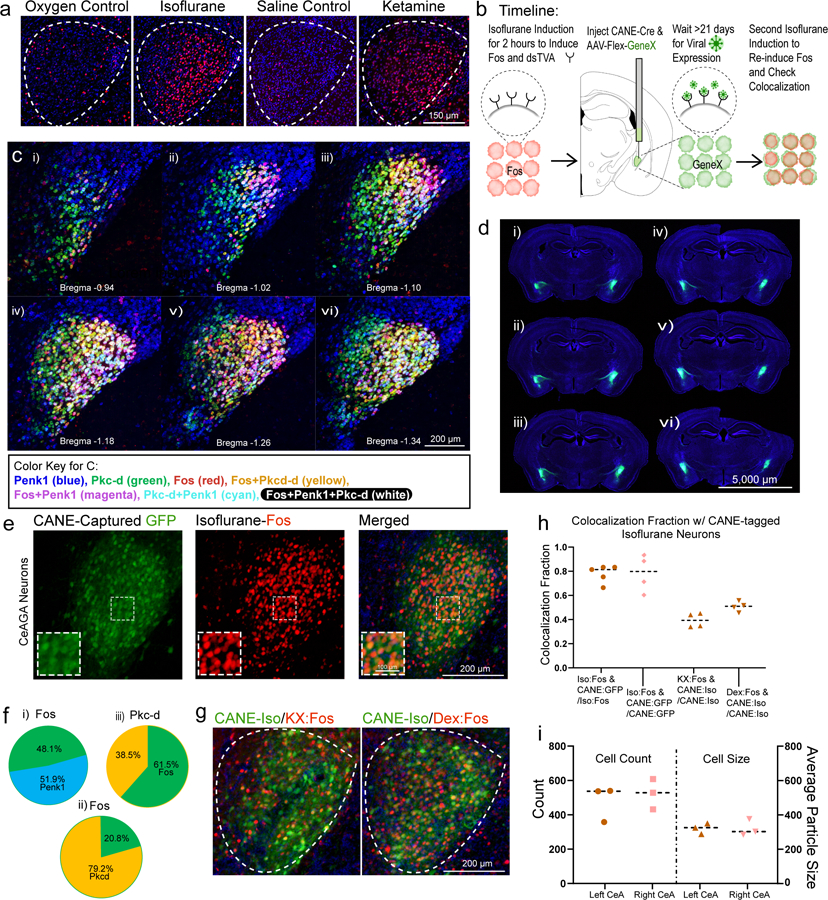
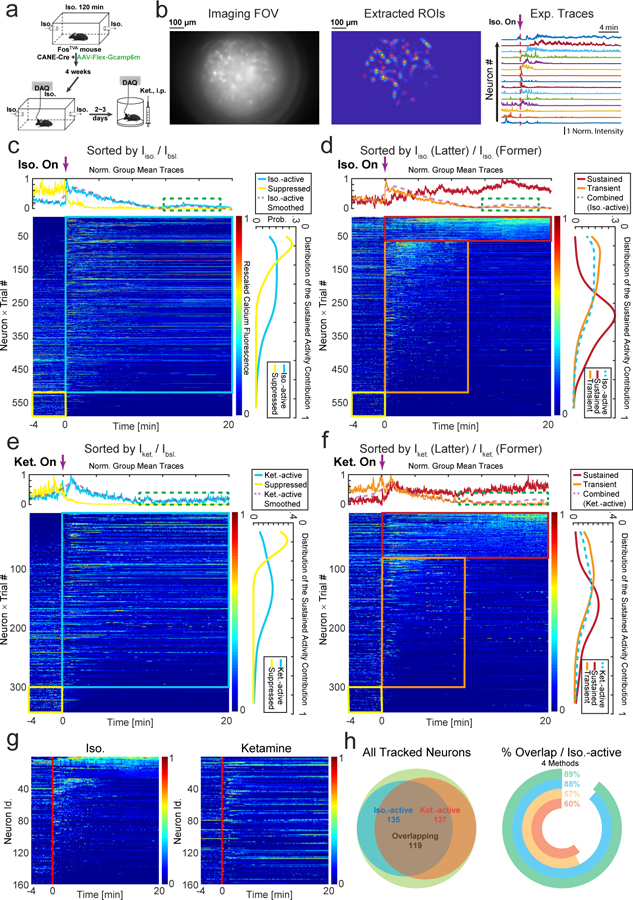
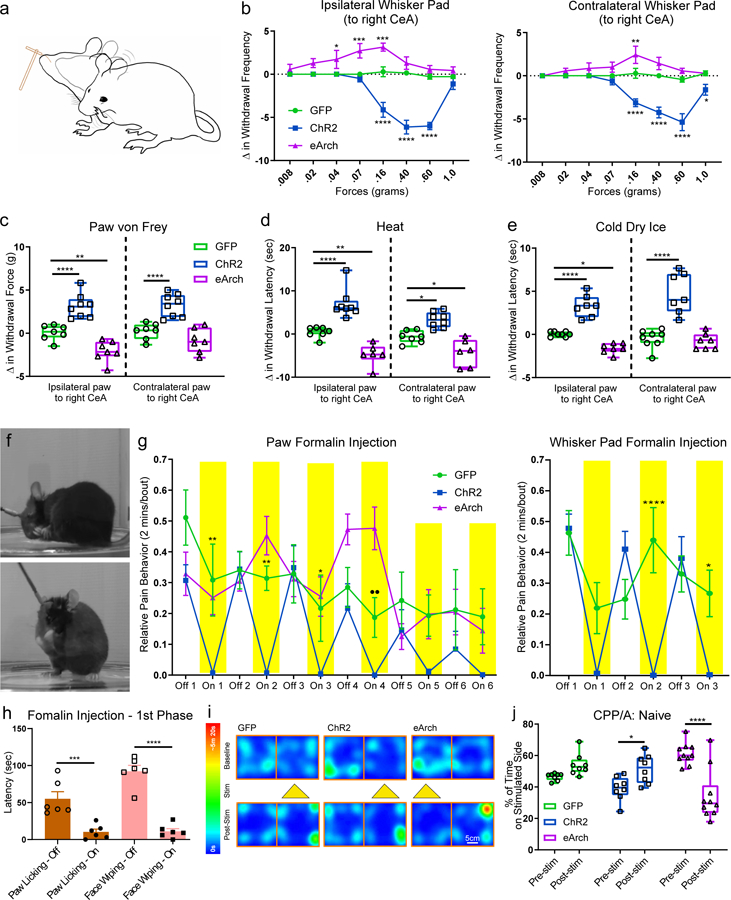
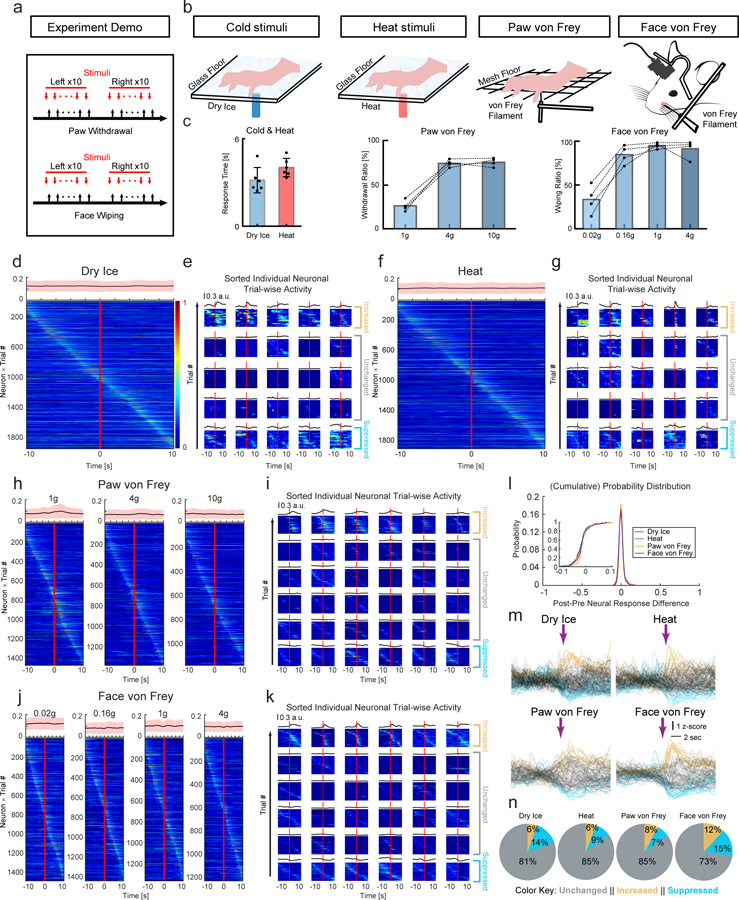
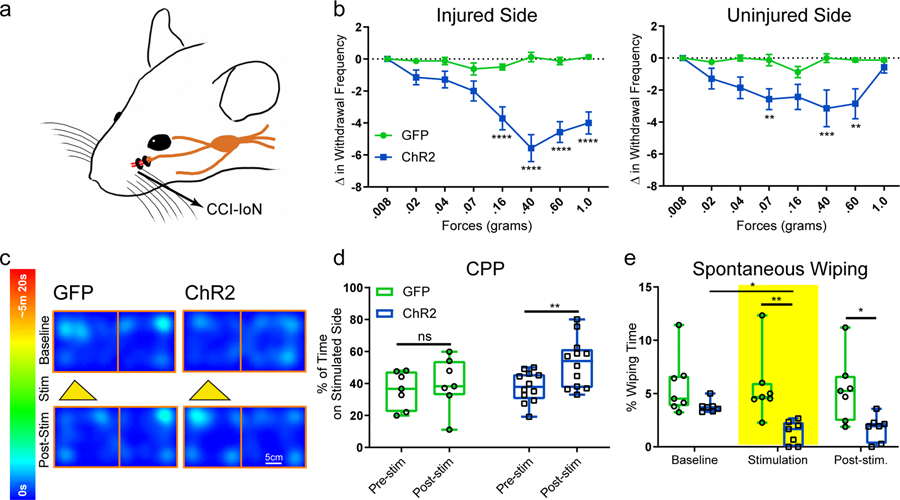
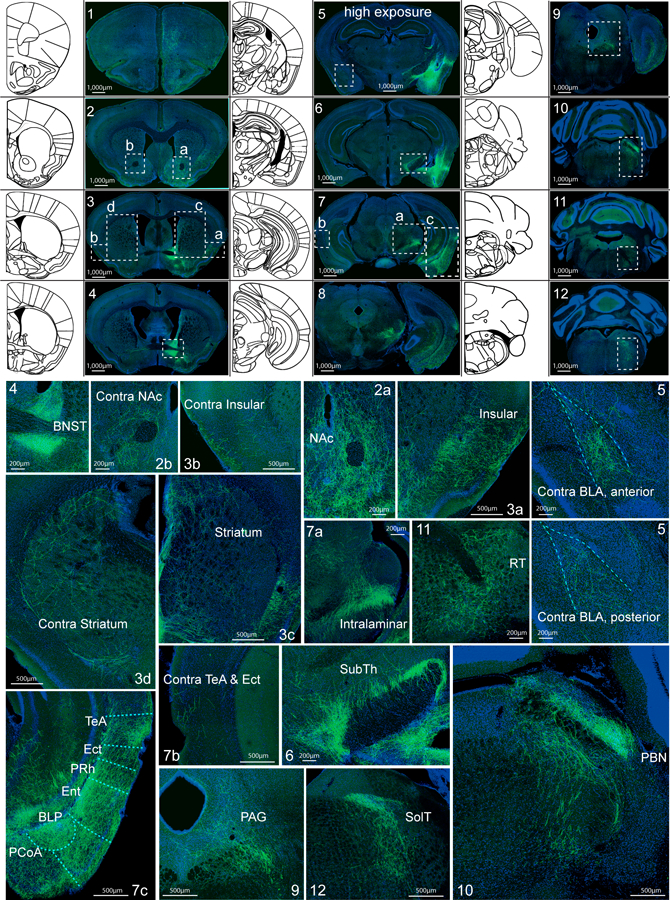
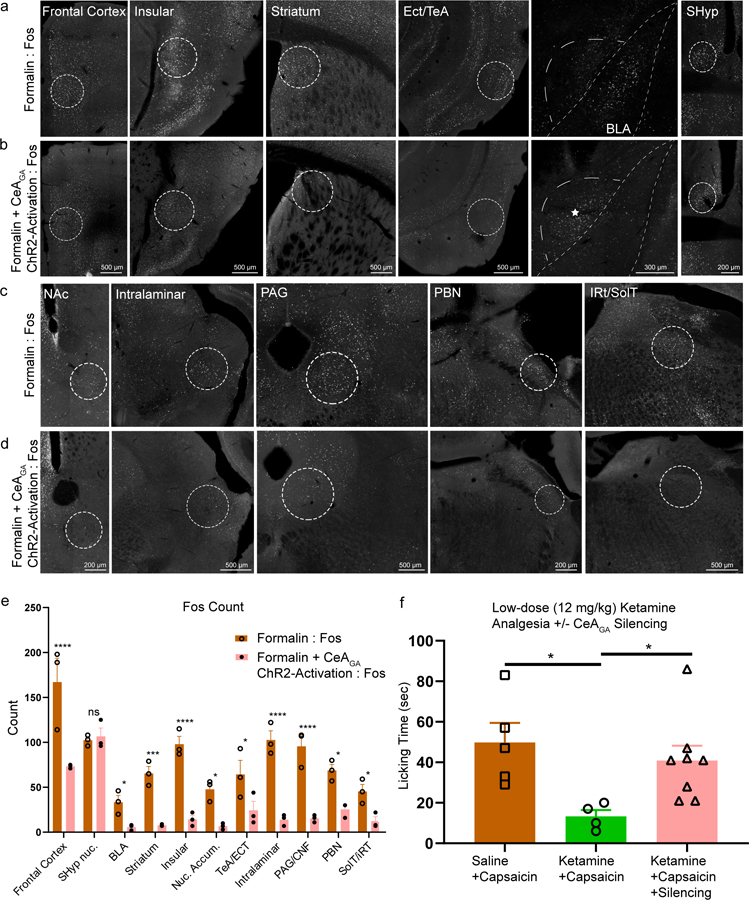
General anesthesia (GA) can produce analgesia (loss of pain) independent of inducing loss of consciousness, but the underlying mechanisms remain unclear. We hypothesized that GA suppresses pain in part by activating supraspinal analgesic circuits. We discovered a distinct population of GABAergic neurons activated by GA in the mouse central amygdala (CeAGA neurons). In vivo calcium imaging revealed that different GA drugs activate a shared ensemble of CeAGA neurons. CeAGA neurons also possess basal activity that mostly reflects animals' internal state rather than external stimuli. Optogenetic activation of CeAGA potently suppressed both pain-elicited reflexive and self-recuperating behaviors across sensory modalities and abolished neuropathic pain-induced mechanical (hyper-)sensitivity. Conversely, inhibition of CeAGA activity exacerbated pain, produced strong aversion and canceled the analgesic effect of low-dose ketamine. CeAGA neurons have widespread inhibitory projections to many affective pain-processing centers. Our study points to CeAGA as a potential powerful therapeutic target for alleviating chronic pain.


Conflict of interest statement

Competing Financial Interests Statement

The authors declare no competing financial interests.

Figures

Extended Data Fig. 1
Extended Data Fig. 1. Isoflurane general anesthesia activates different neuronal ensembles and molecular marker analysis of CeAGA neurons.
General anesthesia activated the a, central amygdala (CeA), b, bed nucleus of stria terminalis (BNST), and c, super optic nucleus (SON). Representative images two-color experiments examining the expression of various markers in Fos+ CeAGA neurons (induced by isoflurane). d, CeAGA neurons are a subset of GABAergic (vGAT) neurons in the central amygdala and all CeAGA express vGAT-GFP. e-i, CeAGA neurons have minimal to no overlap with e, somatostatin (SST), f, prodynorphin (Pdyn), g, neurotensin (NTS), and h-i, calcitonin gene-related peptide receptor (CGRPR) expressing neurons in CeA.
Extended Data Fig. 2
Extended Data Fig. 2. Representative post hoc histology and session distributions of activity of CANE-captured isoflurane-activated CeAGA neurons in response to isoflurane or ketamine.
a, Representative images of CANE-GCaMP6m+ neurons (green) and isoflurane-activated Fos+ neurons (red) and their overlap. Dotted box showing the placement of the GRIN lens in CeA. b, Quantification of the percent colocalization of Iso:Fos/all GCaMP6m (75.45±5.04%) and GCaMP6m:GFP/all Fos (50.1±8.70%) (n=6 animals). Data are mean ± s.e.m. c, Three consecutive representative images of post hoc histology showing optic fiber tract into the CeA from bregma −1.00 mm to −1.16 mm. Optic fiber diameter is 200 µm. d, Session-wise percentage distribution of iso.-sustained and iso.-transient neurons from Figure 2d. e, Session-wise percentage distribution of ketamine-sustained and ketamine-transient neurons from Figure 2f. f and g, Session-wise percentage distribution of the isoflurane-activated neurons (f), or the ketamine-activated neurons (g), calculated using four methods calculated based on the ratio between the post- and pre-stimulation (i.e. anesthetic administration) activity. Cyan, Eff./Eff., mean activity of (post-stim) effective time / mean activity of (pre-stim) effective time. Orange, Mean/Mean, mean activity of all the (post-stim) time /mean activity of all the (pre-stim) time. Yellow, Eff./Mean, mean activity of (post-stim) effective time / mean activity of all the (pre-stim) time. Purple, Eff. time, total (post-stim) effective time. “Effective time” refers to the time points of a neural trace whose intensity is two median absolute deviation above its mean. Only these time points were considered to compute the effective mean. See Methods for details of the 4 methods. Pre-, pre-stimuli, awake state (−4 – 0 min). Post-, post-stimuli, isoflurane or ketamine (0–20 min).
Extended Data Fig. 3
Extended Data Fig. 3. CANE-captured CeAGA neurons are mostly inhibited by stress.
a, Schematic of CANE captured isoflurane-activated CeAGA neurons followed by a second exposure to restraint stress (left, for Fos expression, right, for calcium imaging). b, Left, representative images of CANEISO-tdTomato neurons (red) and stress-activated Fos+ neurons (green) and their overlap. (n=3 animals). Right, representative images of isoflurane-only activated Fos+ neurons (green, Repeated experiments n=5 biologically independent samples.) and compared to stress-only activated Fos+ neurons (green, Repeated experiments n=3 biologically independent samples.) in the CeA. c, Heatmap, activity patterns of CANEISO-GCaMP6m captured CeAGA neurons in stress experiment sorted by the average activity during stress period (−8 – 0 min, pre-stress; 0 – 8 min, restraint stress; 8 −16 min, post-stress. 282 neurons from 5 mice × 2 trials). A small number of neurons (in the bottom of the heatmap) were activated by stress. d, Example traces of CANEISO-GCaMP6m captured CeAGA neurons in stress experiment showing both stress-inhibited and stress-activated neurons. Norm. Intensity: normalized calcium signals rescaled to 0–1. e, Scatter plots of the tracked same neurons based on isoflurane and stress related activity patterns. Each dot is calculated based on effectiveness corrected activity ratio between the post- and pre-stimulus periods for isoflurane-stimulus and stress-stimulus, separately. Corrected ratio, mean activity of (post-) effective time / mean activity of (pre-) effective time. Single dots represent individual neurons in the logarithmic scale coordinates, and the circled dots represent robustly firing neurons, with the maximum intensity of each neuron in the whole duration exceeding a threshold. f, Same plots with isoflurane responses calculated by actively firing time exceeding a threshold (1 min). Active duration, total (post-) effective time of effective moment>1 min. “Effective time” refers to the time points of a neural trace whose intensity is two median absolute deviation above its mean. Only these time points were considered to compute the mean. g, Neuron count summary of e. Left, Neuron count distribution of activity of isoflurane-suppressed neurons during stress. Right, Neural count distribution of activity of isoflurane-activated neurons during stress. h, Neural count distribution of f. Left, marginal count distribution of activity of CANEISO-GCaMP6m captured CeAGA neurons during stress. Right, marginal count distribution of activity of CANEISO-GCaMP6m captured CeAGA neurons during isoflurane GA. (282 total neurons from 5 mice × 2 trials.)
Extended Data Fig. 4
Extended Data Fig. 4. Manipulation of CeAGA neurons did not induce anxiety-like or fear-like behavior or change the gross brain state.
a, Schematics of the Elevated Plus Maze (left) and Open Field (right) apparatus. b, Quantification of total time spent in the inner (GFP: 15.67 ± 5.97s (baseline), 14.18 ± 7.24s (stim), 18.07 ± 6.38s (post); ChR2: 22.59 ± 4.92s (baseline), 35.90 ± 10.22s (stim), 29.73 ± 6.49s (post); eArch: 5.69 ± 2.32s (baseline), 11.01 ± 6.61s (stim), 8.54 ± 5.20s (post)) and outer perimeter (GFP: 284.32 ± 6.01s (baseline), 285.70 ± 7.25s (stim), 281.80 ± 6.39s (post); ChR2: 277.31 ± 4.92s (baseline), 264.00 ± 10.22s (stim), 270.17 ± 6.47s (post); eArch: 294.31 ± 2.32s (baseline), 288.99 ± 6.61s (stim), 291.46 ± 5.20s (post)) of the Open Field Test (control, n=8 animals, ChR2, n=8 animals, eArch, n=6 animals; two-way repeated measures ANOVA; P-value was above 0.05, no significance; F4,42=0.8743 (inner), F4,42=0.8633 (outer)). Data are mean ± s.e.m. c, Quantification of total distance travelled (GFP: 4.27 ± 0.73m (baseline), 4.36 ± 0.72m (stim), 3.36 ± 0.51m (post); ChR2: 6.92 ± 0.87m (baseline), 5.91 ± 0.88m (stim), 5.85 ± 0.95m (post); eArch: 4.59 ± 0.56m (baseline), 5.45 ± 0.99m (stim), 3.91 ± 0.59m (post)), and d, total time spent in the open (GFP: 38.53 ± 12.26s (baseline), 19.19 ± 6.65s (stim), 11.03 ± 3.44s (post); ChR2: 28.61 ± 9.69s (baseline), 21.21 ± 6.31s (stim), 27.91 ± 5.76s (post); eArch (24.33 ± 4.70s (baseline), 24.85 ± 4.98s (stim), 14.35 ± 6.56s (post)) and closed arms (GFP: 239.16 ± 17.28s (baseline), 270.86 ± 8.54s (stim), 280.76 ± 4.61s (post); ChR2: 248.58 ± 11.66s (baseline), 258.80 ± 9.36s (stim), 261.08 ± 7.60s (post); eArch (261.22 ± 4.07s (baseline), 264.45 ± 5.50s (stim), 272.48 ± 10.19s (post)) of the Elevated Plus Maze (control, n=8 animals, ChR2, n=8 animals, eArch, n=8 animals; two-way repeated measures ANOVA; P-value was above 0.05, no significance; F4,38=1.083 (distance), F4,38=1.402 (open arms), F4,38=1.355 (closed arms)). Data are mean ± s.e.m. e, Power spectrum of EEG signals in the frontal and parietal cortex. Left, laser on, right, laser off. f, Overlap of power spectrum of EEG signals in the frontal and parietal cortex from e. The mean spectrum in each condition was calculated from the average across 9 sessions (n= 3 mice, 2 min laser on / 2 min laser off, 3 repetitions in each mouse). The error bar represents the standard error. The power spectrum was normalized.
Extended Data Fig. 5
Extended Data Fig. 5. Manipulations of CeAGA neurons modulated reflexive withdrawal threshold to von Frey filaments and activation of CeAGA neurons did not alter courtship behaviors.
a-b, Quantifications of the withdrawal threshold to von Frey filaments applied to the whisker pad in a, naïve (control, n=9 animals (0.44 ± 0.0g5 (ipsi-off), 0.39 ±0.05g (ipsi-on), 0.39 ±0.06g (contra-off), 0.36 ±0.06g (contra-on)), ChR2, n=8 animals (0.34 ± 0.06g (ipsi-off), 0.95 ±0.05g (ipsi-on), 0.52 ±0.12g (contra-off), 0.93 ±0.08g (contra-on)), eArch, n=7 animals (0.21 ± 0.07g (ipsi-off), 0.06 ± 0.01g (ipsi-on), 0.35 ± 0.07g (contra-off), 0.22 ± 0.05g (contra-on)); two-way ANOVA; ****P<0.0001, **P=0.0042; F6,84=10.80) and b, IoN-CCI mice (control, n=6 animals (0.28 ± 0.09g (off), 0.39 ± 0.14g (on)), ChR2, n=6 animals (0.16 ± 0g (off), 0.87 ± 0.08g (on)); two-way ANOVA; **P=0.0032; F1,20=10.54). c-d, Quantification of light-illumination induced changes in total syllable number of ultrasonic vocalizations (GFP: 23.25 ± 35.65; ChR2: 21.17 ± 44.17), or total duration of anogenital sniffing and mounting behavior (GFP: 16.25 ± 4.31s; ChR2: 18.17 ± 4.53s) in control CeAGA-GFP and CeAGA-ChR2 mice (with light - without light) during 2 min of social interactions (control, n=4 animals, ChR2, n=6 animals; unpaired t-test, two-tailed; P=0.974, F5,3=2.303 (syllable number), P=0.7791, F5,3=1.656 (anogenital sniffing)). Data are mean ± s.e.m.
Extended Data Fig. 6
Extended Data Fig. 6. Activation of the left CeAGA neurons modulated pain-related behaviors in naïve mice and acute pain models.
a, Quantification of effects of optogenetic activation of the left CeAGA neurons on the paw withdrawal frequency to six graded von Frey filaments ranging from 0.4 to 4.0 grams applied to the ipsilateral (Off: 0 ± 0 (0.40g), 2.50 ± 0.56 (0.60g), 5.00 ± 0.63 (1.0g), 6.33 ± 0.95 (1.40g), 8.33 ± 1.09 (2.0g), 10 ± 0 (4.0g); On: 0 ± 0 (0.40g), 0.33 ± 0.21 (0.60g), 2.50 ± 0.50 (1.0g), 3.67 ± 0.80 (1.40g), 5.33 ± 1.38 (2.0g), 9.33 ± 0.49 (4.0g)) or contralateral paw (Off: 0 ± 0 (0.40g), 2.00 ± 0.82 (0.60g), 6.83 ± 1.11 (1.0g), 7.83 ± 0.17 (1.40g), 8.83 ± 0.65 (2.0g), 9.83 ± 0.17 (4.0g); On: 0 ± 0 (0.40g), 0.67 ± 0.33 (0.60g), 3.00 ± 0.45 (1.0g),5.0 ± 0.37 (1.40g), 6.0 ± 1.15 (2.0g), 9.67 ± 0.21 (4.0g)) to the left CeA. (Ipsilateral and contralateral, ChR2, n=6 animals; two-way ANOVA; *P=0.0500 (2.0g), *P=0.0217 (1.4g), ****P<0.0001, **P=.0023 (1.4g), **P=.0029 (2.0g); F1,60=20.51 (ipsi), F1,60=28.81 (contra)). b, Quantification of optogenetic activation of the left CeAGA neurons showed that this manipulation did not induce any change in the head withdrawal frequency to eight von Frey filaments ranging from 0.008 to 1.0 gram applied to either the ipsilateral (Off: 0 ± 0 (.008g), 0 ± 0 (0.02g), 0 ± 0 (0.04g), 1.0 ± 0.52 (0.07g), 4.33 ± 0.61 (0.16g), 6.50 ± 0.85 (0.40g), 9.67 ± 0.21 (0.60g), 10.0 ± 0 (1.0g); On: 0 ± 0 (.008g), 0 ± 0 (0.02g), 0 ± 0 (0.04g), 0.67 ± 0.49 (0.07g), 4.17 ± 0.54 (016g), 7.00 ± 0.89 (0.40g), 9.83 ± 0.17 (0.60g), 10.0 ± 0 (1.0g)) or the contralateral whisker pad (Off: 0 ± 0 (.008g), 0 ± 0 (0.02g), 0.50 ± 0.34 (0.04g), 2.50 ± 0.50 (0.07g), 4.67 ± 0.49 (0.16g), 8.0 ± 0.68 (0.40g), 10.0 ± 0 (0.60g), 10.0 ± 0 (1.0g); On: 0 ± 0 (.008g), 0 ± 0 (0.02g), 0.17 ± 0.17 (0.04g), 2.33 ± 0.80 (0.07g), 5.17 ± 0.17 (016g), 8.17 ± 0.79 (0.40g), 9.83 ± 0.17 (0.60g), 10.0 ± 0 (1.0g)) to the left CeA. (Ipsilateral and contralateral, ChR2, n=6 animals; two-way ANOVA; not significant P>0.05; F1,80=0.9205 (ipsi), F1,40=0.000 (contra)). c, Quantification of the optogenetics induced changes in withdrawal latency (sec) to dry ice (2.29 ± 0.33s (off-left), 6.86 ± 3.70s (on-left), 2.33 ± 0.25s (off-right), 5.81 ± 2.75s (on-right)) (ChR2, n=7 animals; one-way ANOVA; **P=0.0045, *P=0.0311; F3,24=6.241) and heat (6.61 ± 0.93s (off-left), 12.94 ± 1.89s (on-left), 6.09 ± 0.65s (off-right), 15.04 ± 1.80s (on-right)) (ChR2, n=7 animals; one-way ANOVA; ****P<0.0001; F3,24=59.93). d, Quantification of total licking and face wiping latency (sec) from left CeAGA neurons optogenetic activation after formalin injection during the second phase of inflammatory pain (134.33 ± 22.88s (paw licking-off), 10.33 ± 8.24s (paw licking-on), 151.67 ± 35.99s (face wiping-off), 12.00 ± 8.74s (face wiping-on)). (ChR2, n=6 animals; one-way ANOVA; ****P<0.0001; F3,20=59.54).
Extended Data Fig. 7
Extended Data Fig. 7. CeAGA activities are not correlated to the onsets of sensory stimuli.
Neuronal activity patterns during a, cold, b, heat, c, paw von Frey, and d, face von Frey tests sorted by neurons peak responses timing: from −10 to +10 sec, with 0 as the onset of stimulus application. Top of each heatmap, averaged population activity from 10 seconds before to 10 seconds after each stimulus onset. Thick lines indicated mean and shaded areas indicated s.e.m.
Extended Data Fig. 8
Extended Data Fig. 8. CeAGA neurons are distinct from pain-activated neurons in CeA and high magnification image of CeAGA neurons projection into the ipsilateral BLA.
a, CeAGA neurons have minimal co-localization with formalin-induced Fos+ cells. Formalin-activated cells primarily locate in the capsular division of CeA outside the lateral division where CeAGA locate. Insert i)-v), Example of five consecutive slices of the lateral division of CeA showing minimal co-localization with formalin-induced Fos+ cells with CeAGA neurons, and the quantification of fraction of co-colocalization between CANE-captured CeAGA cells and formalin-induced Fos+ cells (n=5 biologically independent samples for each condition) (0.78 ± 0.06 (Iso/Cane-Iso); 0.22 ± 0.04 (Form/Cane-Iso)).b. Coronal schematic next to example coronal slice of low magnification (high exposure) of CANE-GFP labeled CeAGA neurons and their axons with a box around the ipsilateral BLA. Insert i)-ii), High mag images show projections in ipsilateral BLA with top panel showing that isoflurane did not induce Fos+ cells, and bottom panel showing that formalin-pain induced robust Fos+ expression in BLA. (n=3 biologically independent samples).
Extended Data Fig. 9
Extended Data Fig. 9. Consistent axonal projections from CeAGA neurons.
In sequential order: a) frontal cortex, b) nucleus accumbens (NAc), c) striatum, d) insular, e) bed nucleus stria terminalis (BNST), f) intralaminar, g) temporal association cortex (TeA) and ectorhinal cortex (Ect), h) subthalamic nucelus (SubTh), i) periaqueductal grey (PAG), j) parabrachial nucleus (PBN), k) solitary tract (SolT), and l) reticular formation (RT). m) Quantification of the mean intensity value (artificial units) of the axonal projections from each region of interest (ROI) listed above (a-l) (n=3 biologically independent samples) (59.40 ± 15.68 (FC), 74.38 ± 14.18 (NAc), 46.59 ± 3.21 (Striatum), 81.07 ± 8.86 (Ins), 112.09 ± 10.85 (BNST), 106.15 ± 15.69 (Intra), 115.35 ± 34.52 (TeA/Ect), 82.99 ± 11.06 (SubTh), 66.32 ± 9.84 (PAG), 116.29 ± 22.67 (PBN), 92.70 ± 6.27 (SolT), 53.26 ± 3.63 (RT)).
Extended Data Fig. 10
Extended Data Fig. 10. CeAGA neurons are also activated by low dose anesthetics.
a, Heatmaps, activity patterns of the same neurons tracked in isoflurane (1.5%) and low isoflurane (0.5%) experiments, aligned by isoflurane (1.5%) neural patterns. 106 tracked same neurons from 5 mice × 1 trial. b, Left, mean and difference traces of the population normalized activity in isoflurane and low isoflurane experiments. Right, intensity distribution of the traces. c, Heatmaps, activity patterns of the neurons tracked in isoflurane (1.5%), ketamine (100mg/kg) and low ketamine (12mg/kg) experiments, aligned by isoflurane neural patterns. 69 tracked same neurons from 5 mice × 1 trial. d, Left, mean trace of the population normalized activity in isoflurane, ketamine and low ketamine experiments. Right, intensity distribution of the traces.
Figure 1 |
Figure 1 |. Ensembles of neurons in the central amygdala (CeA) are activated by general anesthesia (GA).
a, Representative images of Fos+ neurons in the CeA from exposure to oxygen control, isoflurane, saline control, and ketamine/xylazine injection. Repeated experiments for n=3 biologically independent samples. b, Schematic of CANE capturing of Fos+ CeAGA neurons followed by a second exposure to isoflurane GA to re-induce Fos. c, Representative images of three-color hybridization chain reaction experiments examining the expression of enkephalin (Penk1) and protein kinase C-delta (Pkc-d) with Fos+ CeAGA neurons (induced by isoflurane). Bregma, −0.94 mm to −1.34 mm. Repeated experiments for n=3 biologically independent samples. d, Six sequential coronal brain sections from one representative mouse containing bilateral CeAGA captured neurons (CANEISO-GFP). Repeated experiments for n=5 biologically independent samples. e, Representative image of captured CeAGA neurons (green – GFP) from first isoflurane exposure, Fos+ activation from second isoflurane exposure (red) and their merged image showing colocalization (orange cells). Repeated experiments for n=5 biologically independent samples. f, (i-ii), Percentage of Penk1 and Pkc-d overlap over Fos+ CeAGA neurons, and (iii) Fos+ CeAGA neurons over total Pkc-d neurons (n=3 biologically independent samples). g, Representative images of CANEGFP captured CeAGA neurons versus Fos+ neurons in the CeA induced by ketamine/xylazine and dexmedetomidine. Repeated experiments for n=4 biologically independent samples. h, Quantification of the fraction of Fos+ neurons induced by isoflurane (0.776 ± 0.065), ketamine/xylazine (0.390 ± 0.051), and dexmedetomidine (0.505 ± 0.036) over the total Fos+ CeAGA neurons (induced by isoflurane) and CANEISO-GFP over isoflurane-induced Fos+ neurons (0.780 ± 0.132) (n=4 biologically independent samples). i, Quantification of averaged Fos+ CeAGA neurons in the left (486.33 ± 77.31) and right CeA (527 ± 65.82) and their respective average particle size (321.62 ± 23.26 left, 321.86 ± 35.75 right) (n=3 biologically independent samples). Numbers represent the sum of cell counts from six serial 80µm sections containing CeA (but only a single focal plane (6µm) per section was counted).
Figure 2 |
Figure 2 |. Activity patterns of CANEISO-GCaMP6m captured CeAGA neurons during isoflurane and ketamine GA.
a, Calcium imaging recording of CANEISO-GCaMP6m captured CeAGA neurons during isoflurane or ketamine induced general anesthesia (GA). b, Left, an example frame from the raw calcium imaging video. Middle, extracted regions of interest (ROIs) footprints superimposed on the max intensity projection. Right, normalized calcium fluorescence traces of the neurons during isoflurane induced GA. Norm. Intensity, normalized calcium signals were rescaled to 0–1. c, Activity patterns of CANEISO-GCaMP6m captured CeAGA neurons sorted by the ratio of individual neuron’s mean activity during isoflurane exposure (0 – 20 min) to its baseline activity (awake state, −4 – 0 min). Cyan and yellow rectangle indicates iso.- active, and iso.-suppressed neurons separately. Top panel, the average fluorescence traces of each group of neurons. Right panel, distribution of contributions to the sustained activity from each group of neurons. Green dash rectangle indicates a subgroup of iso.-active neurons remaining activated under anesthesia. d, Two subpopulations of iso.-active neurons sorted by the ratio of individual neuron’s mean activity during the last 10 minutes (10 – 20 min) of isoflurane exposure to its first 10 minutes (0 – 10 min). Red and orange rectangle indicates isoflurane-sustained and isoflurane-transient neurons separately. e, Activity patterns of CANEISO-GCaMP6m captured CeAGA neurons in responses to ketamine sorted by the ratio of individual neuron’s mean activity after ketamine injection to its baseline activity. Cyan and yellow rectangle indicates ketamine-active, and ketamine-suppressed neurons, respectively. f, Two subpopulations of ketamine-active neurons sorted by the ratio of individual neuron’s mean activity during the last 10 minutes of ketamine to its first 10 minutes. Red and orange rectangle indicates ketamine-sustained and ketamine-transient neurons separately. Arrows, time when isoflurane or ketamine was administered. g, Calcium activity of CANEISO-GCaMP6m captured CeAGA neurons tracked across isoflurane and ketamine sessions (9 mice × 1trial). Neurons are aligned by the sustained activity from isoflurane GA. h, Left, summary of overlap using effectiveness corrected measurement based on d and f. Green, total number of same-cell tracked neurons across sessions (N=160). Yellow, Iso.–active neurons. Orange, Ket.–active neurons. Right, the percentage of neurons activated by both ketamine and isoflurane among all Iso.–active neurons, calculated using four methods based on the ratios between the post- and pre-stimulus activity. Green, effective time; Cyan, effective mean versus mean activity; Yellow, mean activity; Orange, effective mean activity.
Figure 3 |
Figure 3 |. Activation or inhibition of CeAGA neurons bi-directionally modulated pain-related behaviors in naïve mice and acute pain models.
a, Schematic of the responses to von Frey filaments applied to the whisker pad, including head withdraw and face wiping. b, Quantification of optogenetic manipulation of CeAGA neurons induced changes in the withdrawal frequency to 8 different von Frey filaments in the contralateral and ipsilateral whisker pad (to the right CeA). (Ipsilateral, control, n=7 animals (0 ± 0 (.008g), 0 ±0 (.02g), 0 ± 0 (.04g), 0 ± 0 (.07g), 0.29 ± 0.57 (.16g), 0.14 ± 0.26 (.40g), −0.29 ± 0.29 (.60g), −0.29 ± 0.18 (1.0g)), ChR2, n=8 animals (0 ± 0 (.008g), 0 ± 0 (.02g),0 ± 0 (.04g), −0.5 ± 0.38 (.07g), −4.13 ± 0.85 (.16g), −6.13 ± 0.79 (.40g), −6.0 ± 0.42 (.60g), −1.13 ± 0.64 (1.0g)), eArch, n=7 animals 0.57 ± 0.57 (.008g), 1.29 ± 0.52 (.02g), 1.71 ± 1.04 (.04g), 2.71 ± 0.84 (.07g), 3.14 ± 0.46 (.16g), 1.29 ± 0.7 (.40g), 0.57 ± 0.43 (.60g), 0.43 ± 0.43 (1.0g)); two-way ANOVA; ****P<0.0001, ***P<0.001, and *P<0.05; Contralateral, control, n=7 animals (0 ± 0 (.008g), 0 ± 0 (.02g), 0 ± 0 (.04g), 0 ± 0 (.07g), 0.29 ± 0.57 (.16g), 0 ± 0.22 (.40g), −0.43 ± 0.30 (.60g), 0.29 ± 0.29 (1.0g)), ChR2, n=8 animals (0 ± 0 (.008g), 0 ± 0 (.02g), 0 ± 0 (.04g), −0.63 ± 042 (.07g), −3.13 ± 0.44 (.16g), −4.25 ± 0.62 (.40g), −5.38 ± 0.98 (.60g), −1.63 ± 0.63 (1.0g)), eArch, n=7 animals (0 ± 0 (.008g), 0.57 ± 0.30 (.02g), 0.86 ± 0.63 (.04g), 1.0 ± 0.58 (.07g), 2.43 ± 1.0 (.16g), 1.43 ± 0.72 (.40g), 0.57 ± 0.30 (.60g), 0.29 ± 0.29 (1.0g)); two-way ANOVA; ****P<0.0001, **P<0.01, and *P<0.05; F14,152=11.40 (ipsi) F14,152=8.680 (contra). c, Optogenetic manipulation of CeAGA induced changes in the withdrawal threshold in response to electronic von Frey applied to the paw (control, n=7 animals (0.07 ± 0.33g (ipsi), 0.21 ± 0.35g (contra)), ChR2, n=8 animals (3.12 ± 0.49g (ipsi), 3.23 ± 0.47g (contra)), eArch, n=7 animals (−2.09 ± 0.46g (ipsi), −0.86 ± 0.53g (contra)); two-way ANOVA; ****P<0.0001, **P<0.01; F2,38=49.51). Data are mean ± s.e.m.. d and e, Quantification of the optogenetics induced change in withdrawal latency (t2-t1) for Hargreaves heat (control, n=7 animals (0.42 ± 0.47s (ipsi), −0.67 ± 0.54s (contra)), ChR2, n=8 animals (7.0 ± 1.19s (ipsi), 3.28 ± 0.64s (contra)), eArch, n=6 animals (−4.76 ± 1.02s (ipsi), −4.33 ± 1.29s (contra)); two-way ANOVA; ****P<0.0001, **P<0.01, and *P<0.05; F2,36=57.56) and Cold dry ice test (control, n=8 animals (0.04 ± 0.10s (ipsi), −0.51 ± 0.38s (contra)), ChR2, n=7 animals (3.29 ± 0.48s (ipsi), 4.76 ± 0.88 (contra)), eArch, n=7 animals (−1.62 ± 0.22s (ipsi), −0.81 ± 0.35s (contra)); two-way ANOVA; ****P<0.0001, *P<0.05; F2,38=71.37). Data are mean ± s.e.m.. f, Example images of coping behaviors such as licking hind paw (top) or wiping whisker pad (bottom) to separate injections of formalin on different days. g, Quantification of self-caring behaviors (total licking duration (sec)) per 2-minute bins with off and on light stimulation. (Hind paw formalin injection, control, n=8 animals (0.51 ± 0.09 (off1), 0.31 ± 0.12 (on1), 0.34 ± 0.06 (off2), 0.31 ± 0.04 (on2), 0.33 ± 0.09 (off3), 0.22 ± 0.11 (on3), 0.28 ± 0.06 (off4), 0.19 ± 0.06 (on4), 0.24 ± 0.09 (off5), 0.19 ± 0.07 (on5), 0.21 ± 0.13 (off6), 0.19 ± 0.09 (on6)); ChR2, n=9 animals (0.31 ± 0.05 (off1), 0.01 ± 0.01 (on1), 0.34 ± 0.06 (off2), 0.01 ± 0 (on2), 0.35 ± 0.07 (off3), 0 ± 0 (on3), 0.22 ± 0.08 (off4), 0 ± 0 (on4), 0.15 ± 0.07 (off5), 0.01 ± 0.01 (on5), 0.08 ± 0.06 (off6), 0 ± 0 (on6)); eArch, n=7 animals (0.33 ± 0.07 (off1), 0.25 ± 0.05 (on1), 0.30 ± 0.03 (off2), 0.45 ± 0.06 (on2), 0.31 ± 0.06 (off3), 0.25 ± 0.06 (on3), 0.47 ± 0.05 (off4), 0.48 ± 0.07 (on4), 0.13 ± 0.04 (off5), 0.20 ± 0.08 (on5), 0.20 ± 0.07 (off6), 0.14 ± 0.07 (on6)); two-way repeated measure ANOVA; **P<0.01, ••P<0.01 and *P<0.05; F5,75=4.81; Whisker pad formalin injection, control, n=7 animals (0.46 ± 0.07 (off1), 0.22 ± 0.08 (on1), 0.25 ± 0.06 (off2), 0.44 ± 0.11 (on2), 0.33 ± 0.06 (off3), 0.27 ± 0.08 (on3)), ChR2, n=9 animals 7animals (0.48 ± 0.05 (off1), 0.01 ± 0.01 (on1), 0.41 ± 0.06 (off2), 0 ± 0 (on2), 0.38 ± 0.07 (off3), 0 ± 0 (on3)); two-way repeated measure ANOVA; ****P<0.0001, *P<0.05; F5,70=8.825). Data are mean ± s.e.m.. h, Quantification of total wiping and licking behaviors during the first phase after formalin injection comparing off and on stimulation (2 minute bins with off and on light stimulation, total 6 minutes of stimulation) (ChR2, n=6 animals (55.00 ± 21.56s (licking-off), 10.33 ± 8.6s5 (licking-on), 92.33 ± 17.84s (wiping-off), 11.00 ± 8.33s (wiping-on)); one-way ANOVA; ***P<0.001 and ****P<0.0001; F3,20=33.55). i, Example heat map of CPP/CPA experiment. j, Quantification of the percent of time (%) naïve mice spent on the stimulated side (control, n=8 animals (46.52 ± 0.80 (pre), 54.16 ± 2.45 (post), ChR2, n=8 animals (39.05 ± 2.70 (pre), 51.54 ± 3.20 (post), eArch, n=10 animals (61.16 ± 2.17 (pre), 34.39 ± 5.11 (post),; two-way repeated measure ANOVA; ****P<0.0001 and *P<0.05; F2,23=29.66). Data are mean ± s.e.m..
Figure 4 |
Figure 4 |. In vivo calcium imaging of CeAGA activities in sensory tests.
a, Scheme of nociceptive stimuli on the mice hind paws and facial pads. Red arrows, the onset of stimuli. Black arrows, the onset of withdrawal reflex responses. b, Diagram showing calcium imaging of CeAGA neurons during cold, heat, graded von Frey stimuli applied to the hind paws in freely moving mice, or von Frey stimuli applied to the whisker pads in head-fixed mice. c, Left, paw withdrawal latencies in response to dry ice (3.16 ± 0.36s) and heat stimuli (4.02 ± 0.26s) (n=6 animals). Middle, the percentage (%) of paw withdrawal in response to each filament of von Frey stimuli (n=4 animals (26.25 ± 3.17% (1g), 75.00 ± 2.08% (4g), 76.25 ± 2.43% (10g)). Right, the percentage of face wiping in response to each filament of von Frey stimuli (n=4 animals, 35.00 ± 8.42% (0.02g), 88.75 ± 5.54% (0.16g), 99.50 ± 1.71% (1.0g), 95.75 ± 5.31% (4.0g)). Data are mean ± s.e.m.. d, f, h and j, Neuronal activity patterns during d, cold stimuli, f, heat stimuli, h, von Frey stimuli to paws, and j, von Frey stimuli to facial pads sorted by neurons peak responses timing (from −10 to +10 sec, 0 is the onset of response, for those trials without response in the von Frey stimuli, 0 is the withdraw of von Frey filament). Top of each heatmap, averaged population activity. Thick lines indicated mean and shaded areas indicated s.e.m.. e, g, i and k, Three patterns of representative individual neuron responses plotted for all the trials to e, g, i and k sorted by neurons peak responses timing (from −10 to +10 sec). Mean response of each neuron was plotted on the top of each corresponding heatmap. l, Probability distribution (inset, cumulative probability distribution) of neural response differences between post- and pre-response to calcium signal intensity during the 4 sensory tests. m, Averaged calcium traces of individual neuron’s responses to noxious stimuli. Individual trial response was plotted in either black (unchanged neurons), blue (suppressed neurons) and yellow (activated neurons). n, Percentage of 3 response types of CeAGA neurons during 4 sensory tests.
Figure 5 |
Figure 5 |. Activation of CeAGA neurons strongly reduced nociception-related behaviors in chronic constriction injury model and drove CPP.
a, Schematic of the site of chronic constriction injury of the Infraorbital Nerve. b, Quantification of activating CeAGA induced changes in withdrawal frequency to 8 different von Frey filaments in the injured and non-injured side of the whisker pad after IoN-CCI. (Injured side, control, n=8 animals (0 ± 0 (.008g), −0.13 ± 0.13 (.02g), −0.13 ± 0.23 (.04g), −0.63 ± 0.38 (.07g), −0.50 ± 0.19 (.16g), 0.13 ± 0.30 (.40g), −0.13 ± 0.23 (.60g), 0.13 ± 0.13 (1.0g)); ChR2, n=7 animals (0 ± 0 (.008g), −1.14 ± 0.46 (.02g), −1.29 ± 0.52 (.04g), −2.00 ± 0.62 (.07g), −3.71 ± 0.71 (.16g), −5.57 ± 0.84 (.40g), −4.57 ± 0.65 (.60g), −4.00 ± 0.69 (1.0g)); two-way ANOVA; ****P<0.0001; F7,104=10.74; Un-Injured side, control, n=8 animals (0 ± 0 (.008g), −0.25 ± 0.16 (.02g), 0 ± 0.19 (.04g), −0.13 ± 0.35 (.07g), −0.88 ± 0.35 (.16g), 0 ± 0.27 (.40g), −0.13 ± 0.13 (.60g), −0.13 ± 0.13 (1.0g)); ChR2, n=7 animals (0 ± 0 (.008g), −1.29 ± 0.64 (.02g), −1.86 ± 0.67 (.04g), −2.57 ± 0.65 (.07g), −2.43 ± 0.78 (.16g), −3.14 ± 1.14 (.40g), −2.86 ± 0.94 (.60g), −0.57 ± 0.37 (1.0g)); two-way ANOVA; **P<0.01 (0.07g), ***P<0.001 (0.40g), **P<0.01 (0.60g) ; F7,104=2.393). Data are mean ± s.e.m.. c, Example heat map of CPP/CPA experiment. Control and ChR2 mice received stimulation on non-preferred side. d, Quantification of the percent (%) of time spent on the stimulated side after chronic constriction injury (control, n=7 animals (35.92 ± 4.38 (pre), 40.17 ± 6.09 (post), ChR2, n=12 animals (37.87 ± 2.76 (pre), 52.74 ± 4.48 (post); two-way ANOVA; **P<0.01, ns, P=0.80; F1,17=7.185). Data are mean ± s.e.m.. e, Quantification of percent (%) of time eliciting spontaneous wiping after chronic constriction injury before, during and after light stimulation (control, n=7, ChR2, n=7 animals; 7 minutes baseline no light (5.75 ± 1.07 (control), 3.79 ± 0.22 (ChR2), followed by 5 minutes of light-stimulation (5.61 ± 1.20 (control), 1.33 ± 0.42 (ChR2),, and another 7 minutes post-stimulation (5.37 ± 1.16 (control), 1.73 ± 0.46 (ChR2),; two-way repeated measures ANOVA; **P<0.01, *P<0.05; F1,12=11.98). Data are mean ± s.e.m..
Figure 6 |
Figure 6 |. Whole brain mapping of axonal projections from CeAGA neurons.
Top half: Coronal schematic next to example coronal slices. Boxes indicate the location of high-magnification zoomed in view of axonal projections. Bottom half: In sequential order: 1, cortex; 2a, nucleus accumbens (NAc) 2b, contralateral NAc; 3a, Insular, 3b, contralateral insular; 3c, striatum, 3d, contralateral striatum; 4, bed nucleus stria terminalis (BNST); 5, contralateral basal amygdala (BLA, top, anterior; bottom, posterior); 6, subthamalic nucleus (SubTh), 7a, posterior intralaminar nucleus of thalamus; 7b, contralateral temporal association cortex (TeA); 7c, TeA, ectorhinal cortex (Ect), perirhinal cortex (PRh), entorhinal cortex (Ent), posterior basal lateral amygdala (BLP), posterior cortical amygdala nucleus (PCoA); 8, posterior TeA, Ect, Ent, and midbrain reticular nucleus (RR); 9, periaqueductal grey (PAG); 10, parabrachial nucleus (PBN); 11, rostral reticular formation (RT); and 12, nucleus of solitary tract (SolT) and caudal intermediate reticular formation. Repeated experiments for n=5 biologically independent samples.
Figure 7 |
Figure 7 |. Activation of CeAGA neurons reduced formalin-induced activity to all CeAGA target regions and silencing CeAGA blocked the analgesic effect of low- dose ketamine.
a, c, Representative images of strong Fos+ expression induced by formalin. The regions shown here are all CeAGA targets revealed in Figure 6 including: frontal cortex, insular, striatum, ectorhinal (Ect) and temporal association cortex (TeA), basalateral amygdala (BLA), nucleus accumbens (NAc), intralaminar, periaqueductal grey (PAG), parabrachial nucleus (PBN), and intermediate reticular nucleus (iRT) and solitary tract (SolT). Note that the septohypothalamic nucleus (SHyp) do not receive projections from CeAGA neurons and serve as a negative control. b, d, Representative images of reduced Fos+ expression with ChR2 activation of CeAGA neurons (captured with CANE under isoflurane) after formalin injection in those same brain regions as a, c. Note that * signifies the CeAGA cells activated under ChR2. Fig. 7a-d were repeated for n=3 biologically independent samples. e, Quantification of averaged Fos+ cell count in areas that receive CeAGA neuron projections induced by formalin (a, c) or formalin plus ChR2 activation of CeAGA (b, d). Cell count represents the total number of cells from sections containing each of the regions but using only a single focal plane from each section for counting. (Formalin Fos, n=3 biologically independent samples; Formalin + CeAGA-ChR2 Fos, n=3 biologically independent samples; two-way ANOVA; ****P<0.0001 (FC, Ins, Intralaminar, PAG), ***P<0.001 (striatum), *P<0.05* (BLA, NAc, TeA/ECT, PBN, SolT, ns, P>0.999); F1,44=186.8). f, Quantification of total licking time (sec) in response to capsaicin injection into the paw with co-administration (i.p.) of saline or low-dose (12 mg/kg) ketamine with or without optogenetic silencing of CeAGA neurons that were captured with CANE under isoflurane (Saline +Capsaicin, n=5 animals (40.80 ± 24.1s); Ketamine +Capsaicin, n=4 animals (12.25 ± 6.94s); Ketamine +Capsaicin +Silencing, n=8 animals (34.75 ± 12.93s); one-way ANOVA with unpaired t-test, two-tailed; *P<0.05; F2,14=4.447).

Comment in

  • Anesthesia analgesia in the amygdala.
    McCall NM, Wojick JA, Corder G. McCall NM, et al. Nat Neurosci. 2020 Jul;23(7):783-785. doi: 10.1038/s41593-020-0645-3. Nat Neurosci. 2020. PMID: 32424288 Free PMC article.

References

    1. Aranake A et al. Increased risk of intraoperative awareness in patients with a history of awareness. Anesthesiology 119, 1275–1283 (2013). - PubMed
    1. Sebel PS et al. The incidence of awareness during anesthesia: a multicenter United States study. Anesth. Analg 99, 833–9, table of contents (2004). - PubMed
    1. Bergman SA Ketamine: review of its pharmacology and its use in pediatric anesthesia. Anesth Prog 46, 10–20 (1999). - PMC - PubMed
    1. Sadove MS, Shulman M, Hatano S & Fevold N Analgesic effects of ketamine administered in subdissociative doses. Anesth. Analg 50, 452–457 (1971). - PubMed
    1. Gorlin AW, Rosenfeld DM & Ramakrishna H Intravenous sub-anesthetic ketamine for perioperative analgesia. J Anaesthesiol Clin Pharmacol 32, 160–167 (2016). - PMC - PubMed

Methods-only References

    1. Venza M et al. The overriding of TRAIL resistance by the histone deacetylase inhibitor MS-275 involves c-myc up-regulation in cutaneous, uveal, and mucosal melanoma. Int. Immunopharmacol 28, 313–321 (2015). - PubMed
    1. Pang D et al. Polyphyllin II inhibits liver cancer cell proliferation, migration and invasion through downregulated cofilin activity and the AKT/NF-κB pathway. Biol. Open 9, (2020). - PMC - PubMed
    1. Faget L et al. Opponent control of behavioral reinforcement by inhibitory and excitatory projections from the ventral pallidum. Nat. Commun 9, 849 (2018). - PMC - PubMed
    1. Zamparo I et al. Axonal odorant receptors mediate axon targeting. Cell Rep 29, 4334–4348.e7 (2019). - PMC - PubMed
    1. Hara Y et al. Anti-tumor effects of an antagonistic mAb against the ASCT2 amino acid transporter on KRAS-mutated human colorectal cancer cells. Cancer Med 9, 302–312 (2020). - PMC - PubMed

Publication types

Substances