. 2020 Aug;5(8):1051-1063.
doi: 10.1038/s41564-020-0724-y. Epub 2020 May 18.

DNA methylation enzymes and PRC1 restrict B-cell Epstein-Barr virus oncoprotein expression

Affiliations

DNA methylation enzymes and PRC1 restrict B-cell Epstein-Barr virus oncoprotein expression

Rui Guo et al. Nat Microbiol. 2020 Aug.

Erratum in

Abstract

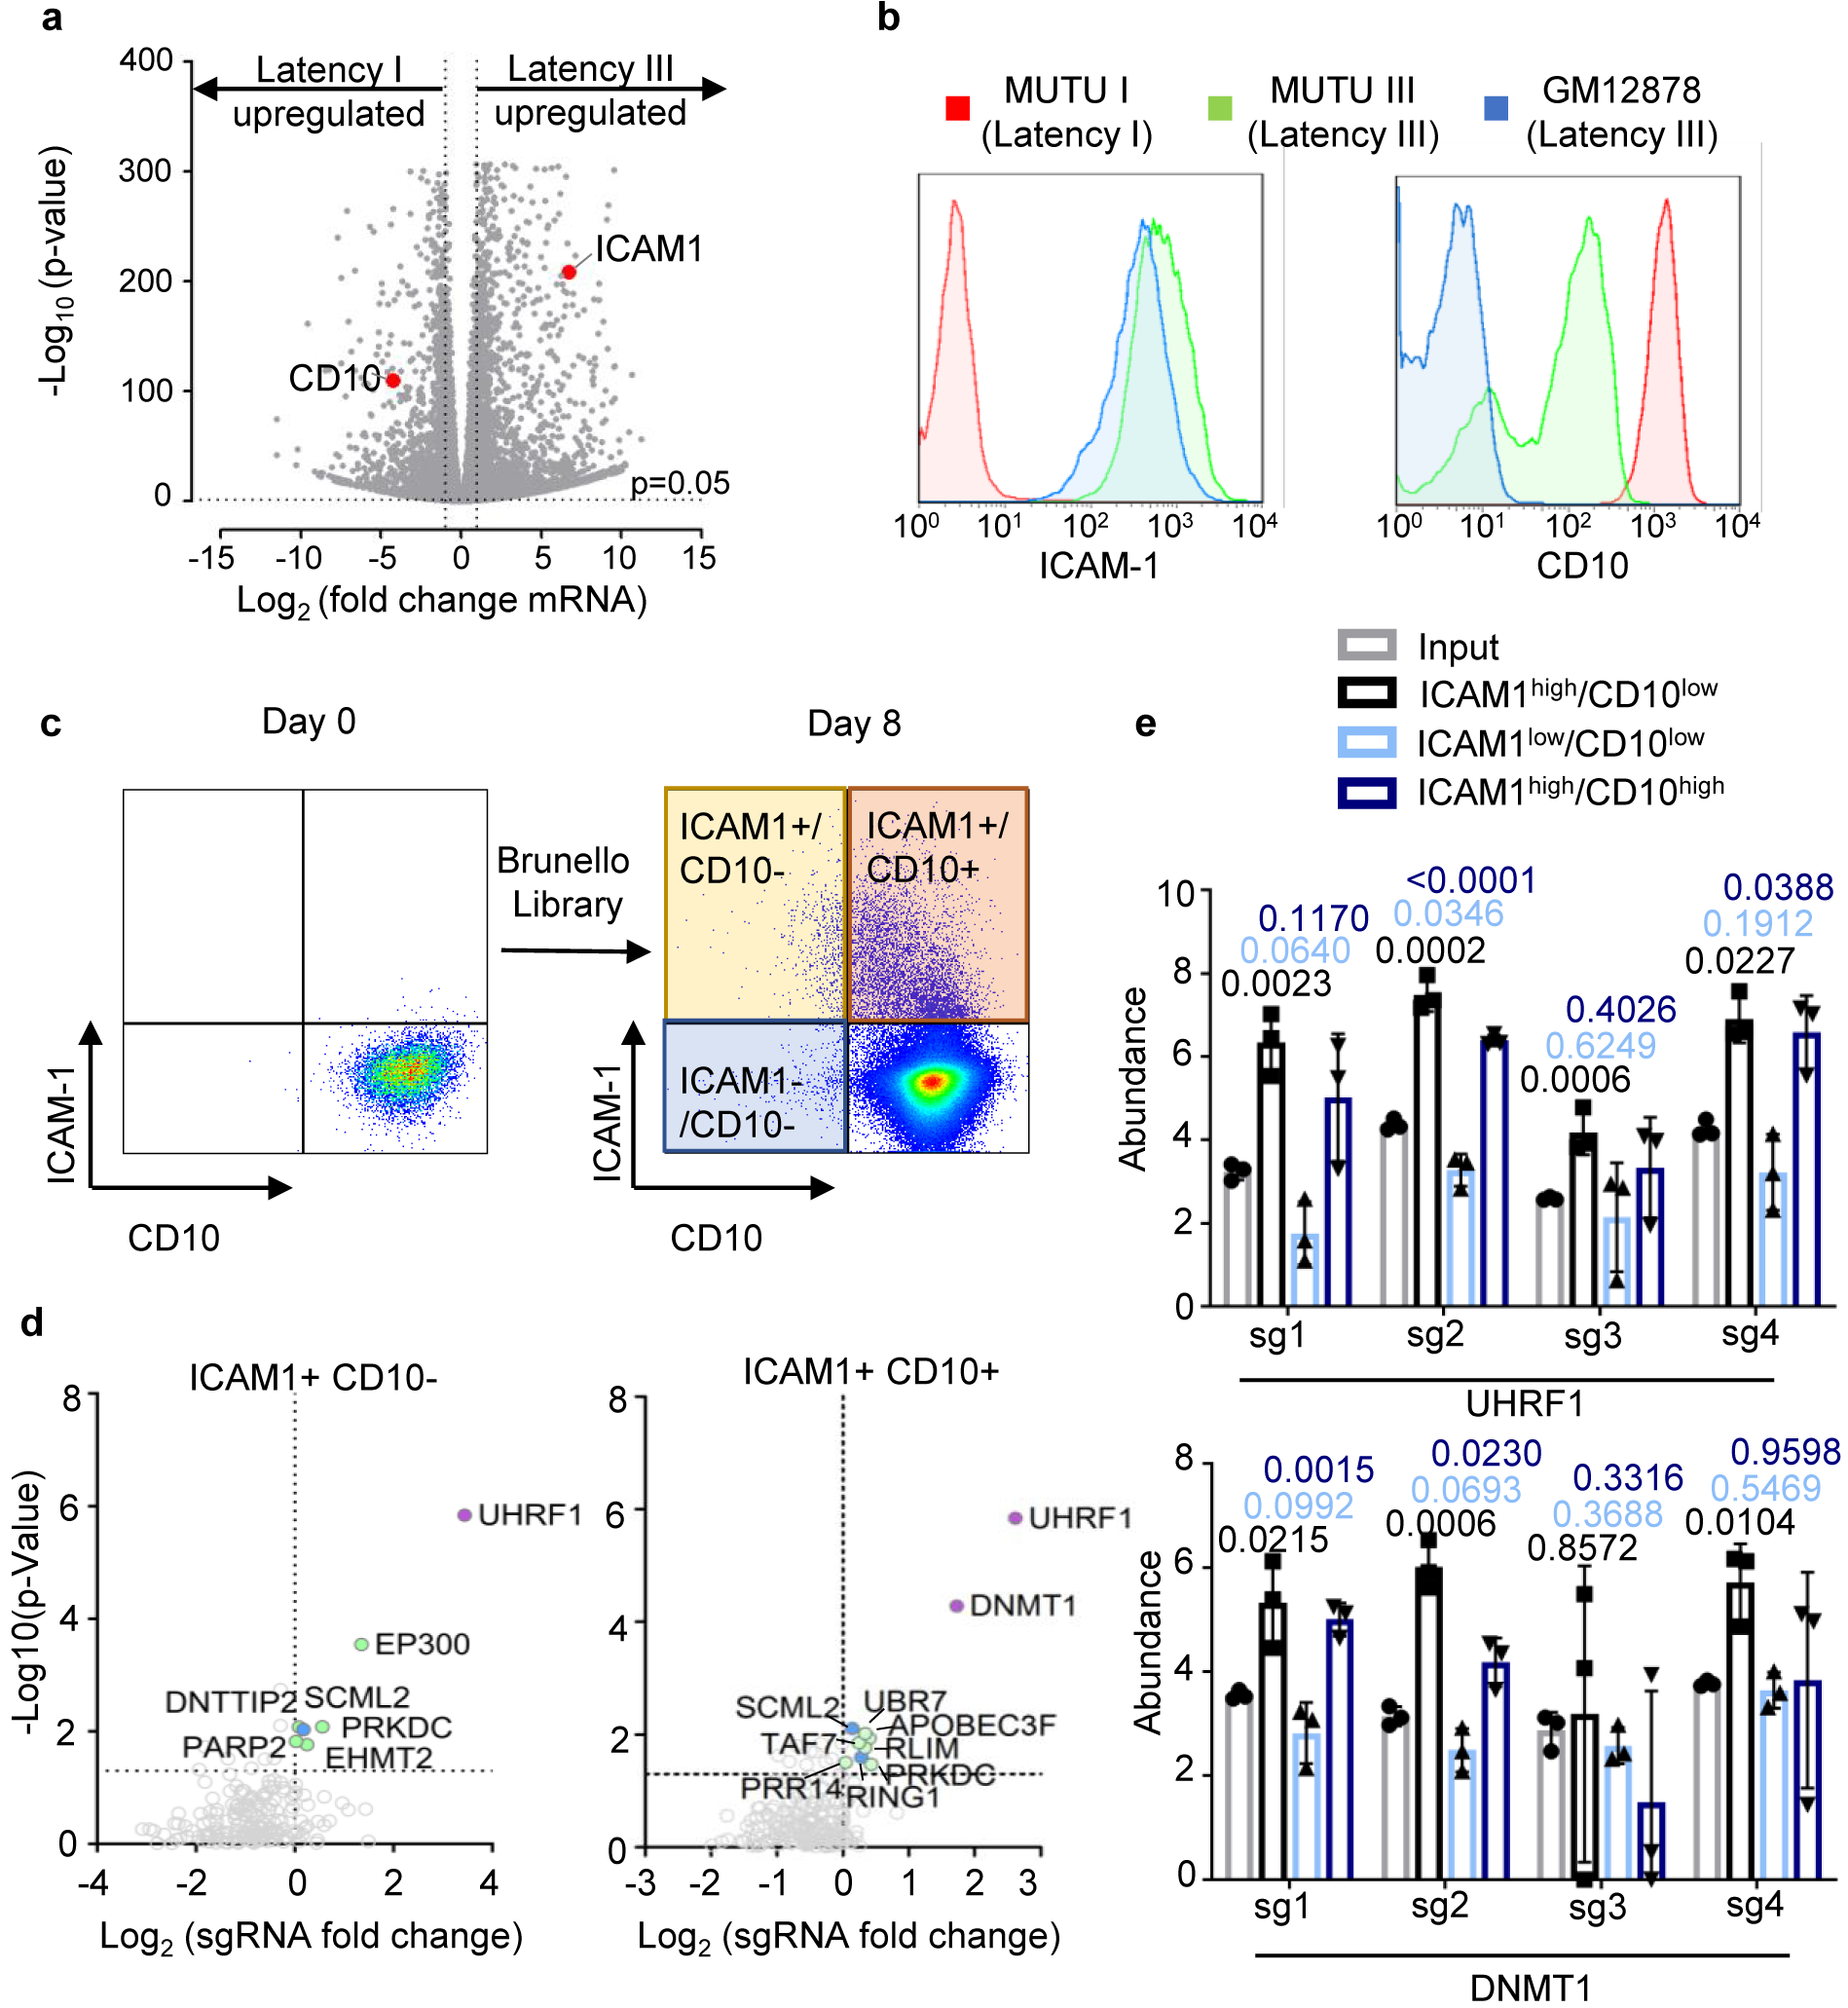
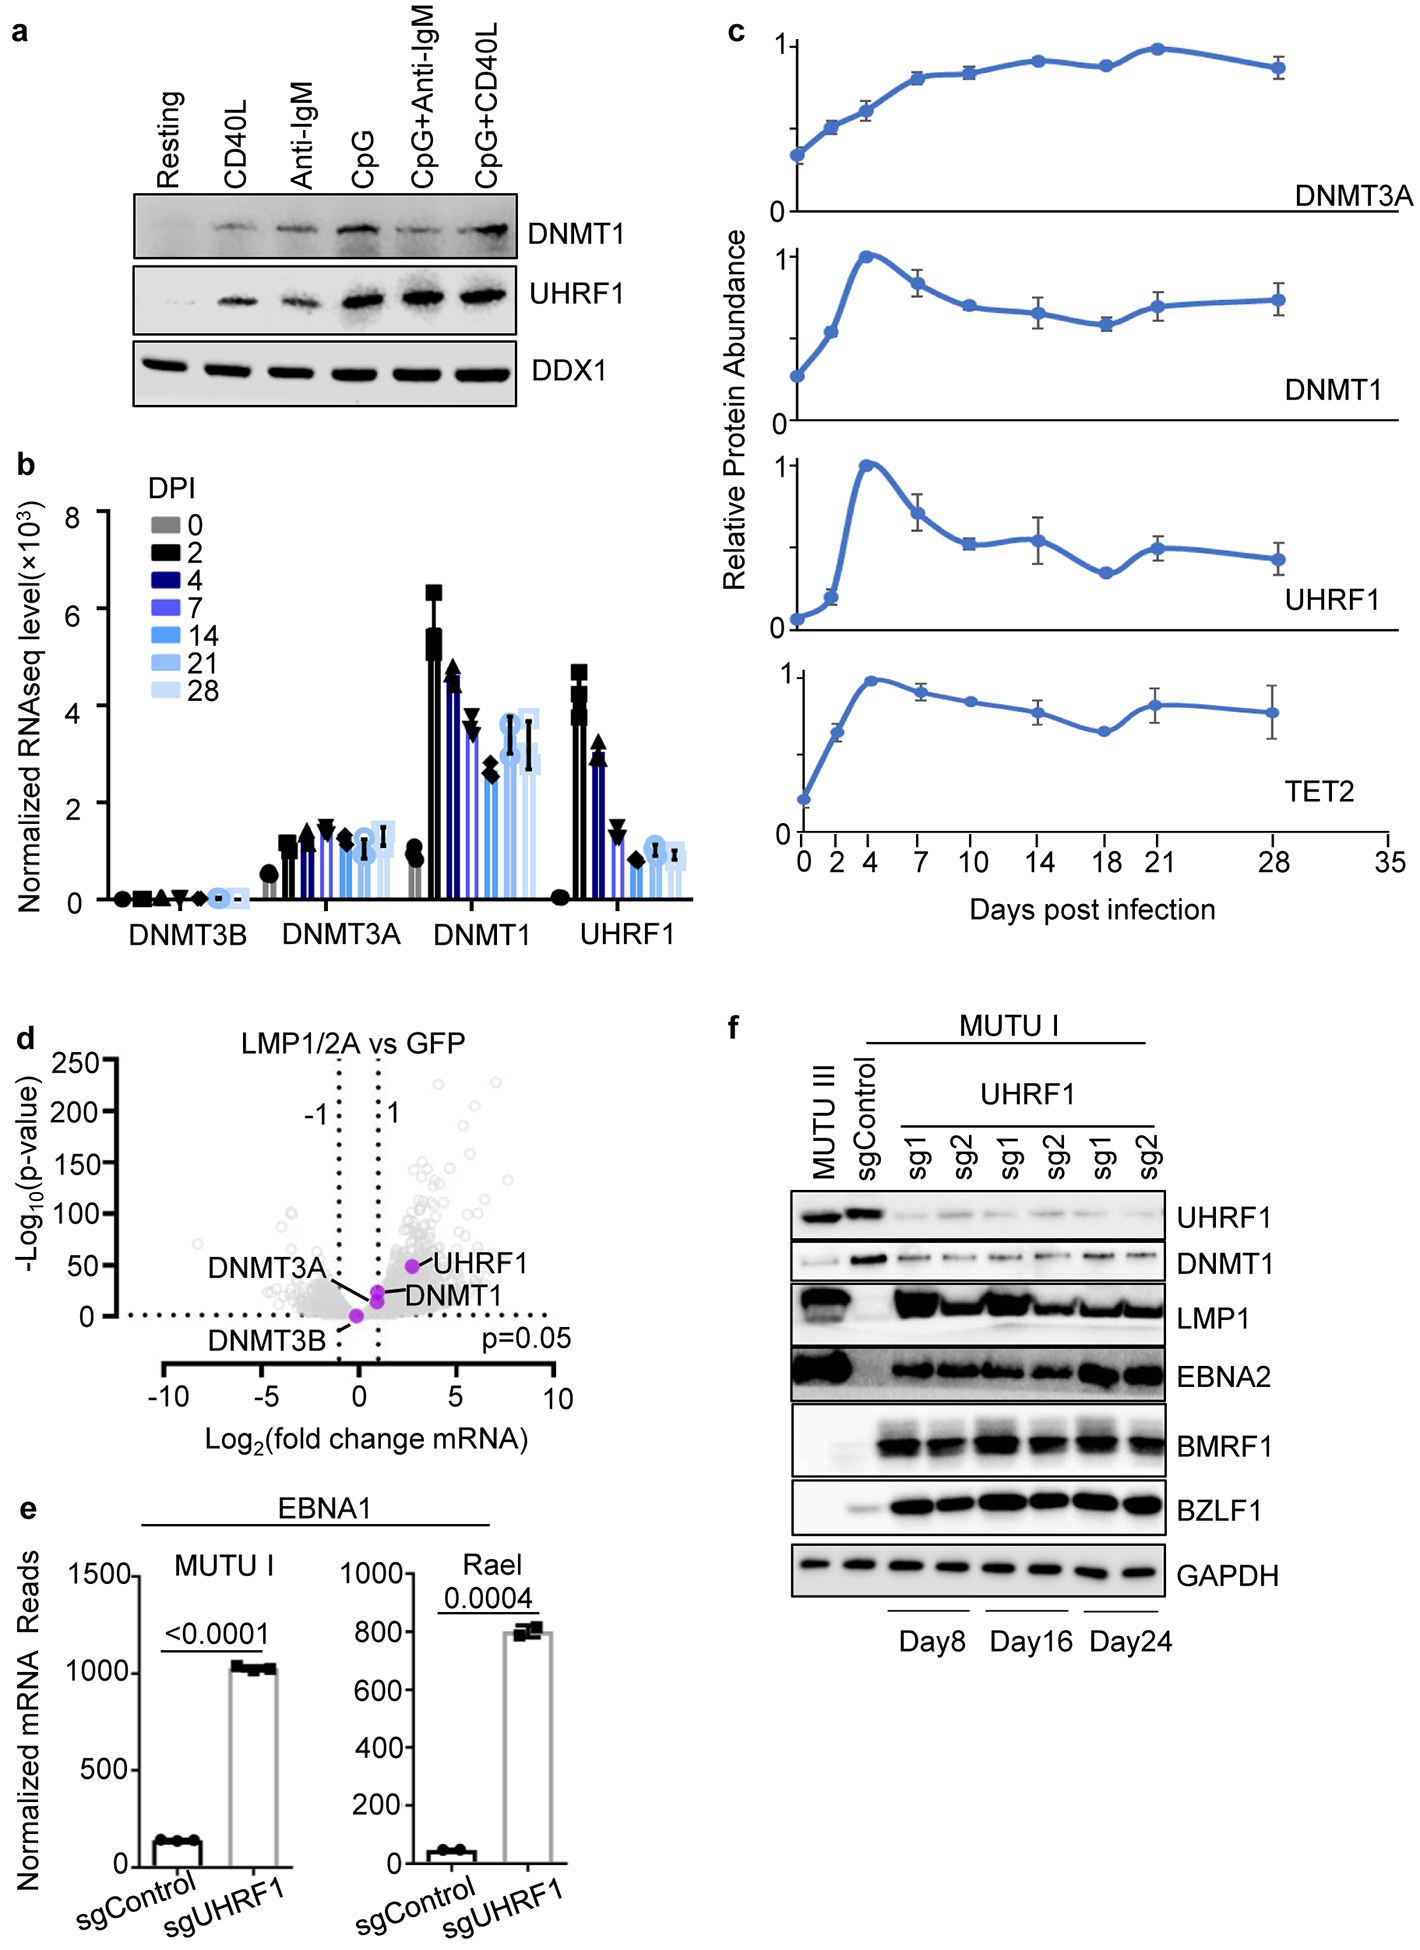
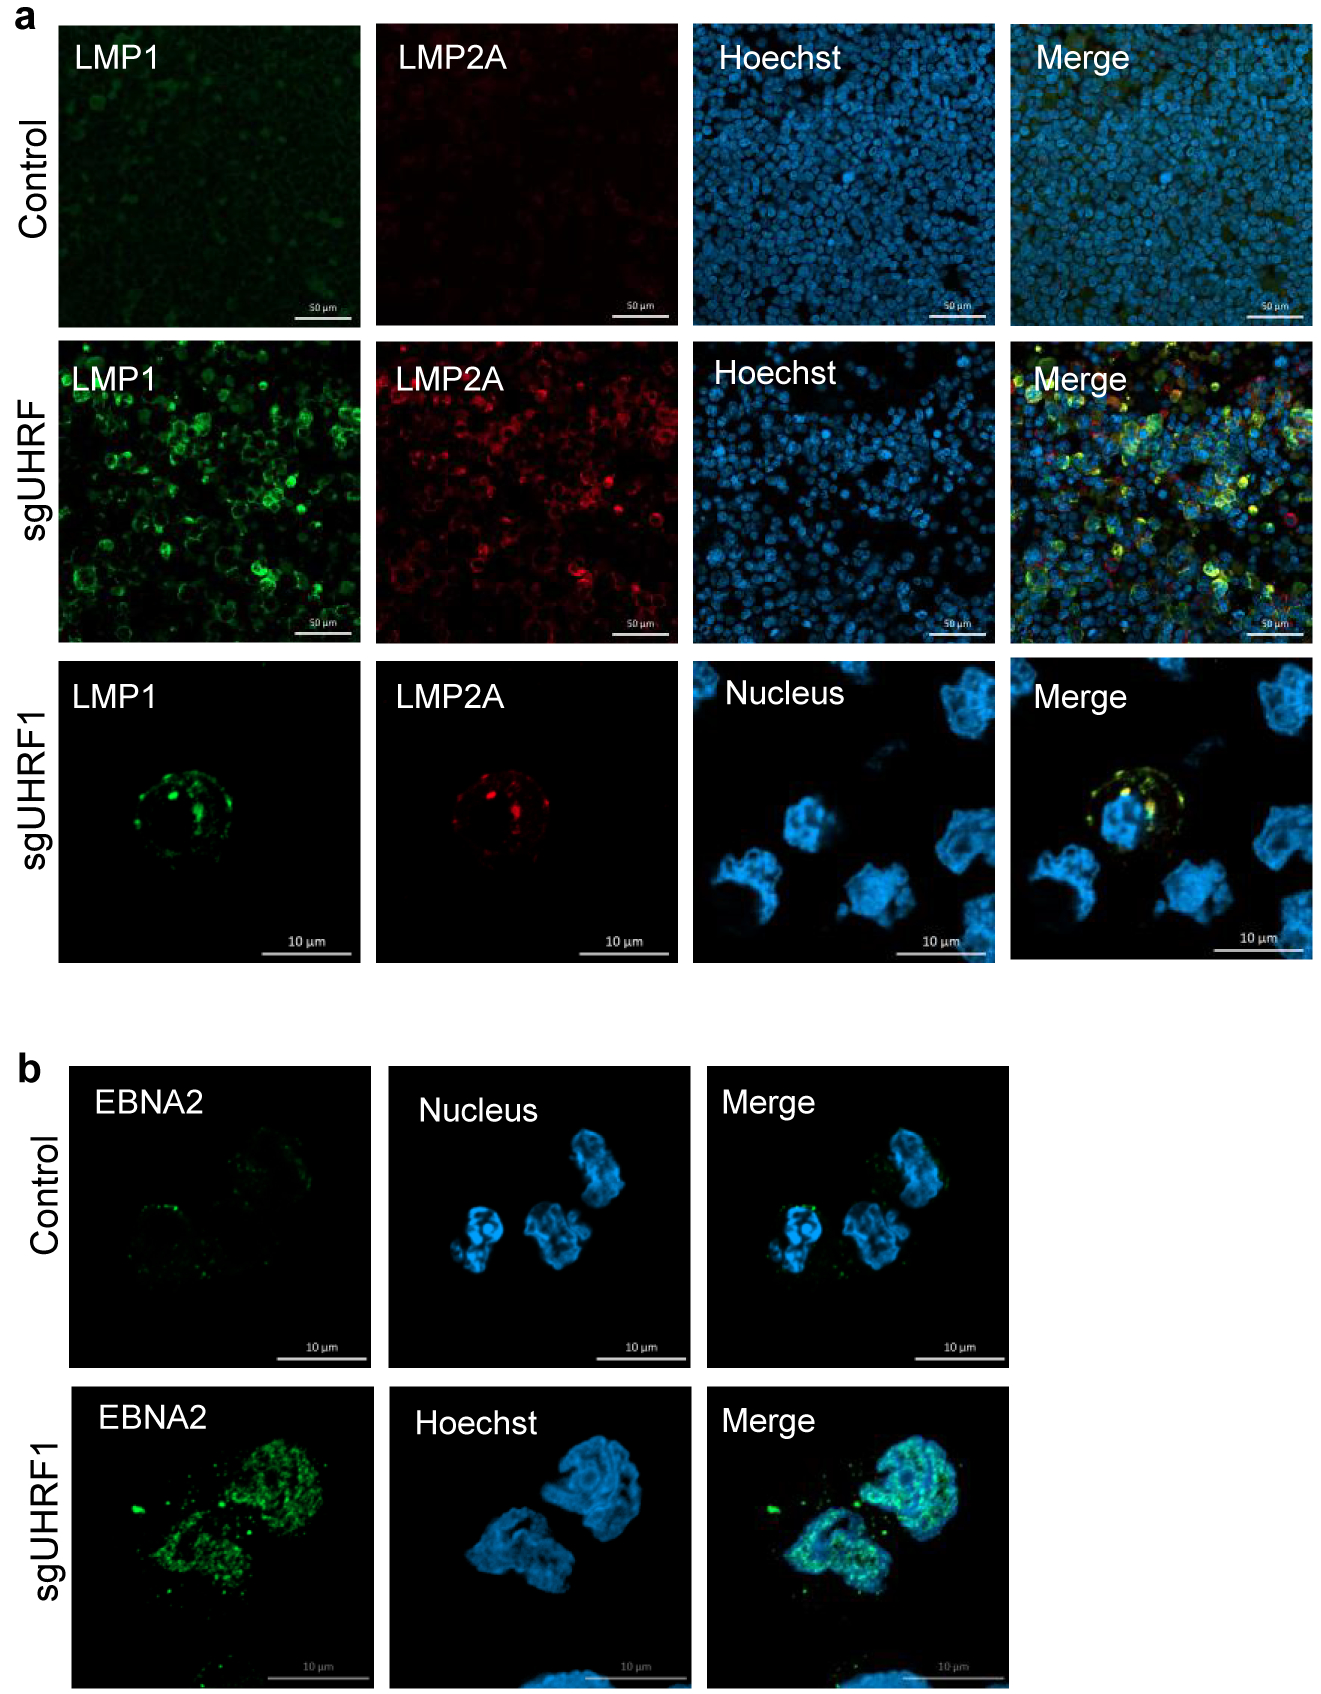
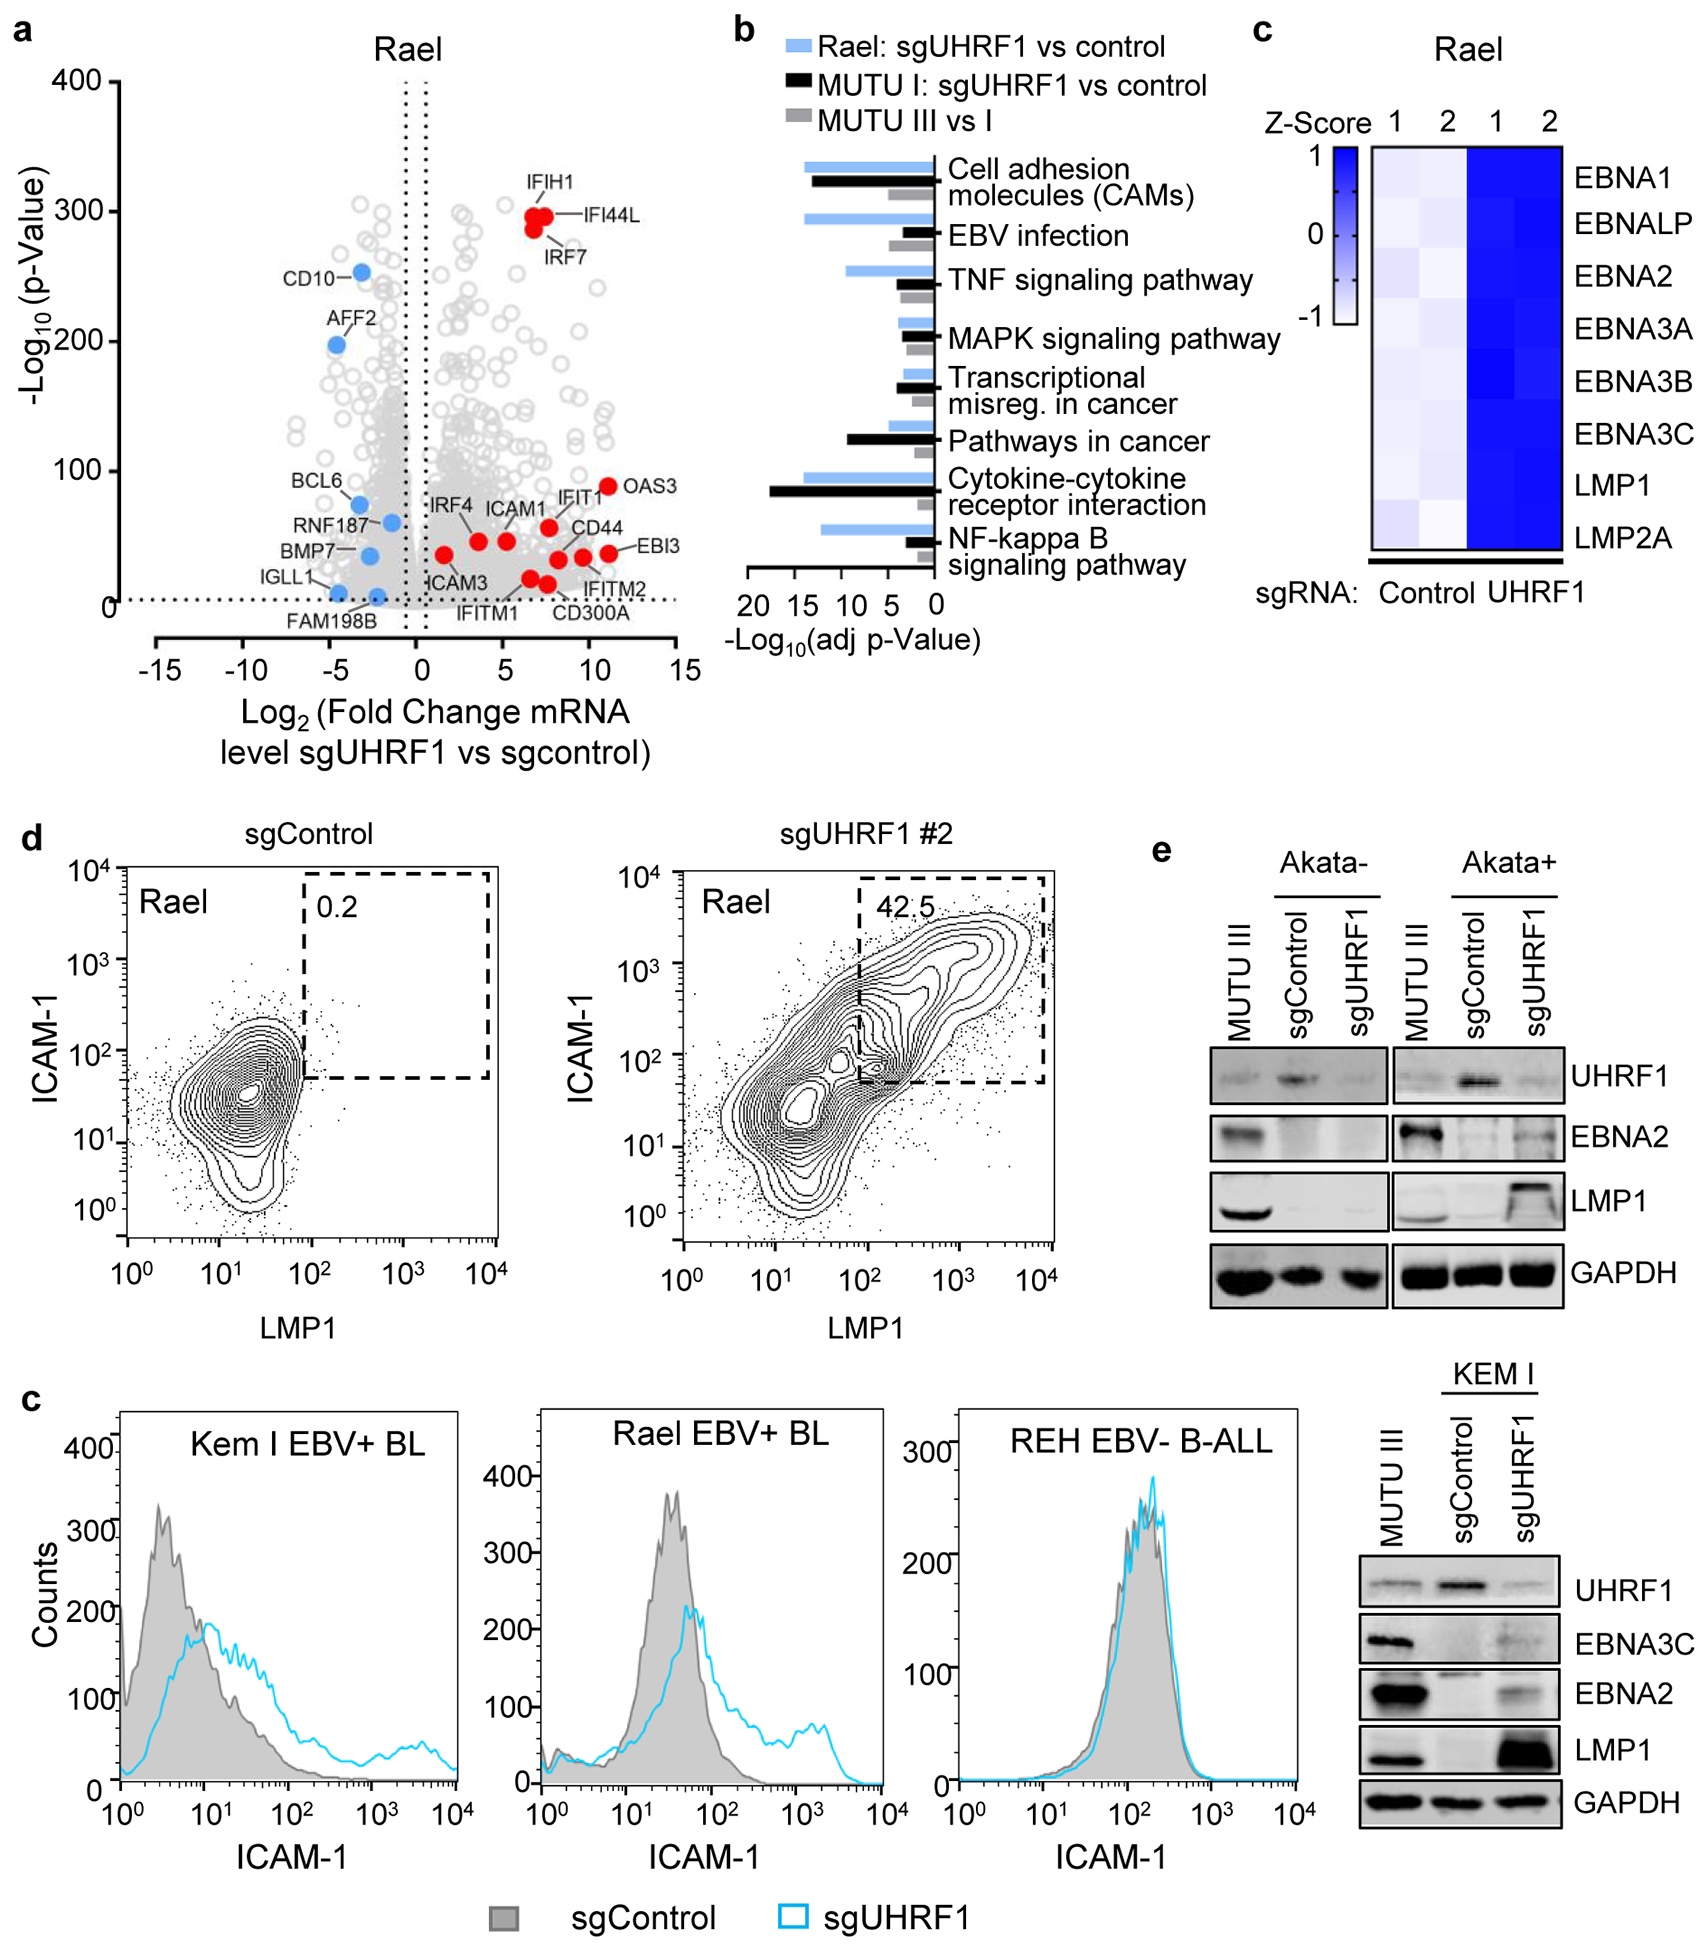
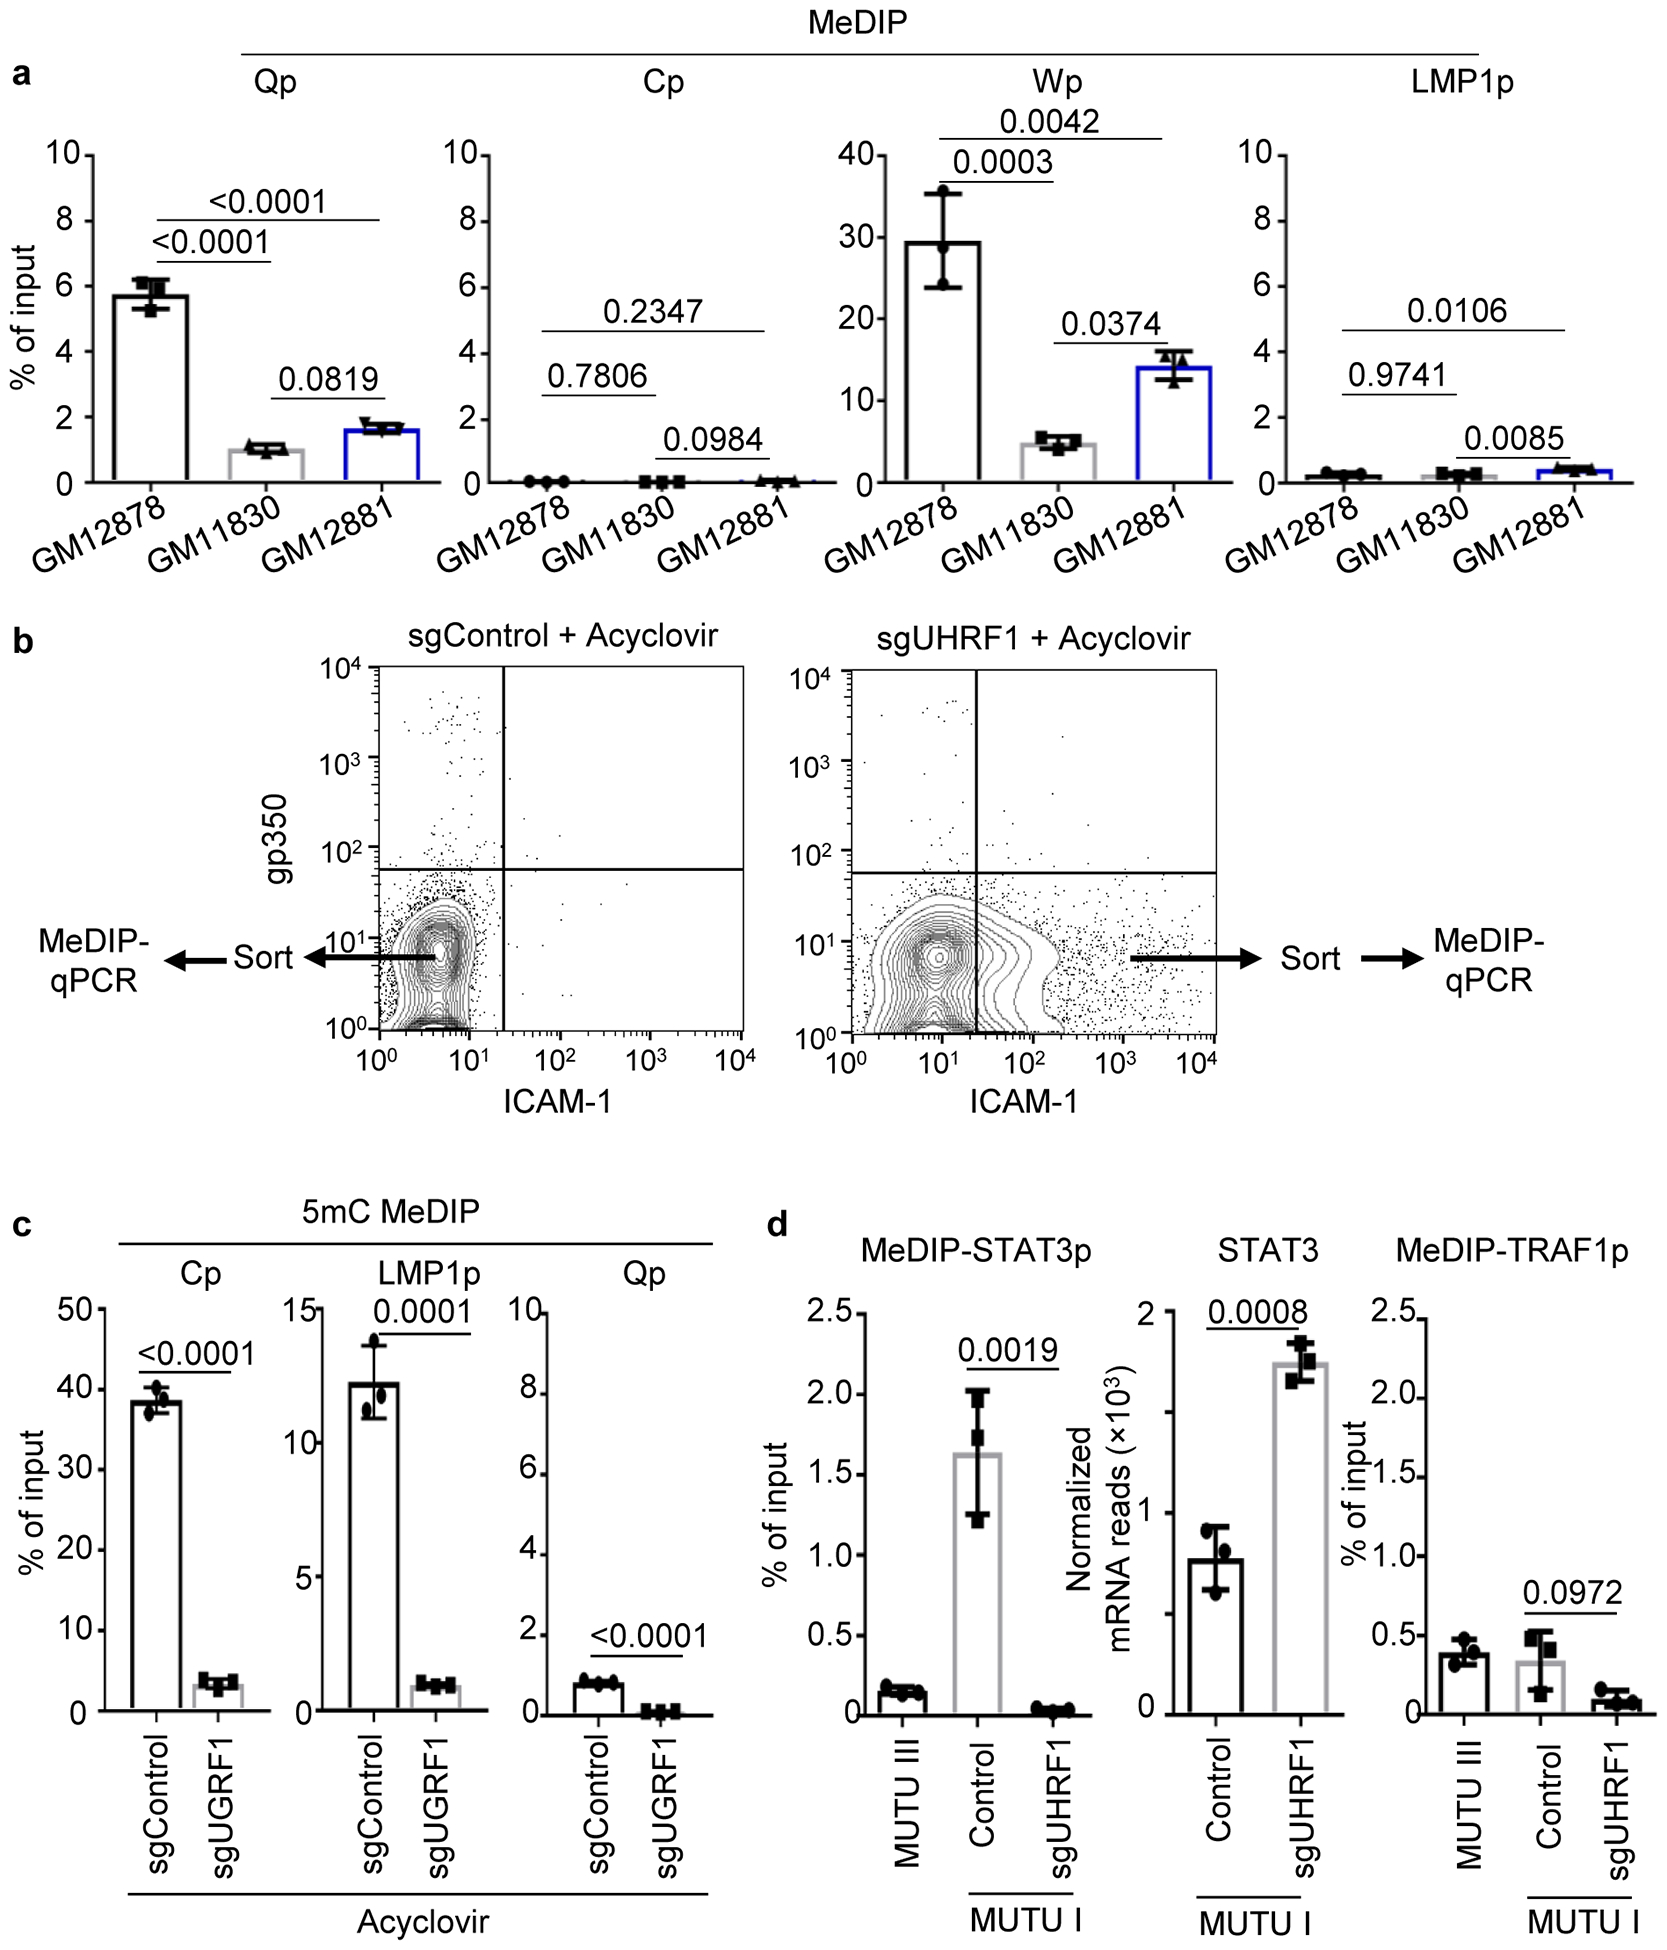
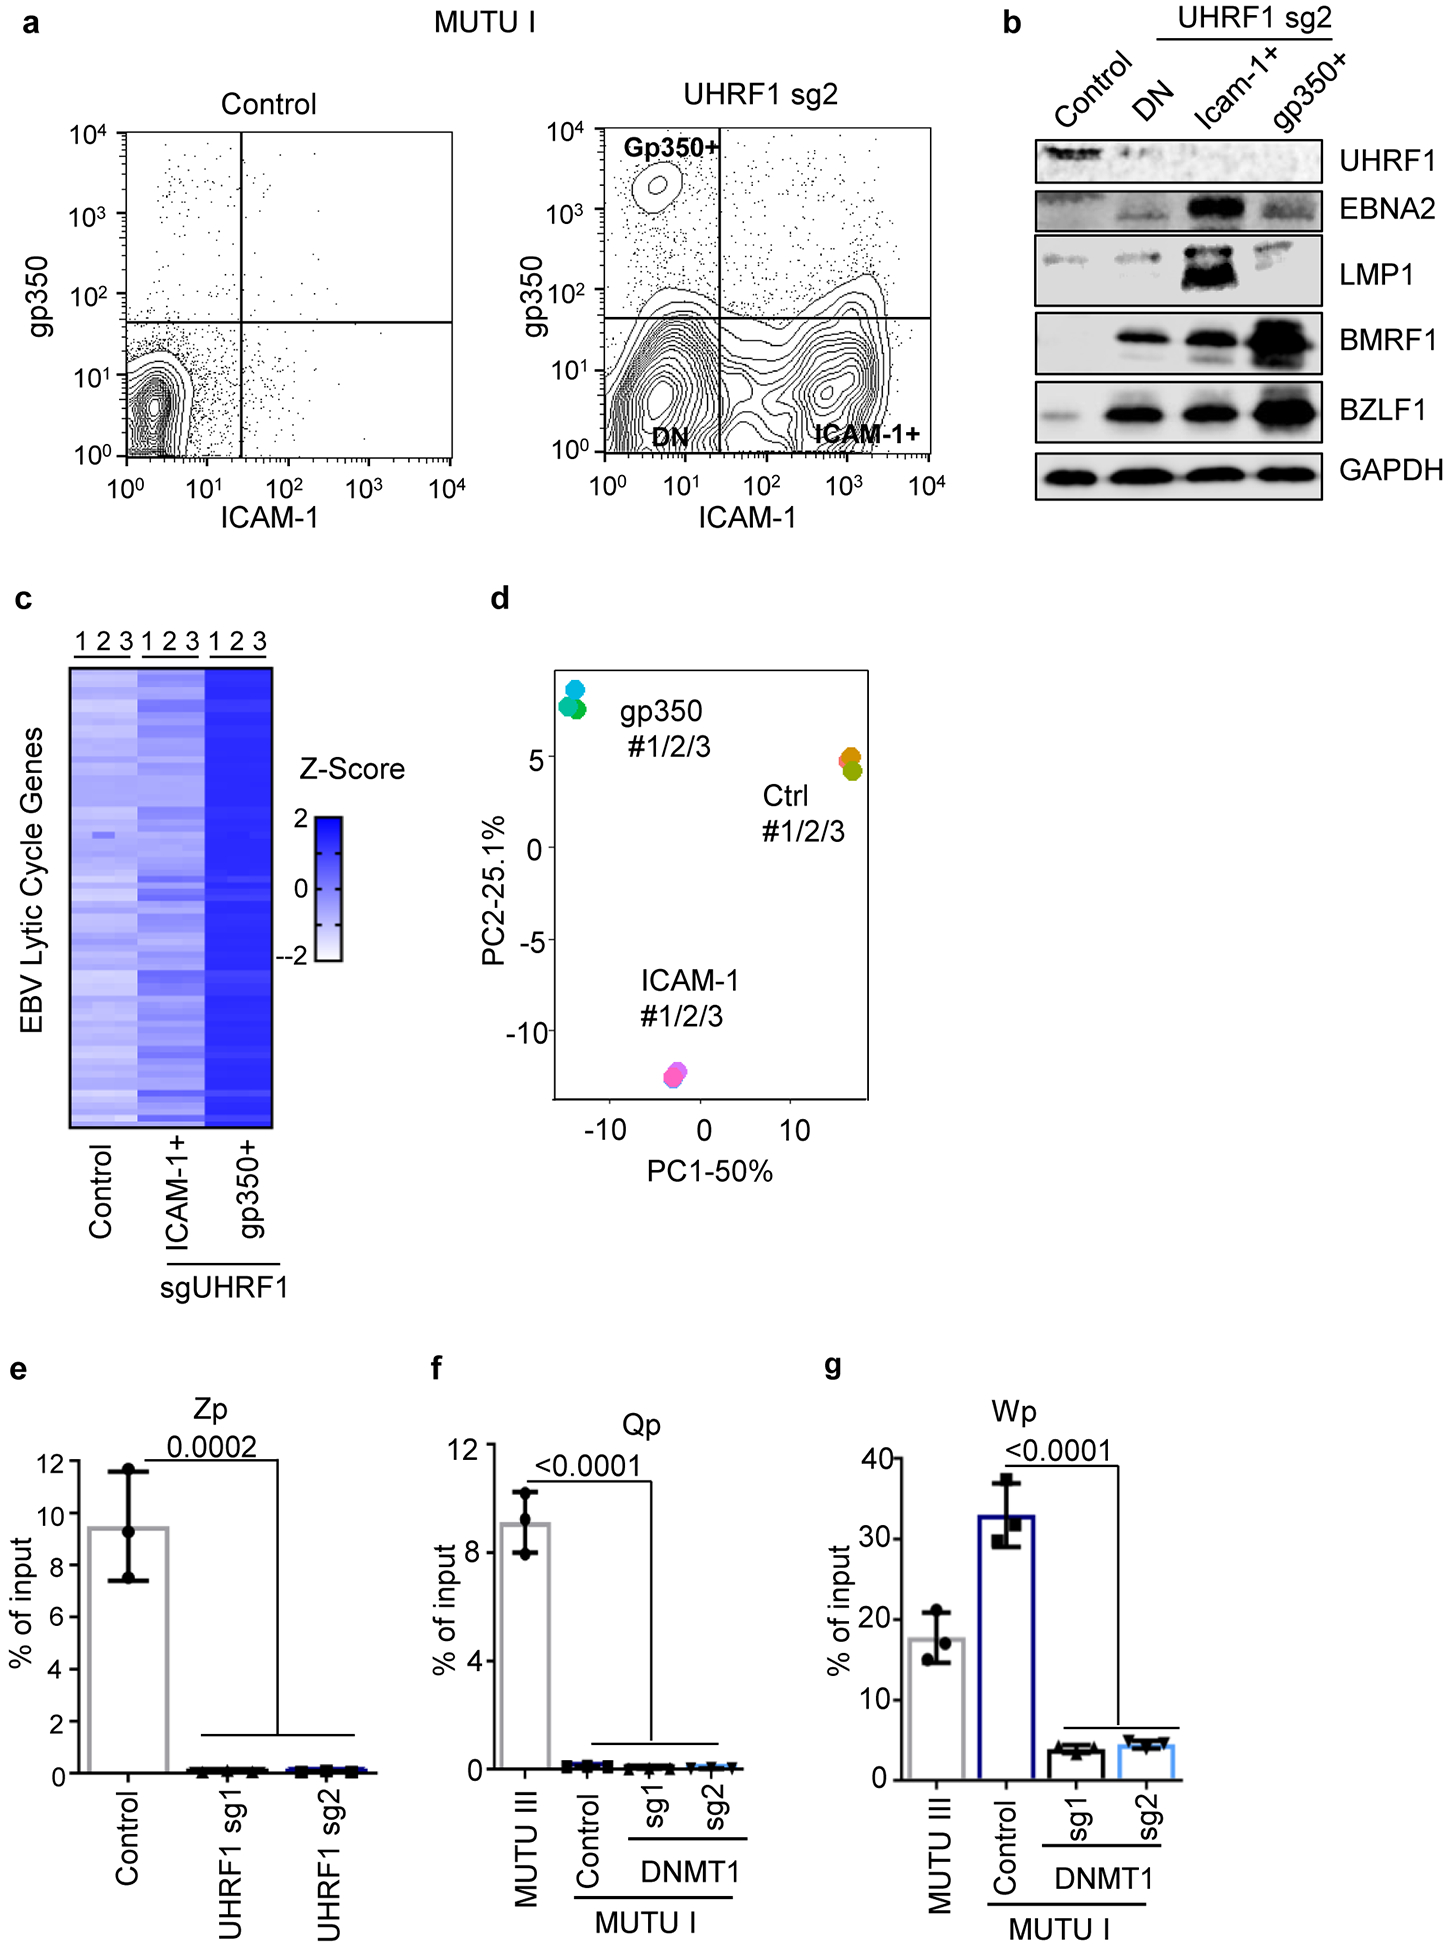
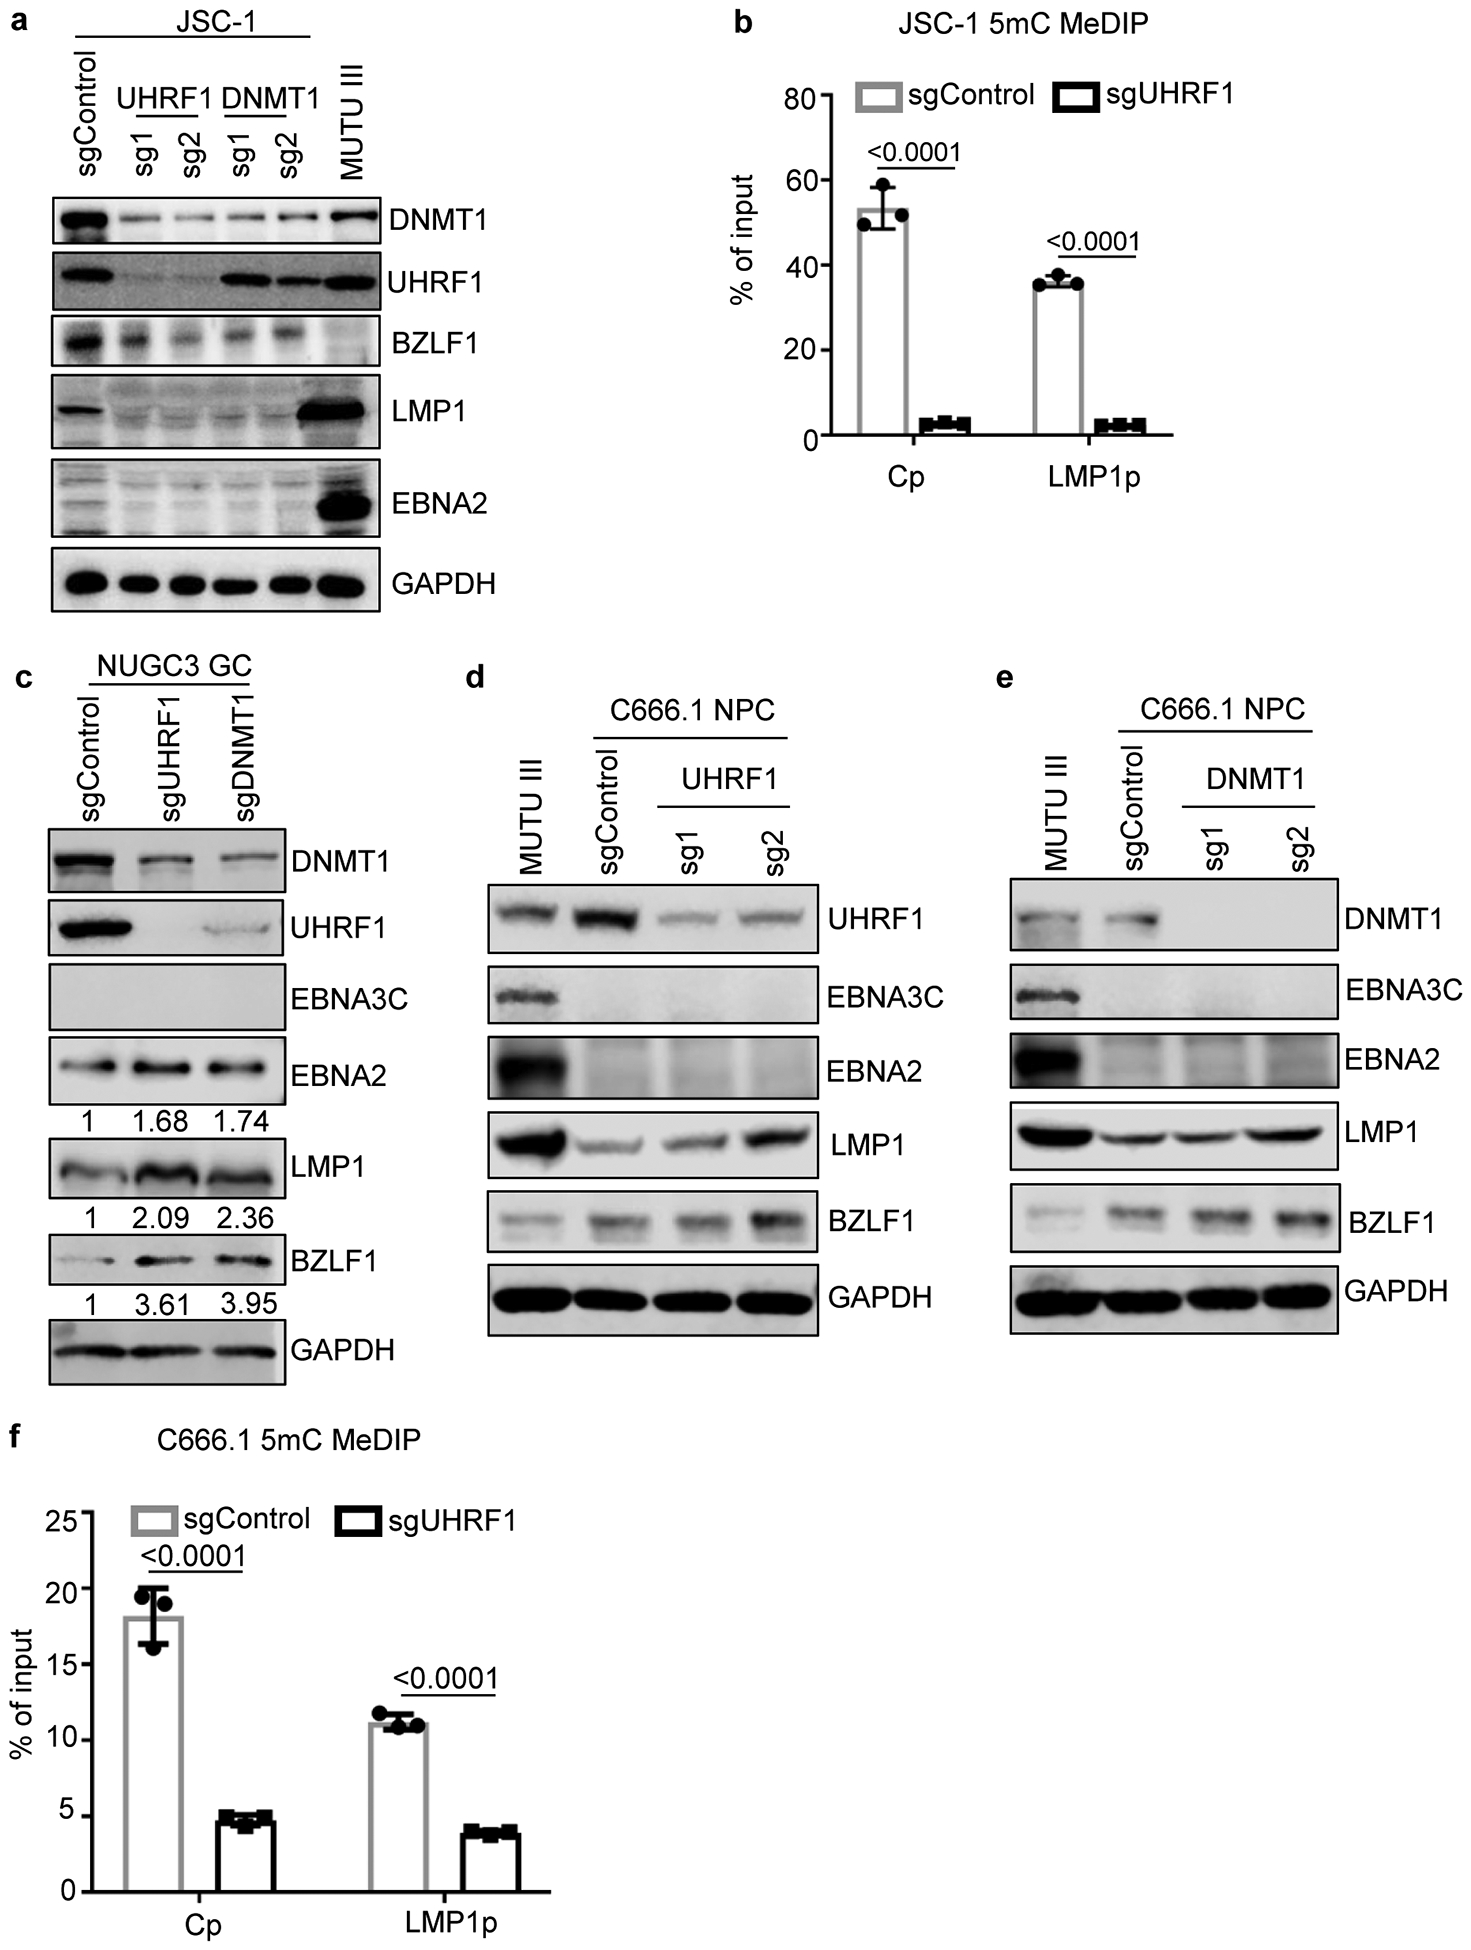
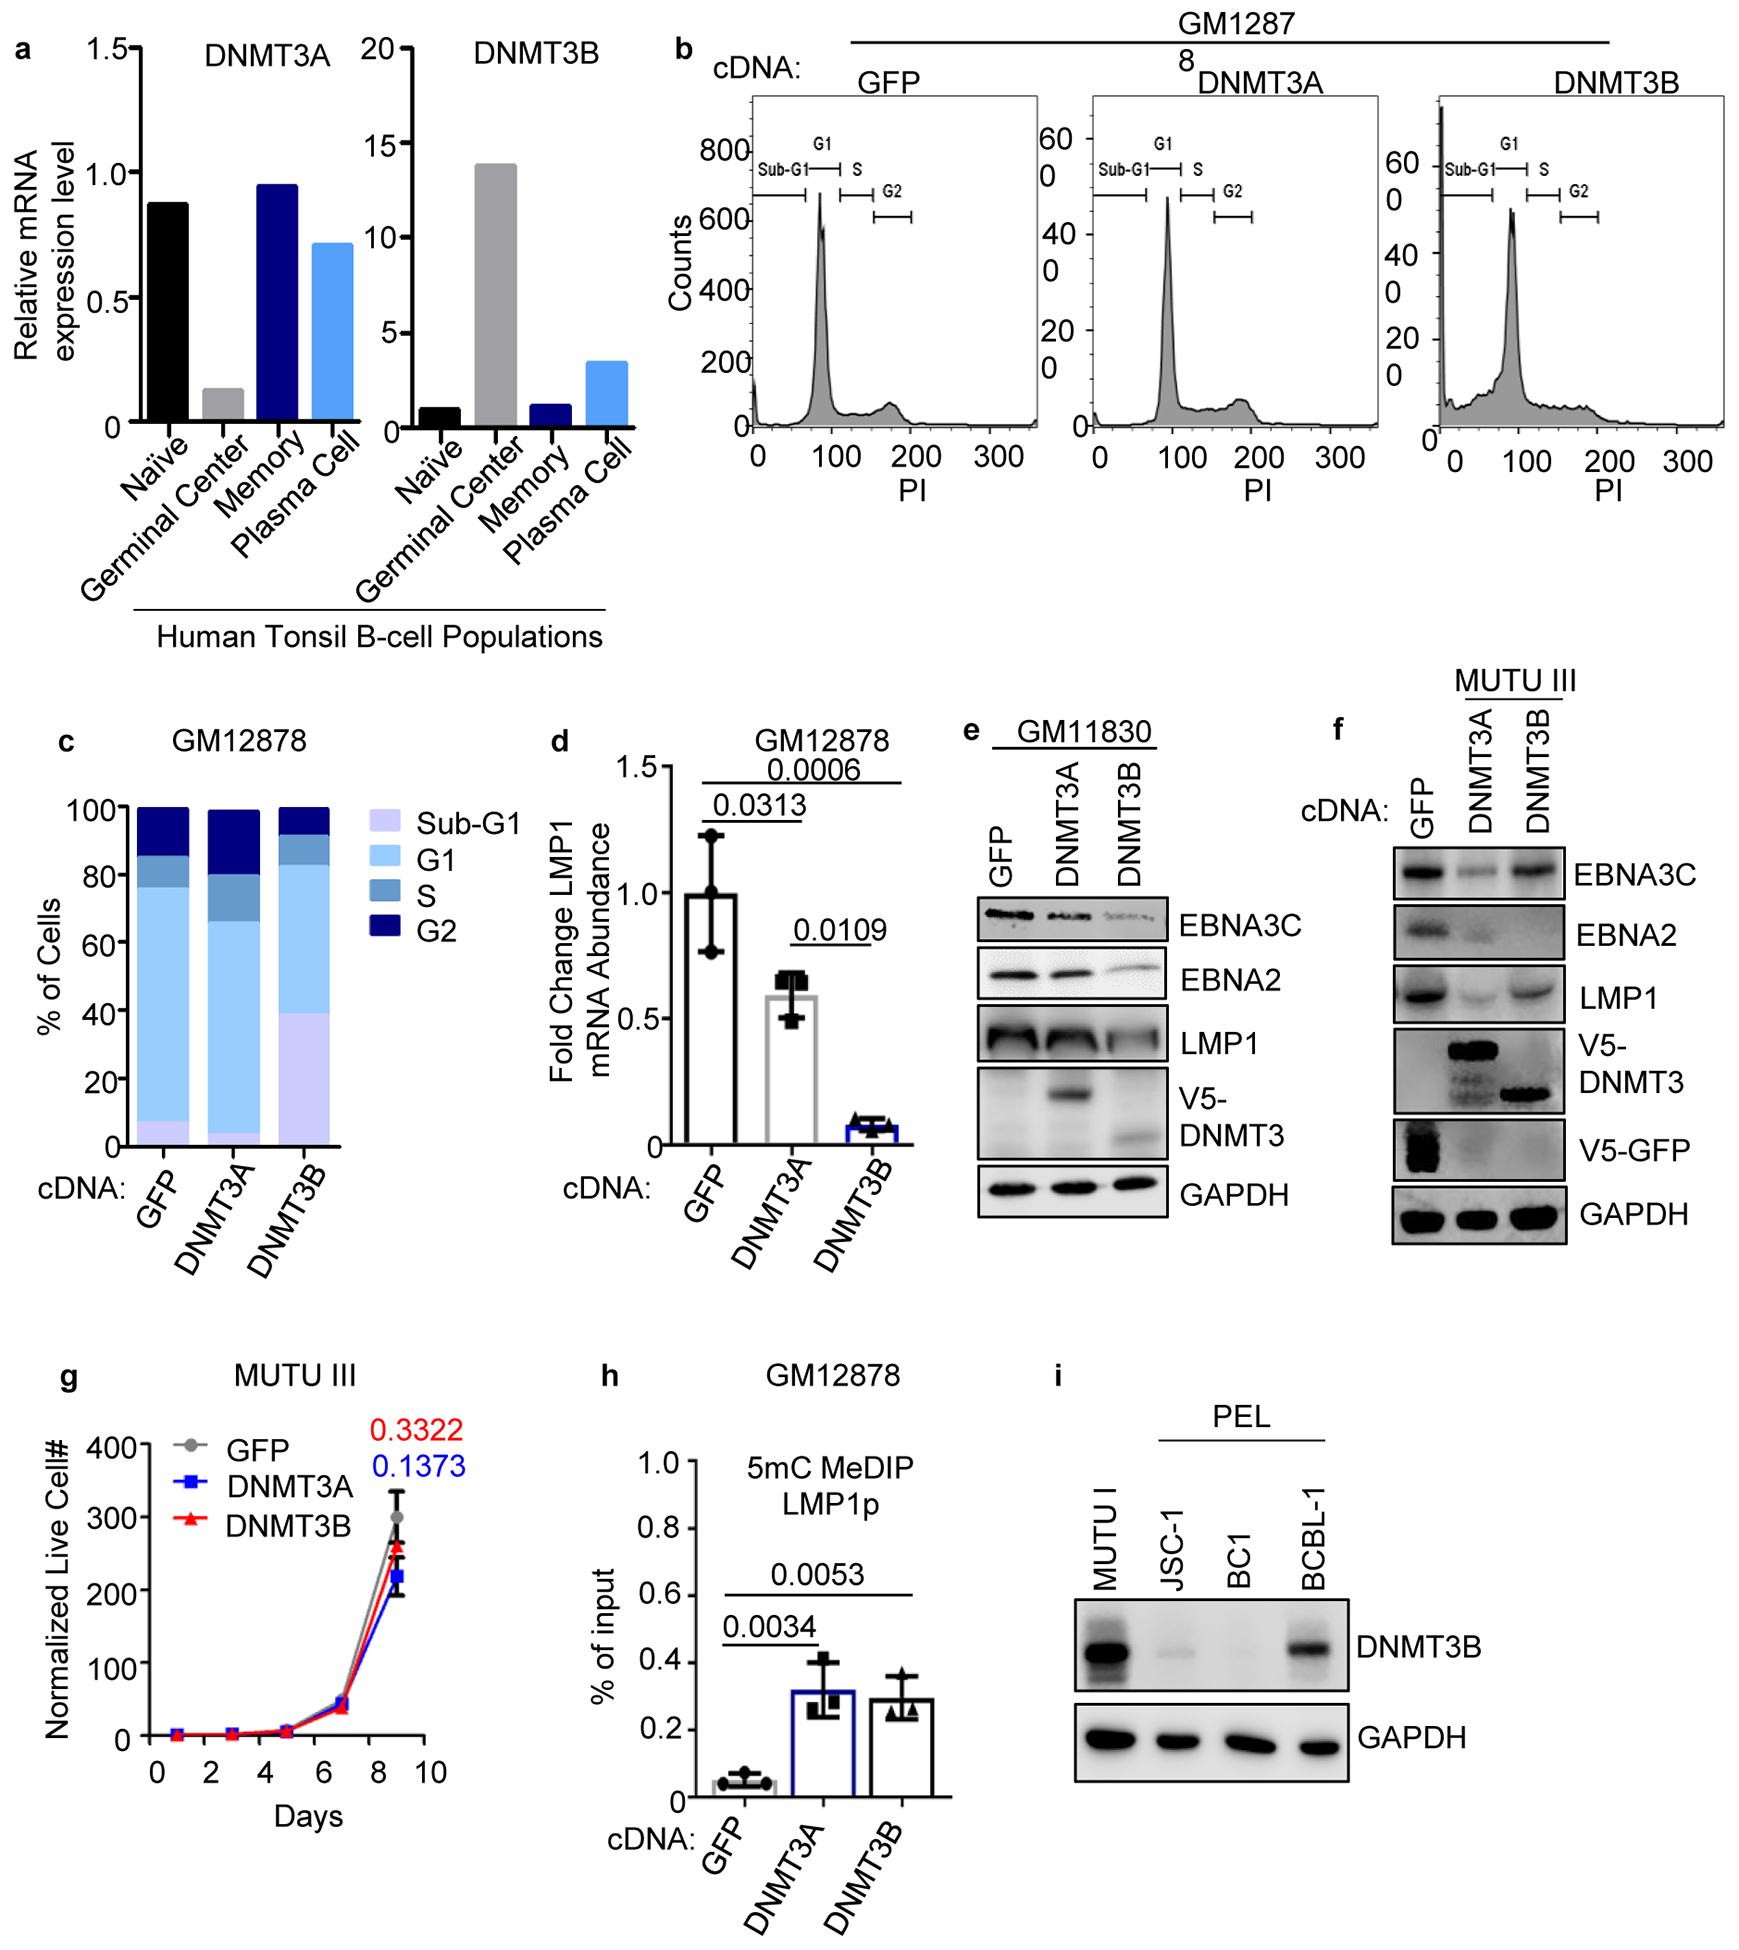
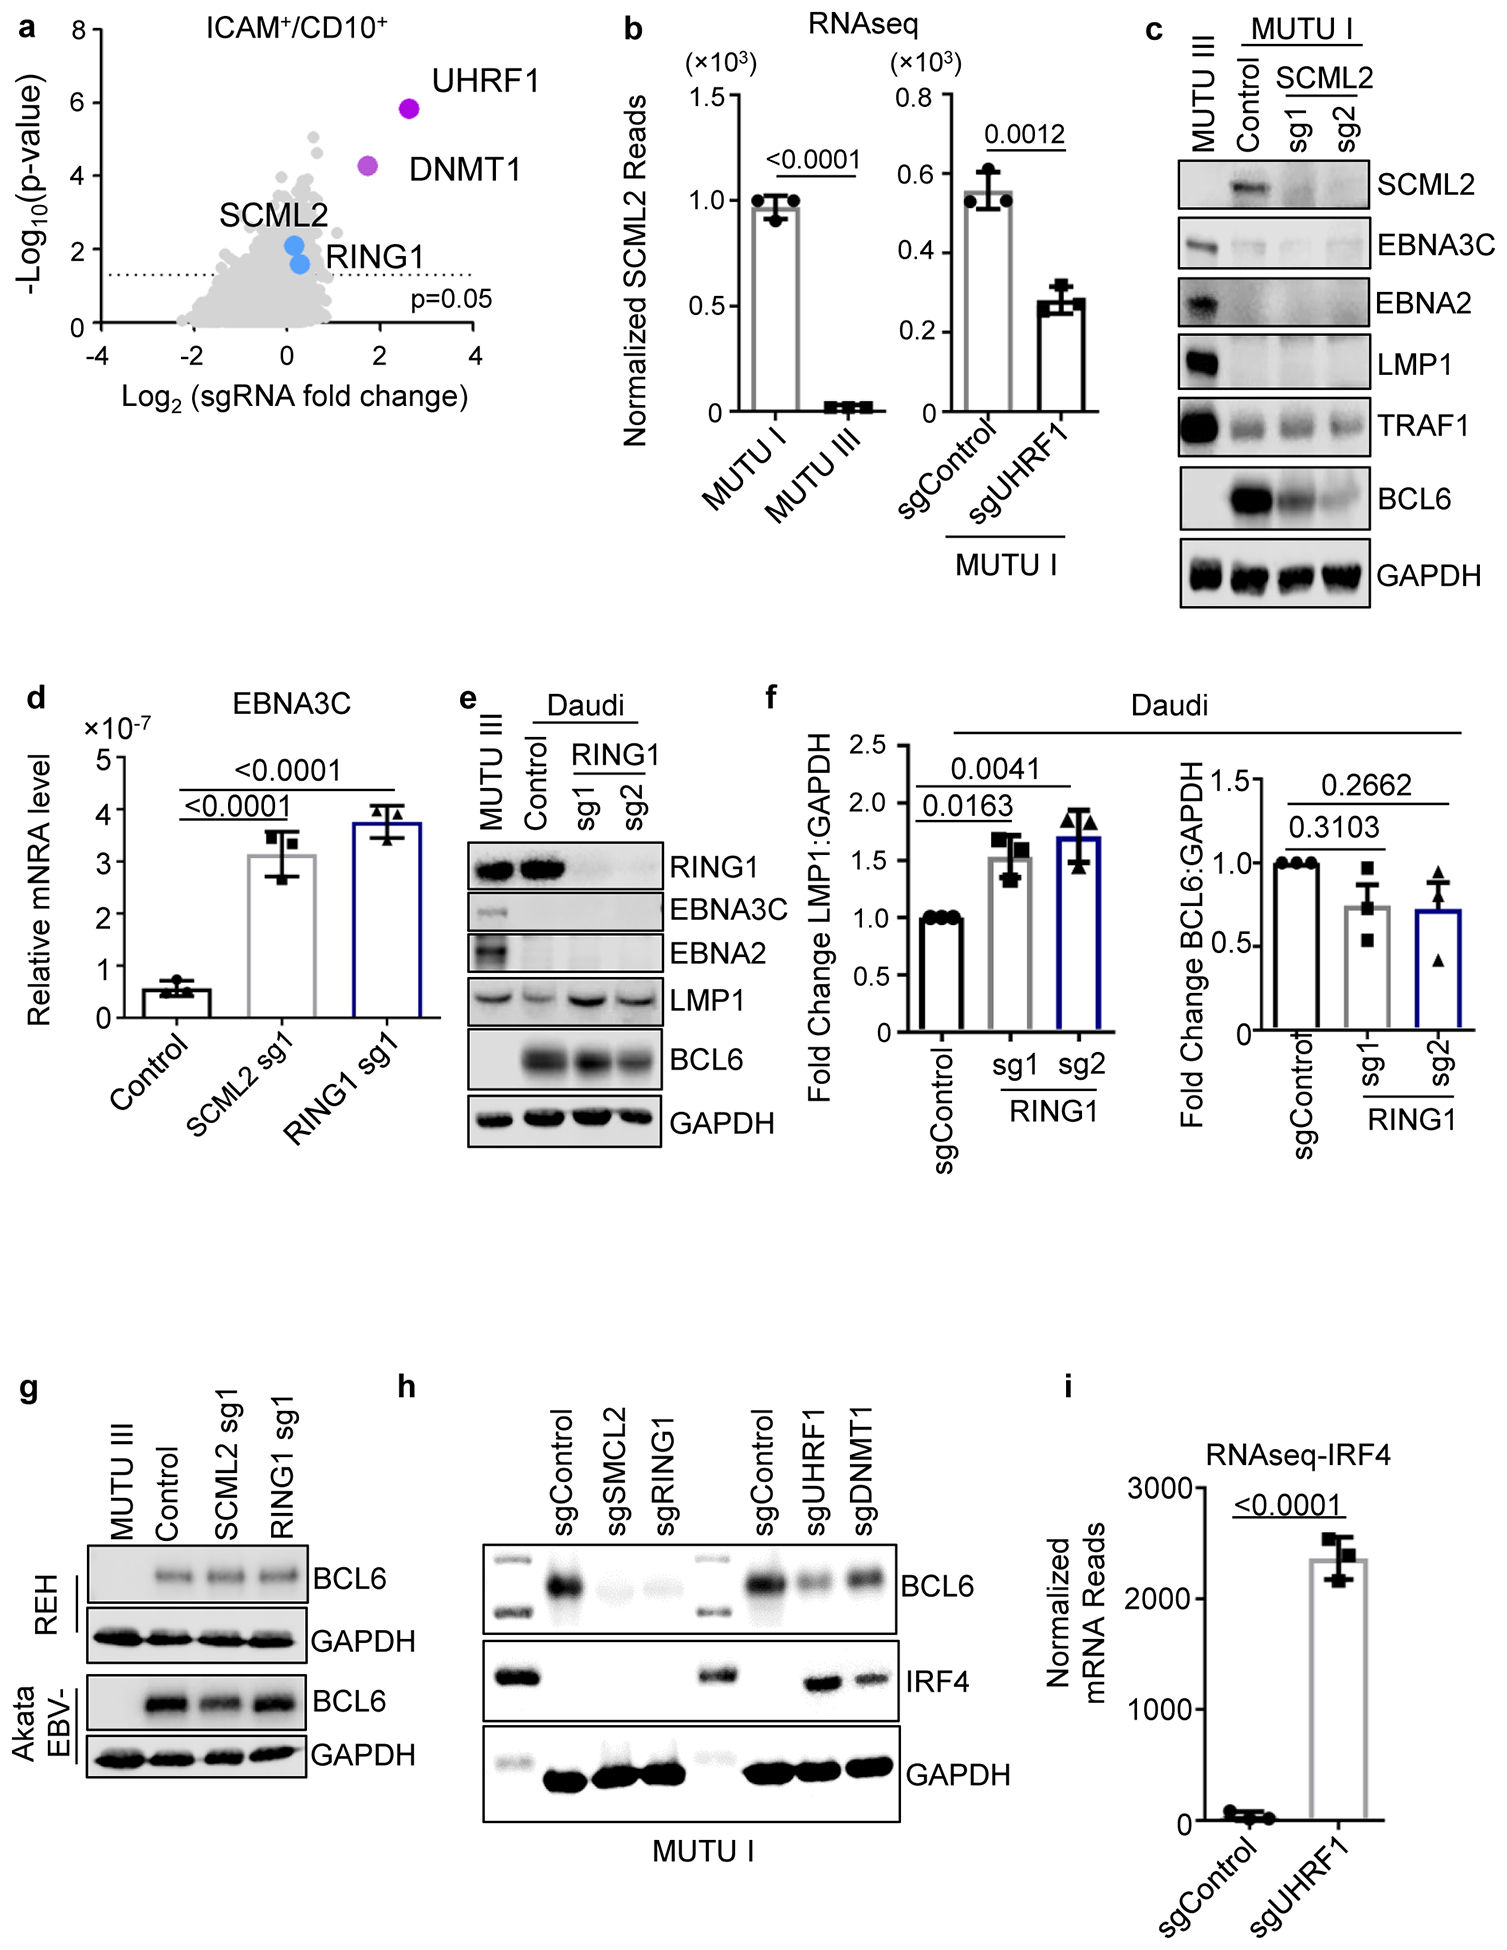
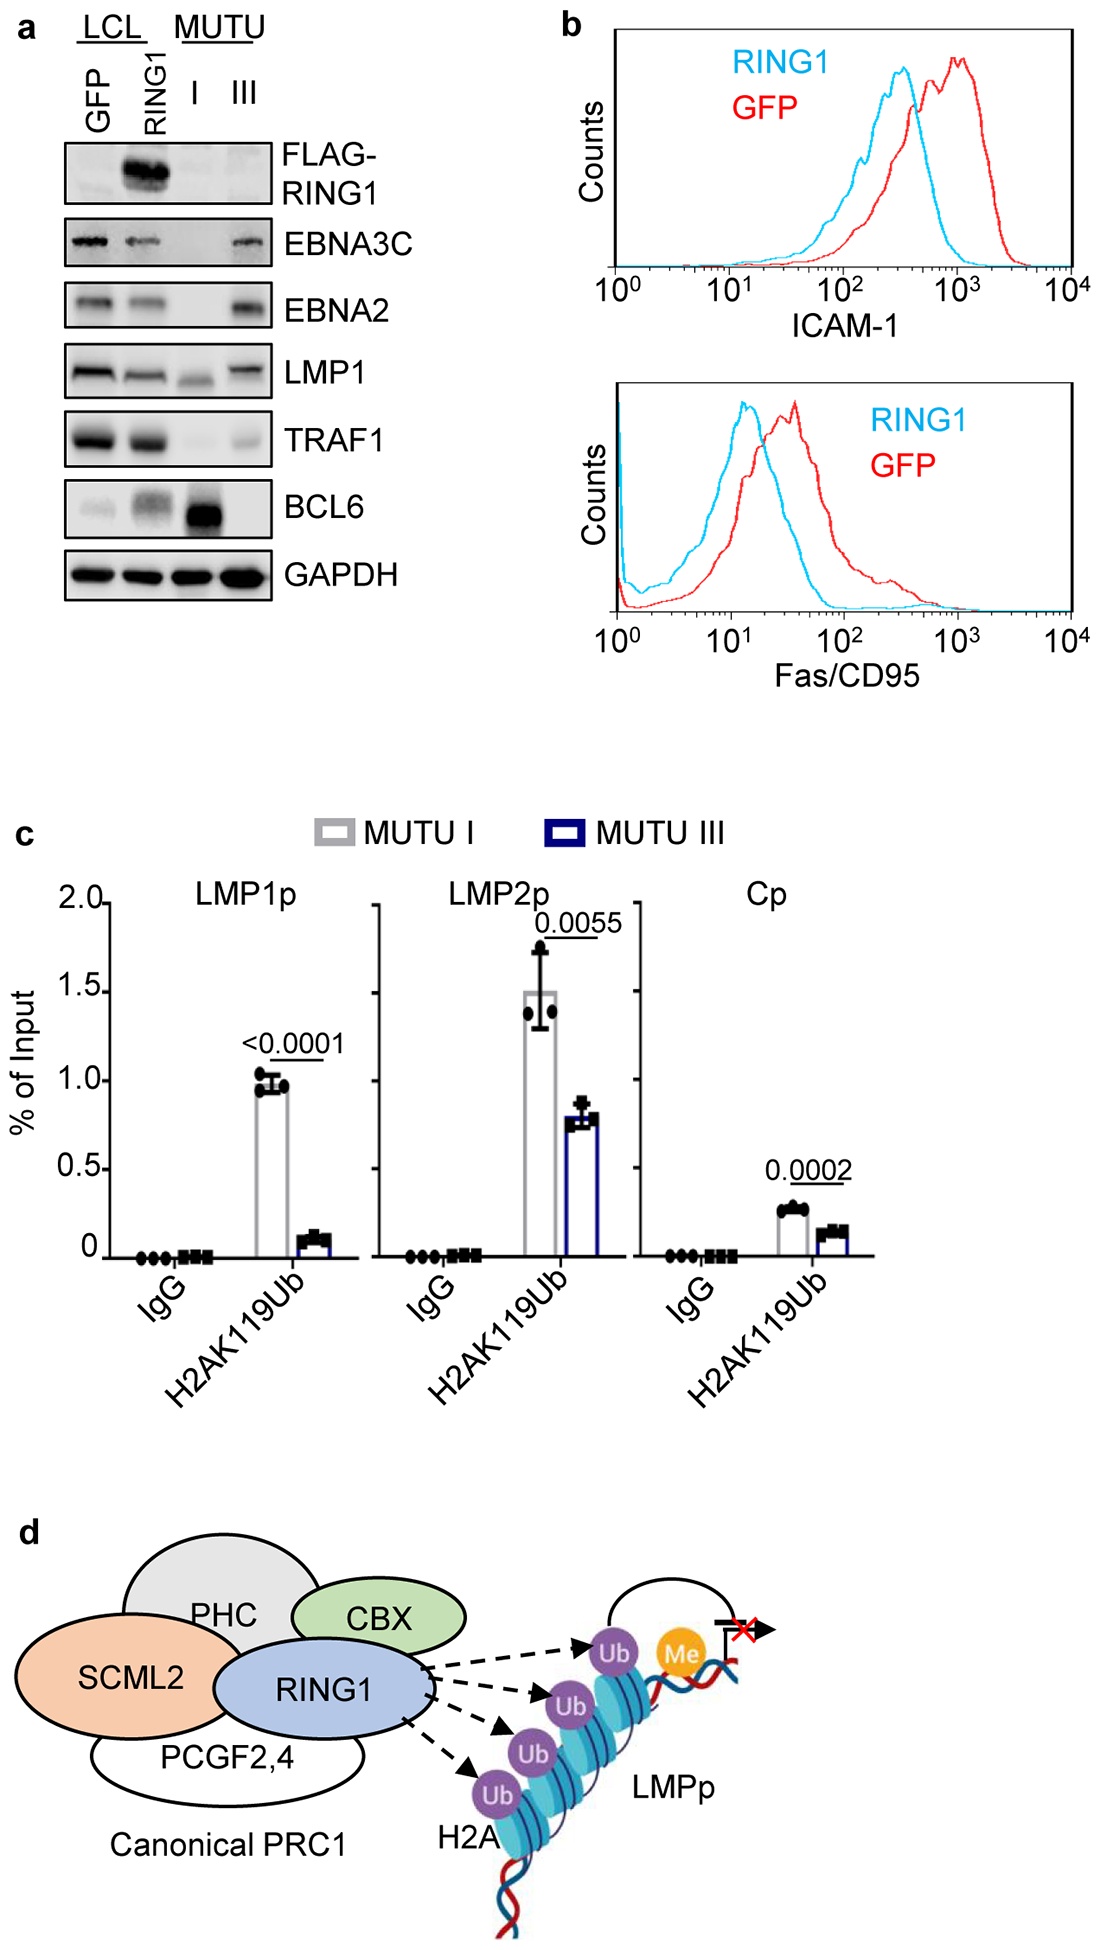
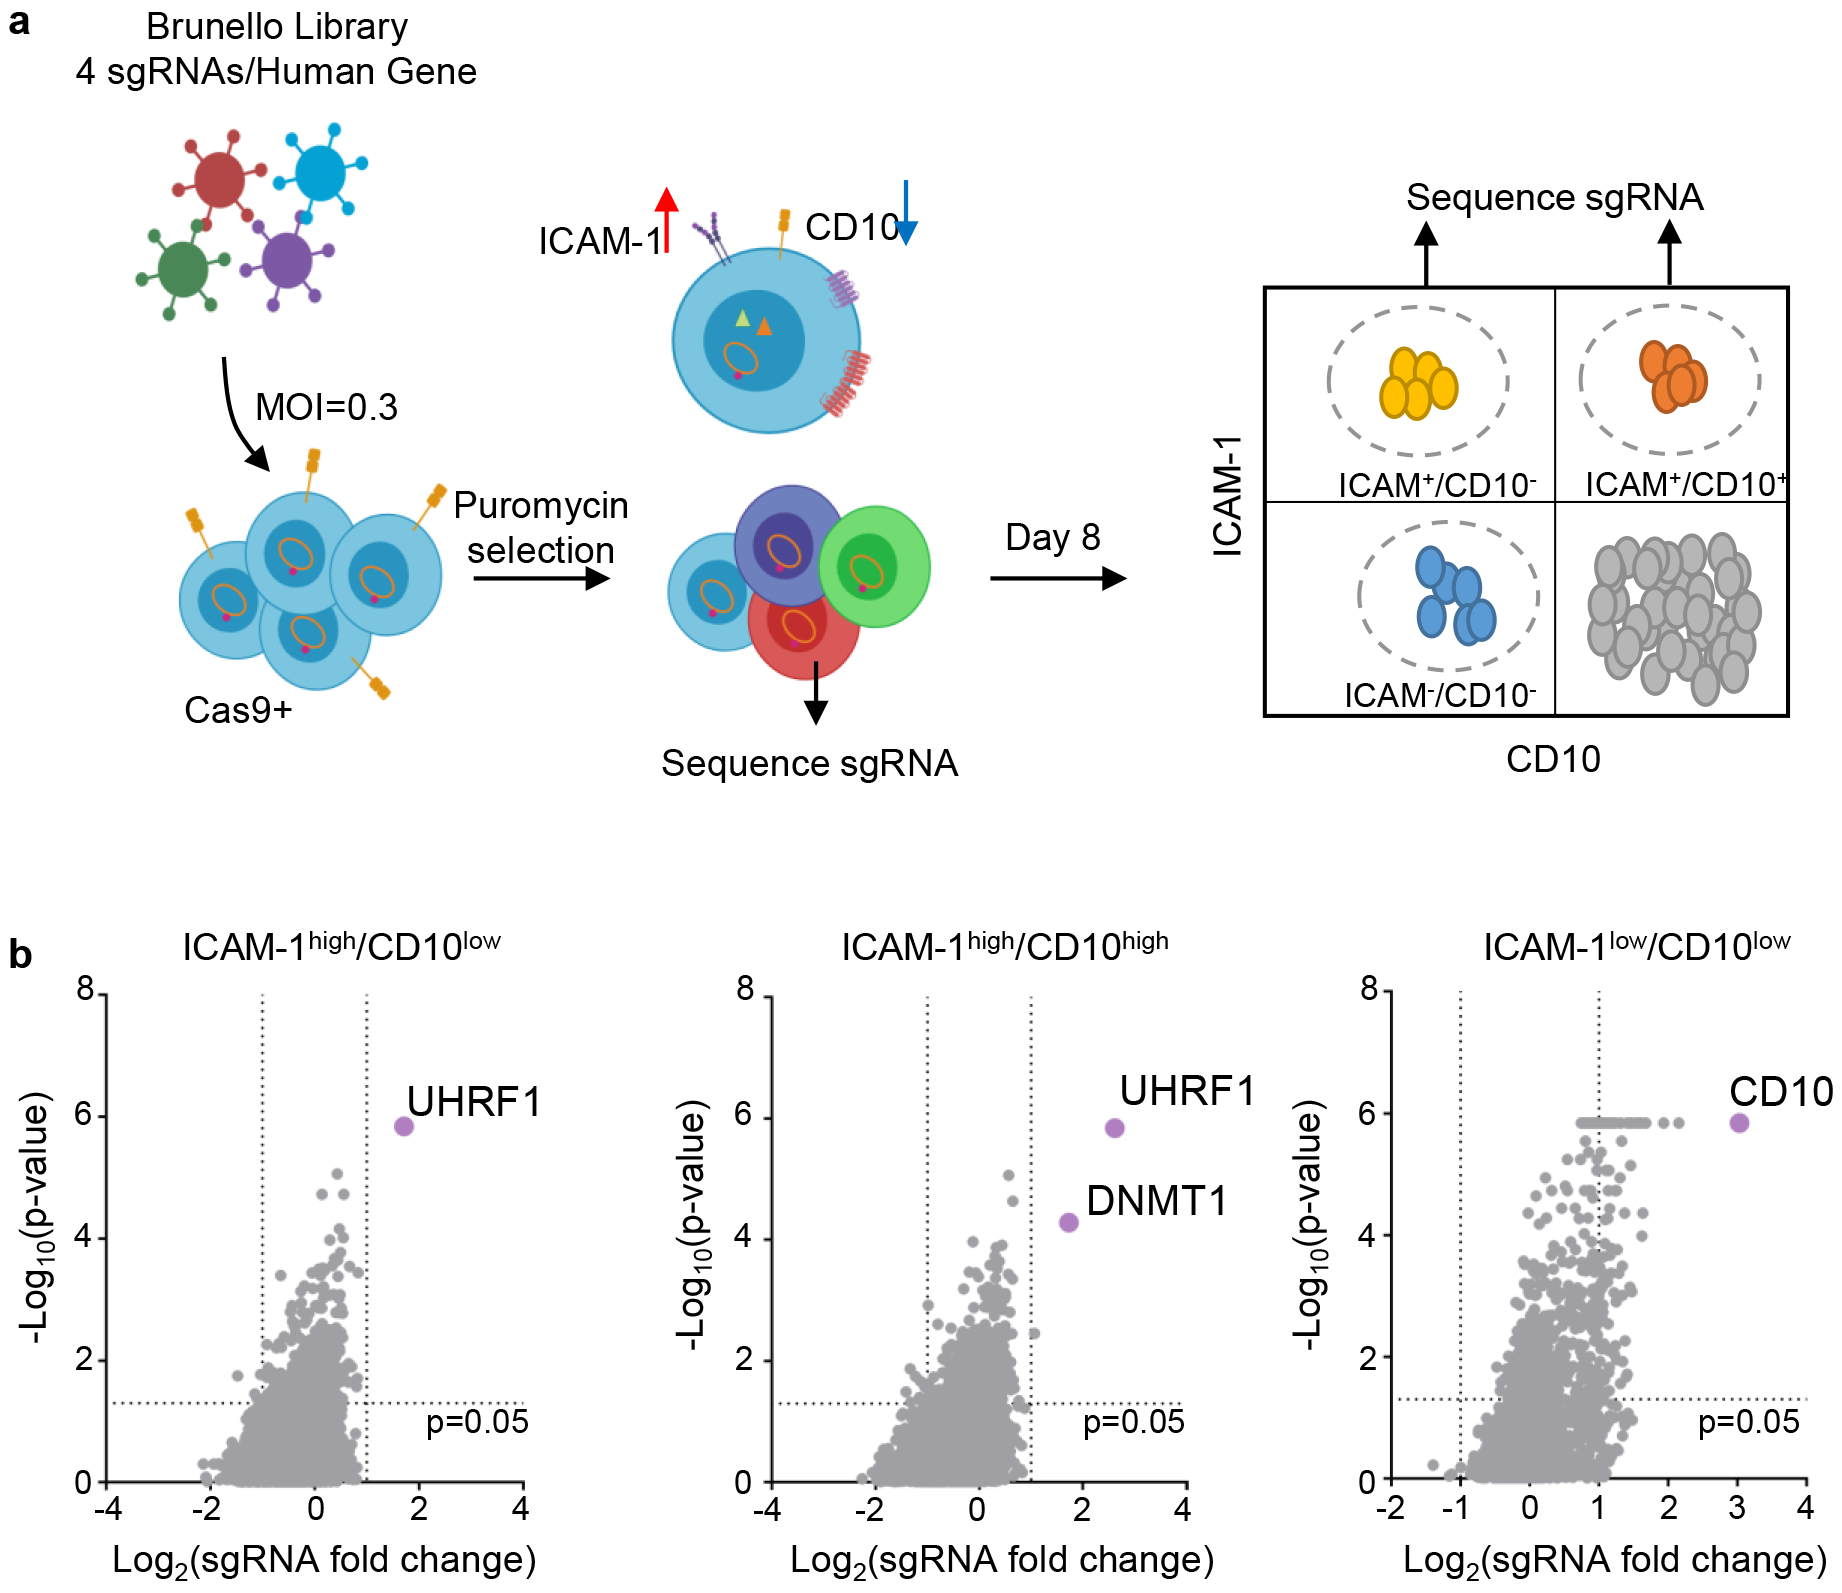
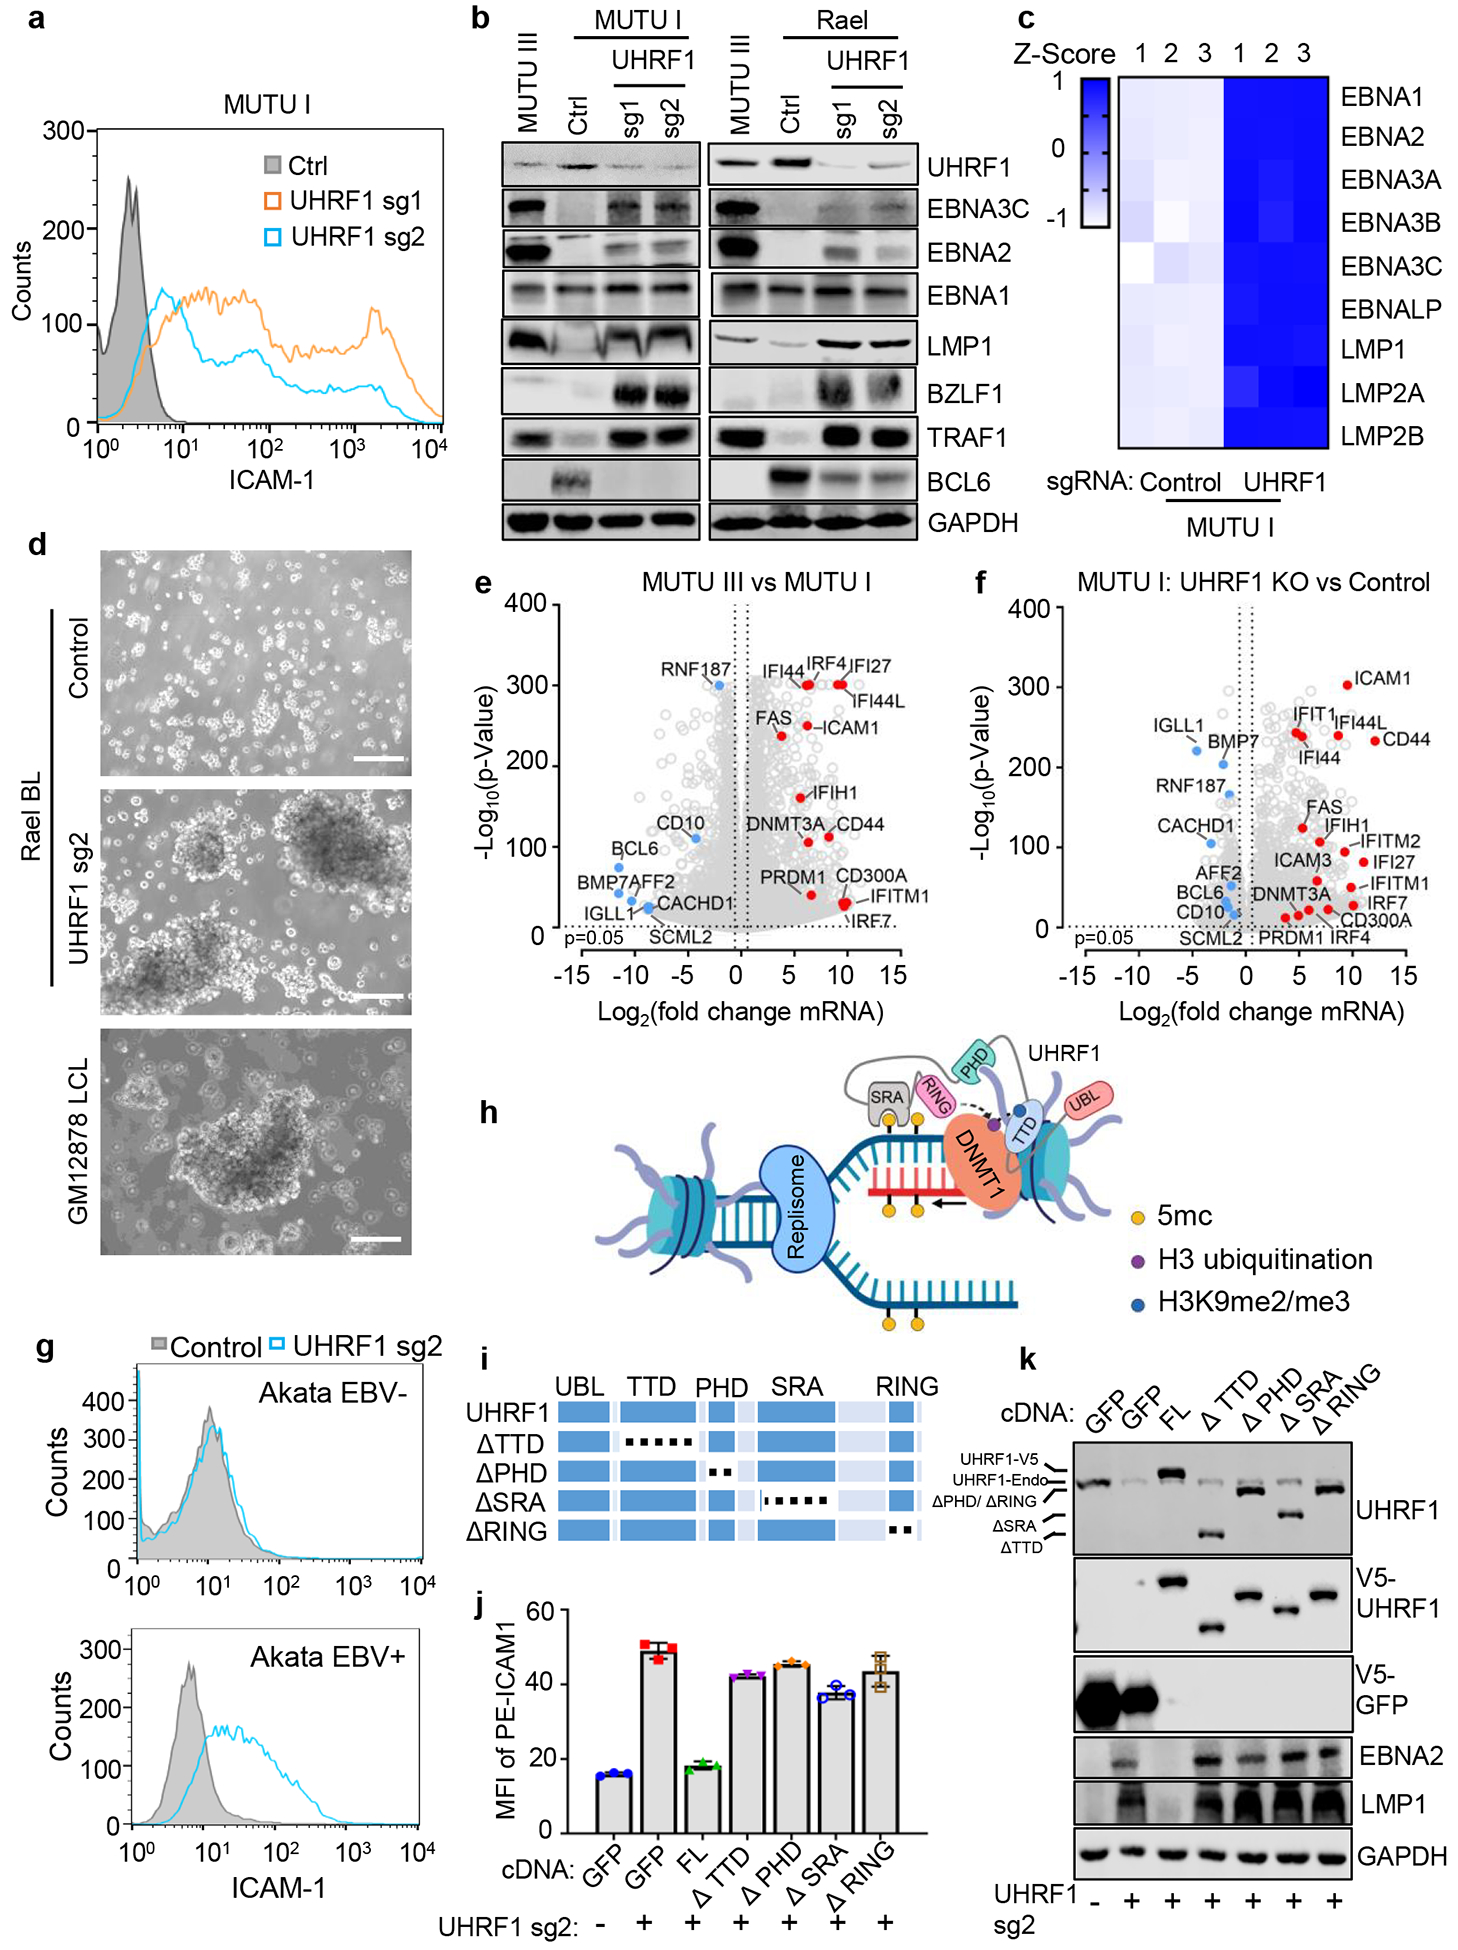
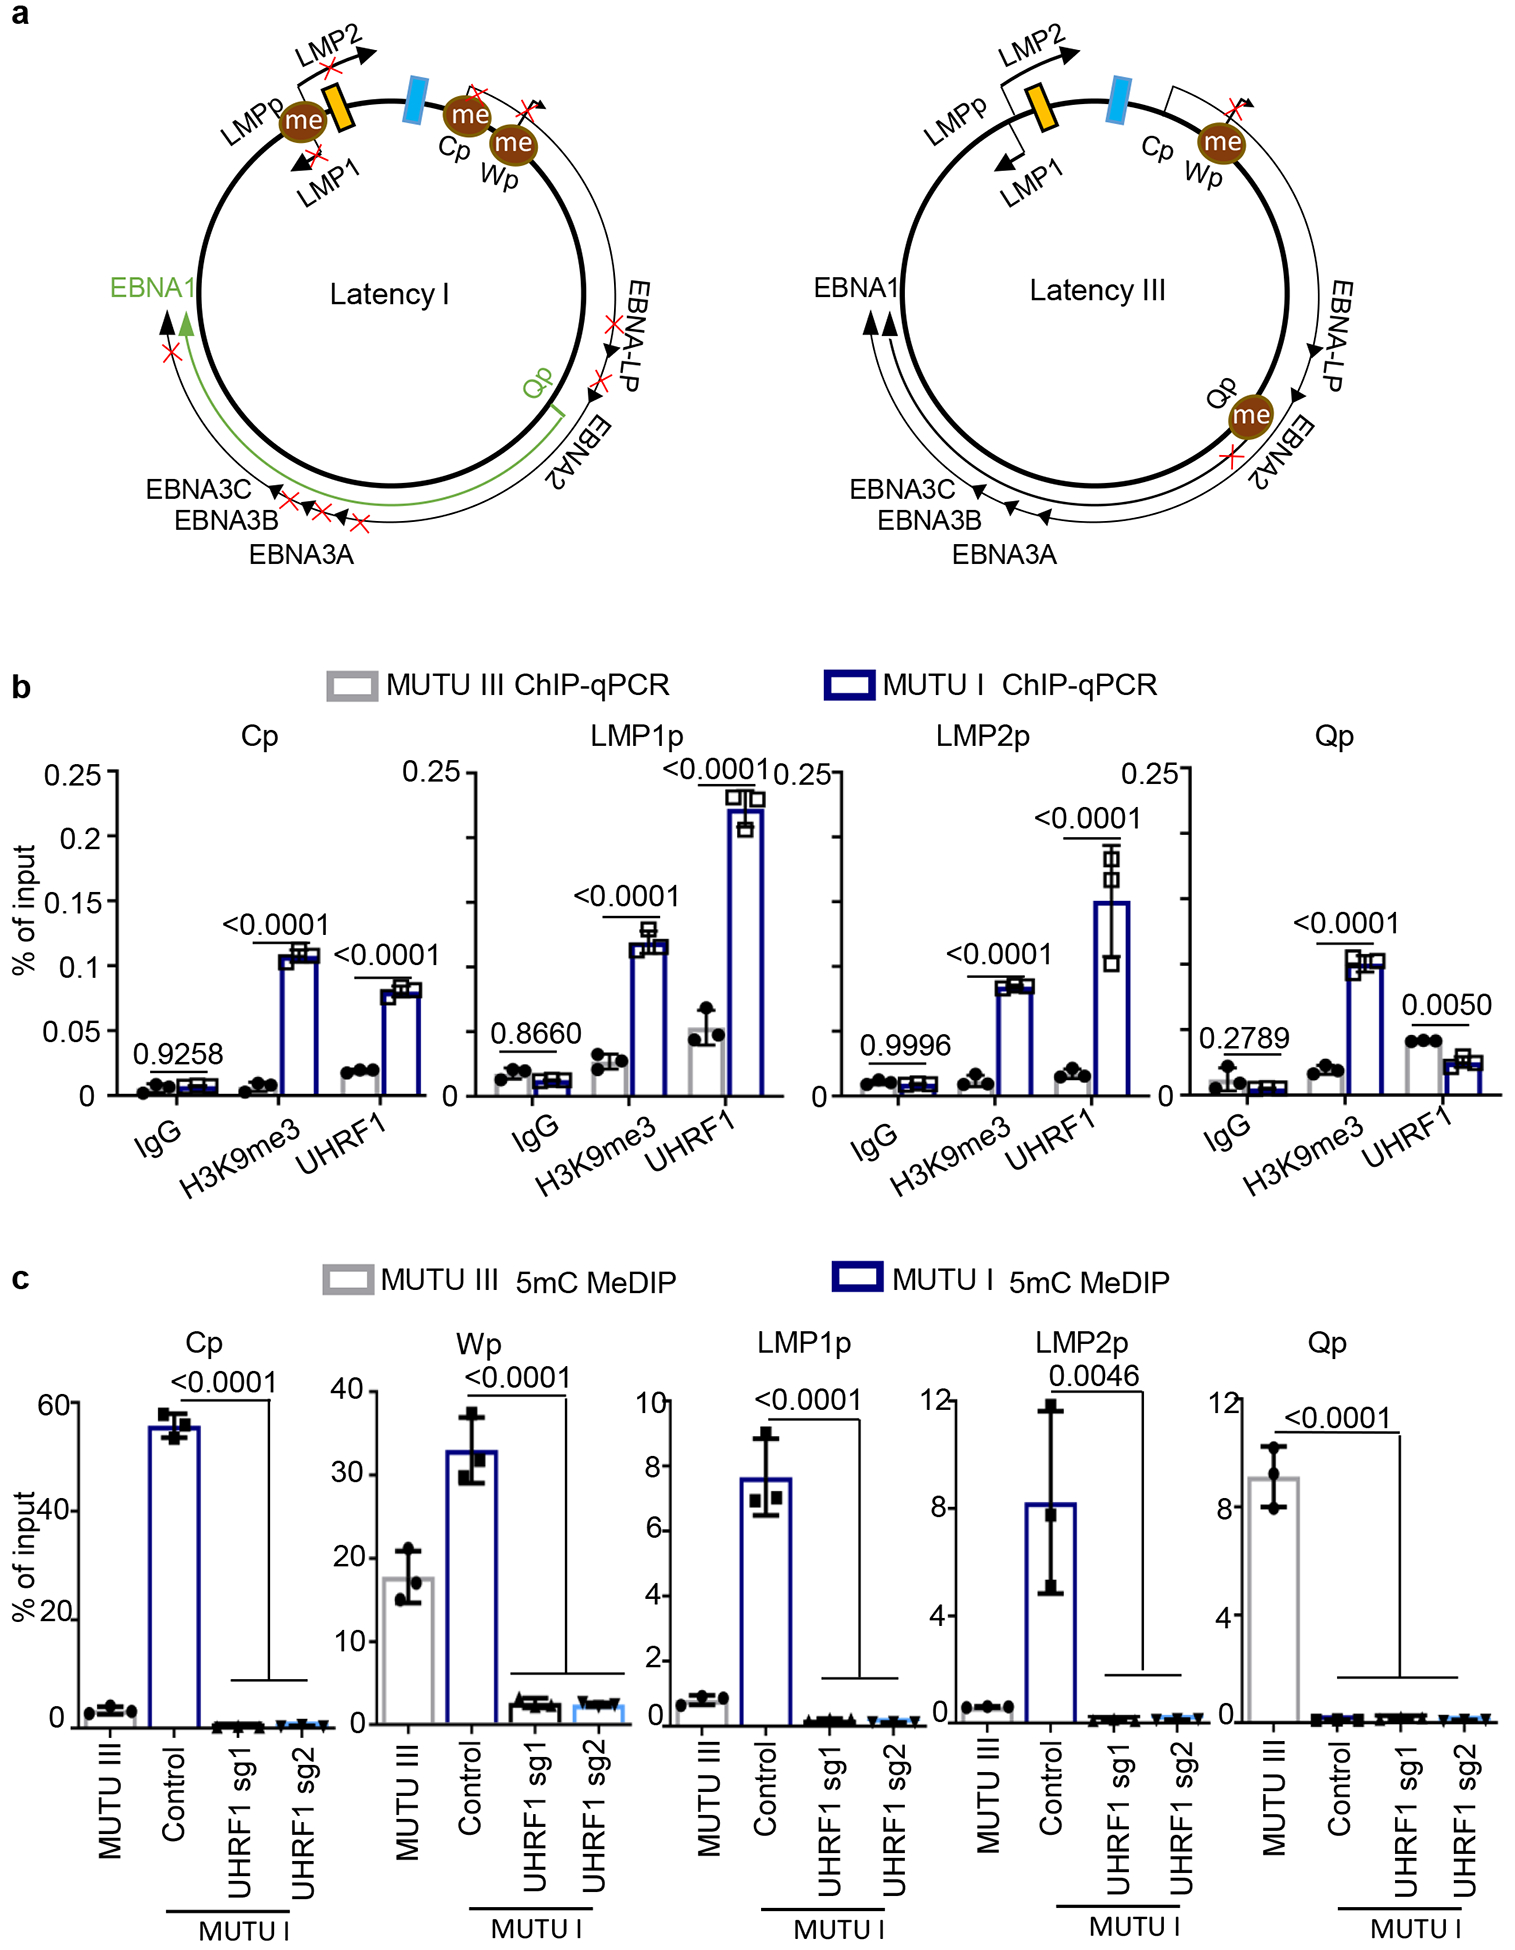
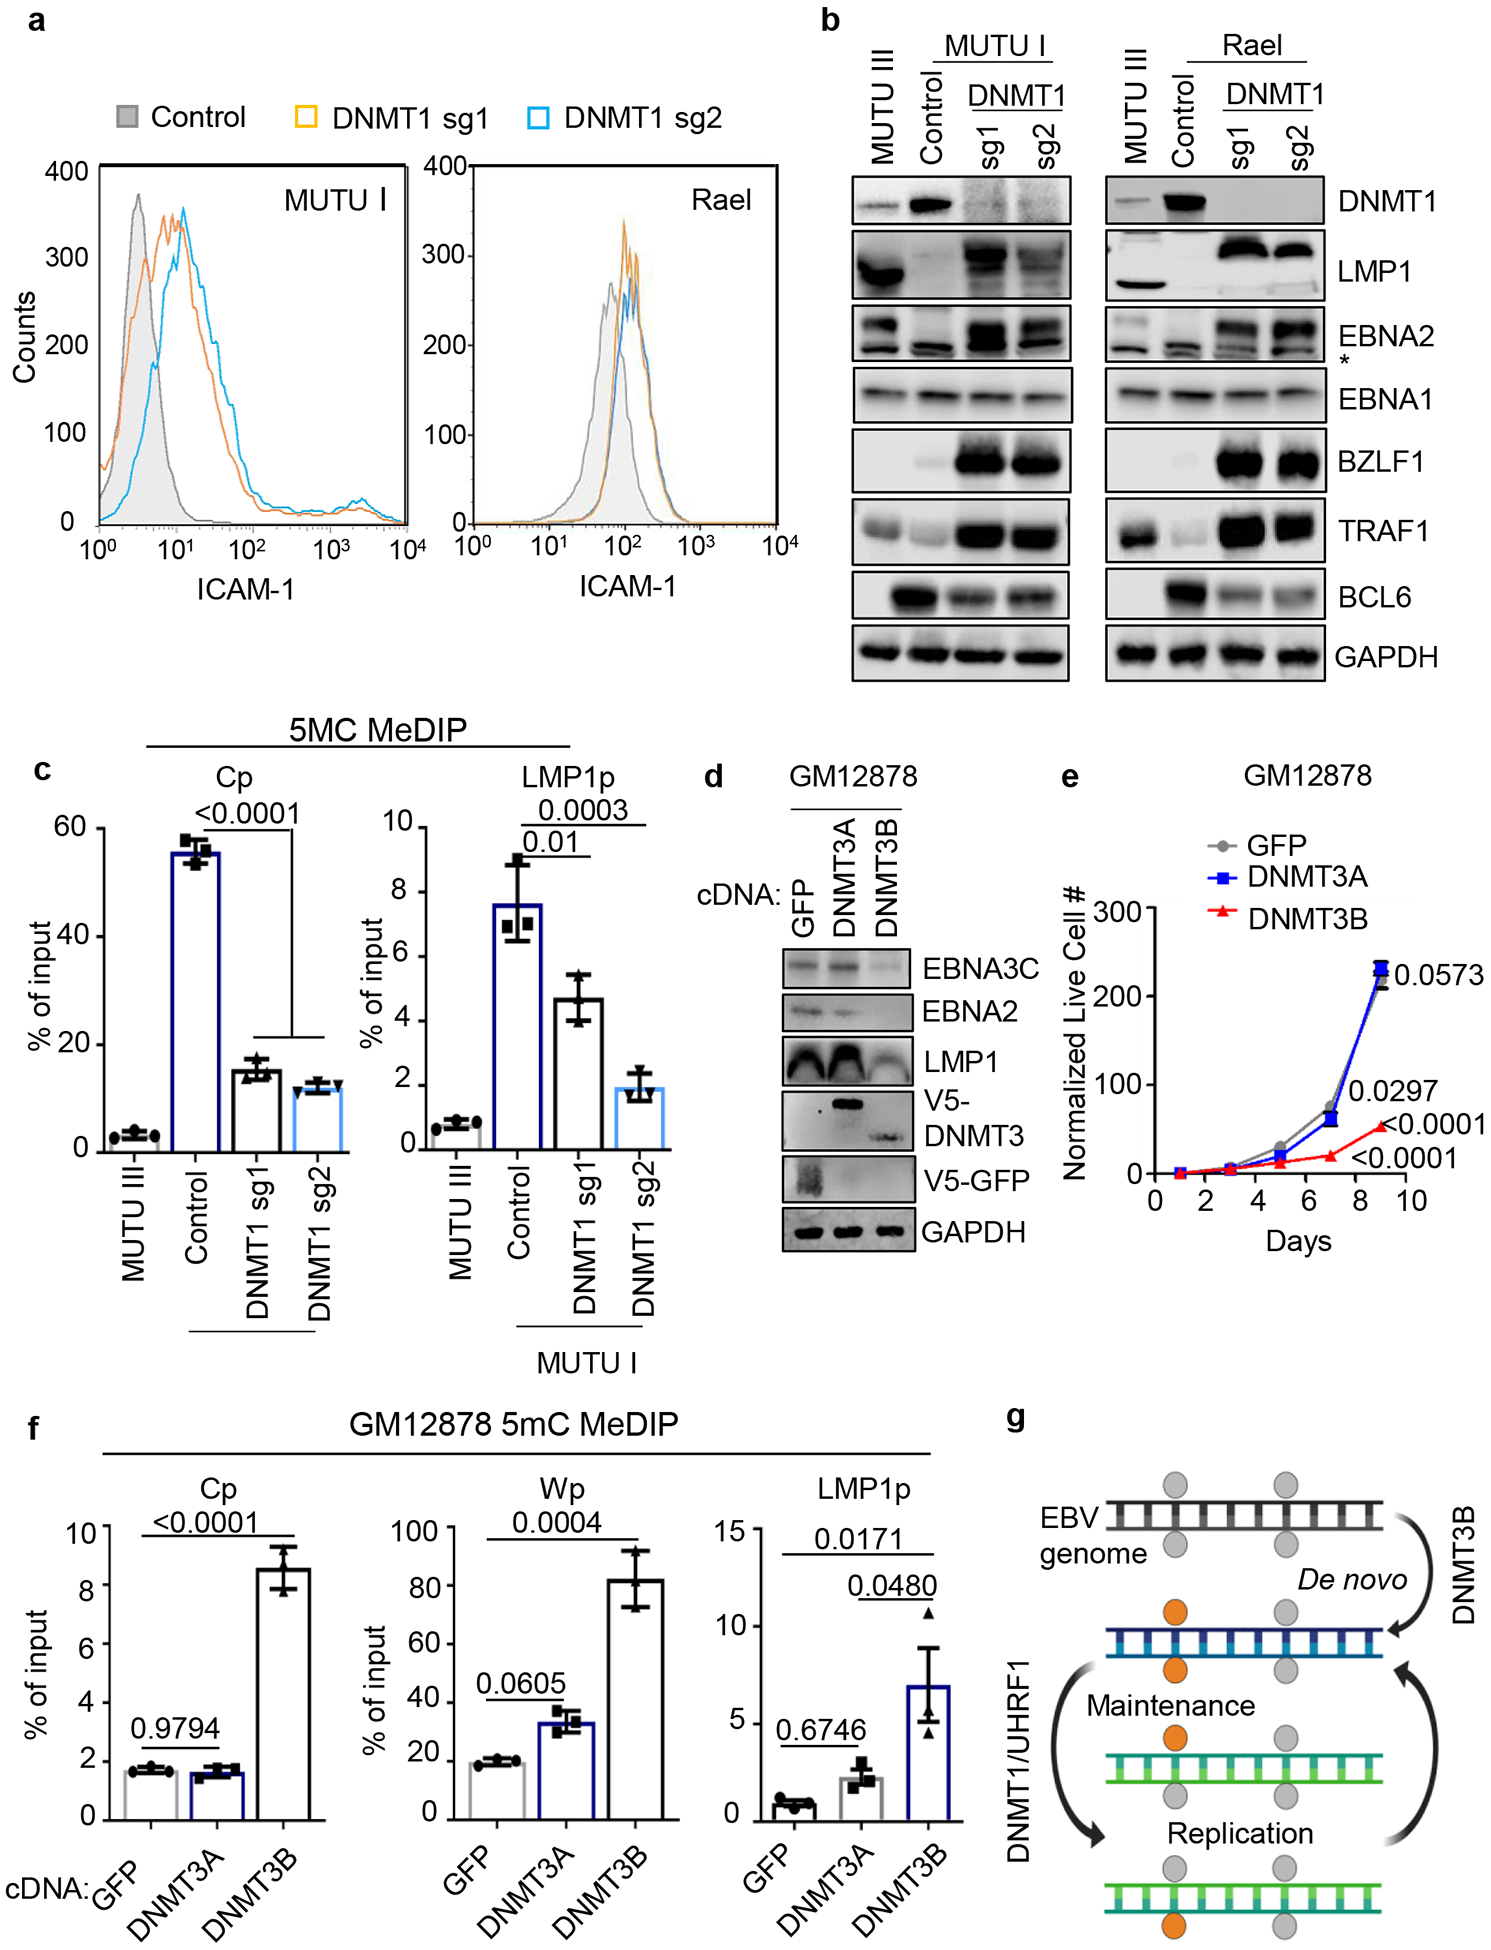
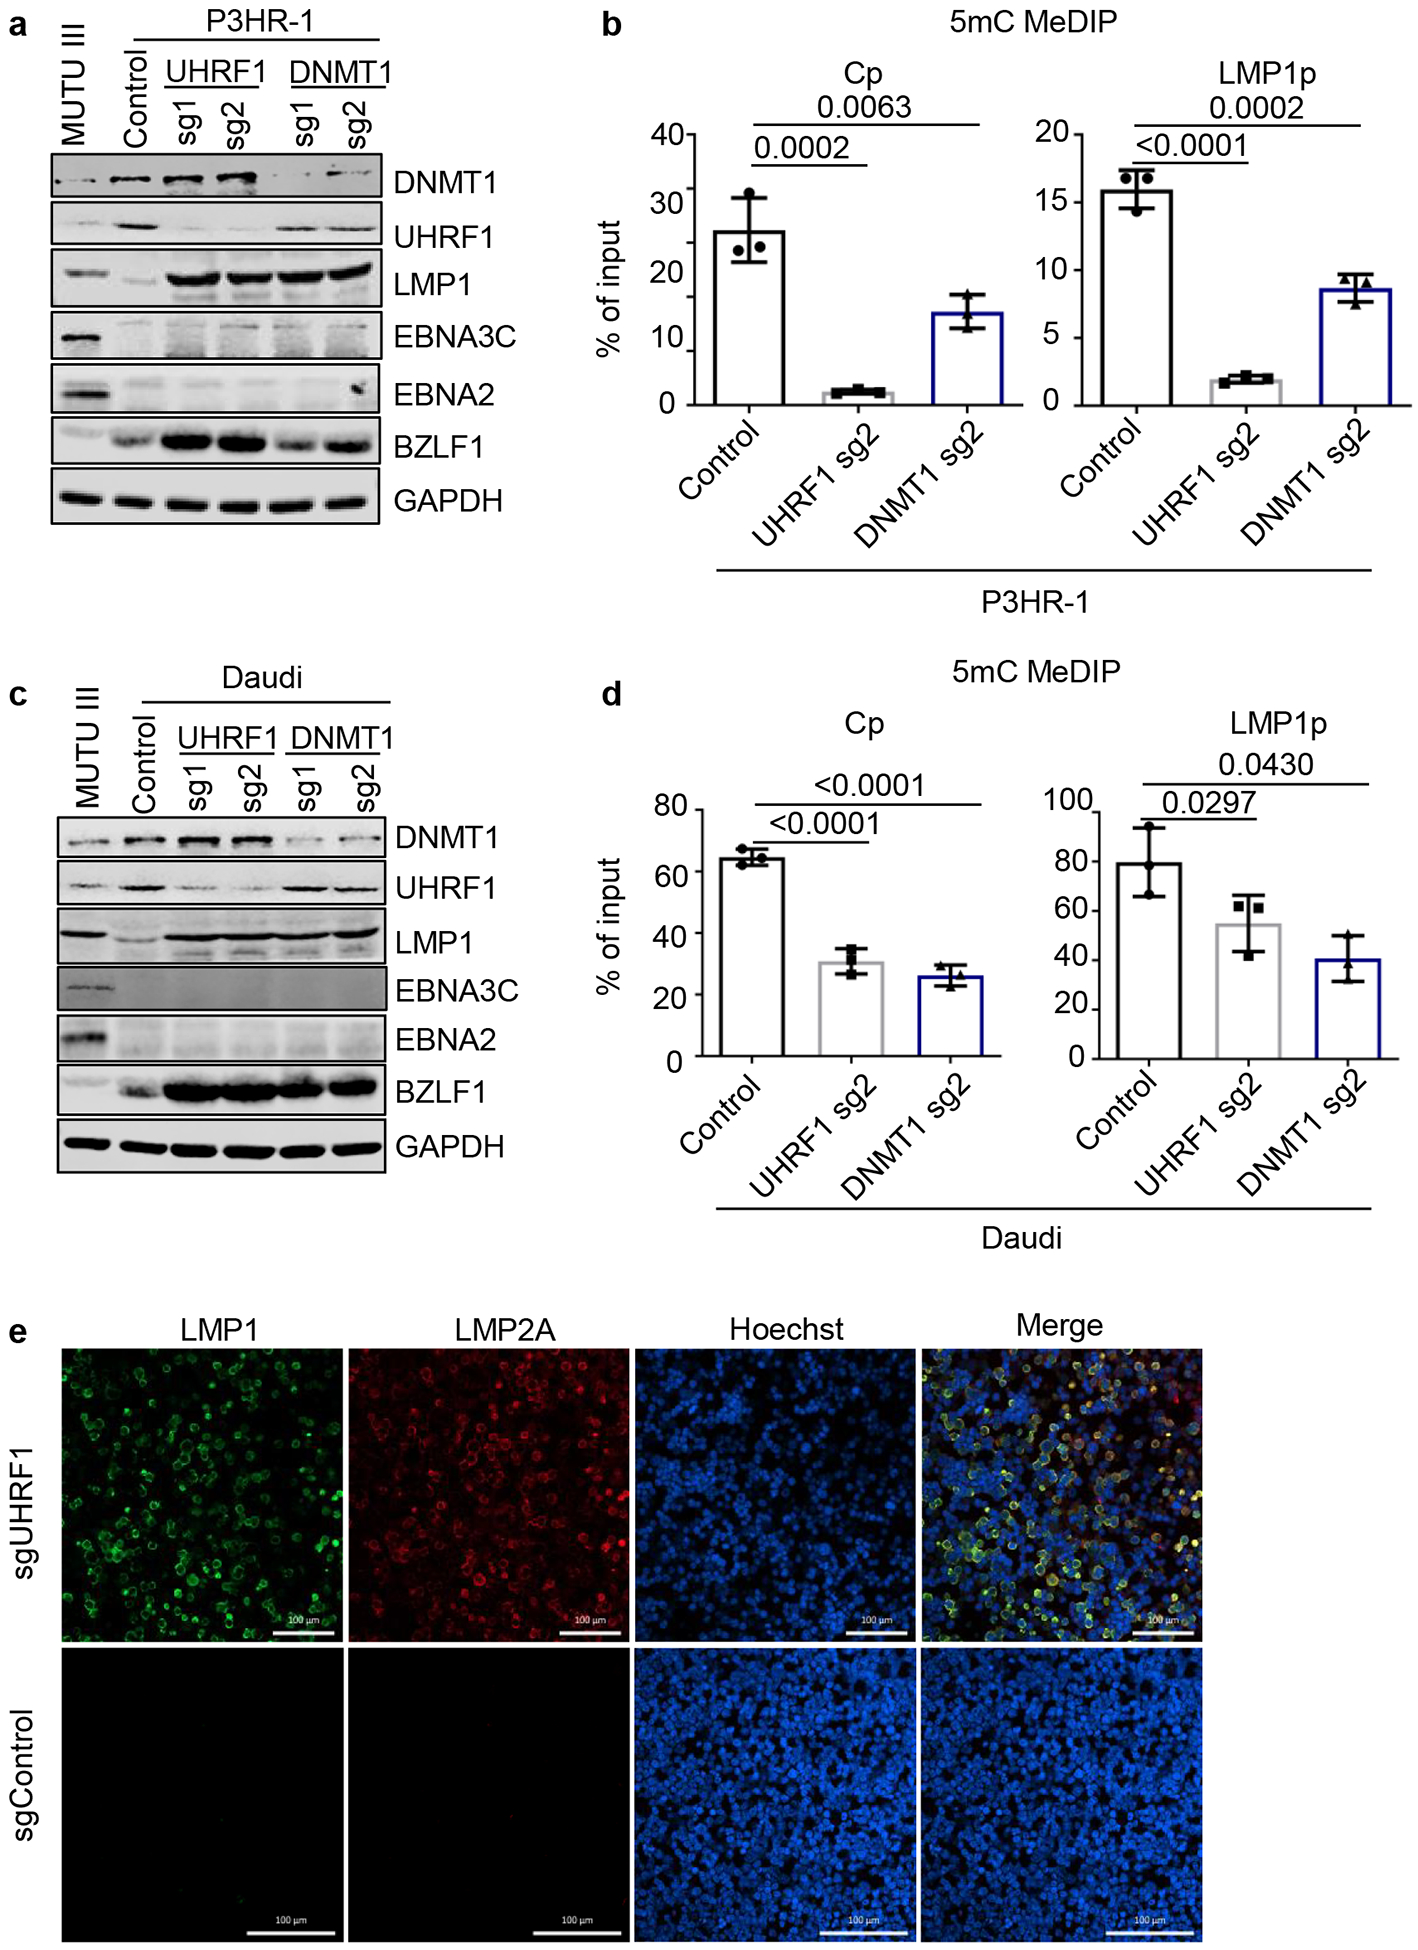
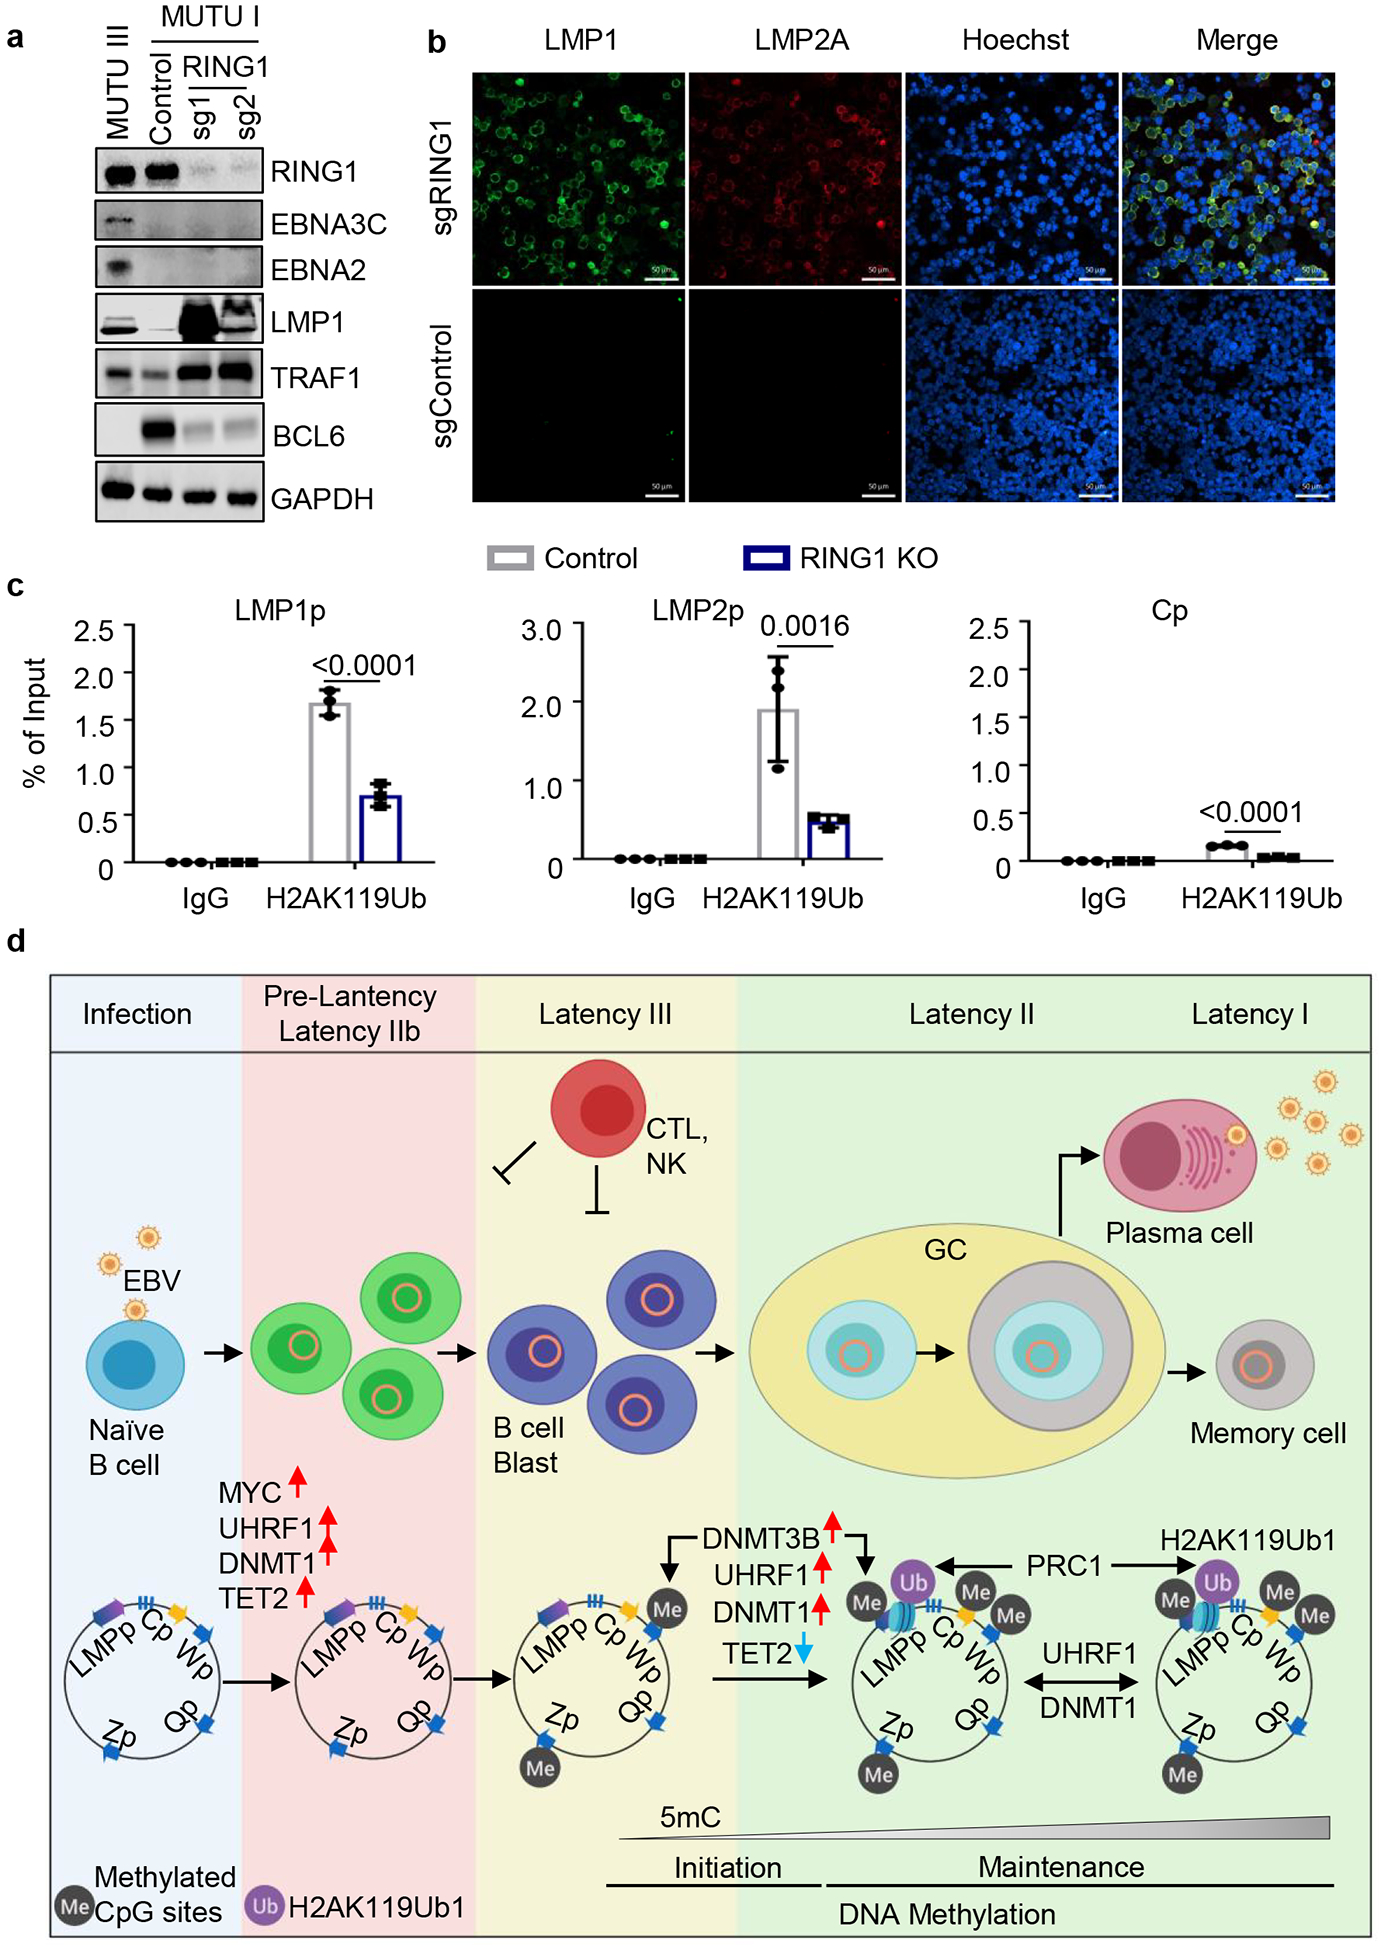
To accomplish the remarkable task of lifelong infection, the Epstein-Barr virus (EBV) switches between four viral genome latency and lytic programmes to navigate the B-cell compartment and evade immune responses. The transforming programme, consisting of highly immunogenic EBV nuclear antigen (EBNA) and latent membrane proteins (LMPs), is expressed in newly infected B lymphocytes and in post-transplant lymphomas. On memory cell differentiation and in most EBV-associated Burkitt's lymphomas, all but one viral antigen are repressed for immunoevasion. To gain insights into the epigenetic mechanisms that restrict immunogenic oncoprotein expression, a genome-scale CRISPR-Cas9 screen was performed in EBV and Burkitt's lymphoma cells. Here, we show that the ubiquitin ligase ubiquitin-like PHD and RING finger domain-containing protein 1 (UHRF1) and its DNA methyltransferase partner DNA methyltransferase I (DNMT1) are critical for the restriction of EBNA and LMP expression. All UHRF1 reader and writer domains were necessary for silencing and DNMT3B was identified as an upstream viral genome CpG methylation initiator. Polycomb repressive complex I exerted a further layer of control over LMP expression, suggesting a second mechanism for latency programme switching. UHRF1, DNMT1 and DNMT3B are upregulated in germinal centre B cells, the Burkitt's lymphoma cell of origin, providing a molecular link between B-cell state and the EBV latency programme. These results suggest rational therapeutic targets to manipulate EBV oncoprotein expression.


Conflict of interest statement

Competing Interests

The authors declare no competing financial interests. LGR is a consultant for Janssen, ADC Therapeutics.

Figures

Extended Data Fig. 1
Extended Data Fig. 1. Genome-wide CRISPR-Cas9 Mediated Loss-of-Function Screen Identifies UHRF1 and DNMT1 as candidate regulators of EBV Latency III.
a, Volcano plot visualization of -Log10(p-value) statistical significance (y-axis) and Log2 fold-change in mRNA abundance (x-axis) of MUTU III versus MUTU I cells from triplicate RNA-seq datasets. ICAM-1 and CD10 (encoded by MME) are highlighted by red dots. n=3 biologically independent replicates. P-value and log fold change were generated with DESeq under default settings with Wald test and normal shrinkage, respectively b, Plasma membrane ICAM-1 (left) and CD10 (right) abundances in MUTU1 (red), MUTU III (green) and GM12878 LCLs. Plots are representative of n=3 biologically independent values. c, FACS plots of plasma membrane ICAM-1 and CD10 abundances in MUTU I cells prior to and at 8 days following transduction by the Brunello sgRNA library. Transduced cells were puromycin selected two days post-transduction. Plots are representative of n=3 biologically independent values. d, Volcano plot of CRISPR screen results for genes encoding host epigenetic factors in the ICAM-1high/CD10low and ICAM-1high/CD10high subpopulations, using the curated EpiFactors database69. Plots are representative of n=3 biologically independent values. P-values were determined by one-sided Fisher’s exact test. e, Log2-normalized abundance of the four Brunello library sgRNAs targeting UHRF1 or DNMT1 in the input (pre-FACSort) library (gray), ICAM-1high/CD10 low population (black), ICAM-low/CD10low (light blue), and ICAM-1high/CD10high (dark blue). Significance between the input and FACSorted groups was assessed using the two-sided unpaired Student’s t test. Mean + SD from n=3 biologically independent screens is shown.
Extended Data Fig. 2
Extended Data Fig. 2. Dynamic primary B-cell UHRF1 and DNMT1 regulation by physiological or EBV stimuli.
a, Immunoblot of WCL from peripheral blood primary human B-cells that were resting or that were stimulated by Mega-CD40L (50 ng/ml), anti-IgM (1 μg/ml), CpG (0.5 μM), IgM+ CpG or CD40 + CpG for 24 hours. b, Normalized DNMT3B, DNMT3A, DNMT1 or UHRF1 mRNA levels in primary human peripheral blood B-cells at the indicated day post infection (DPI) by the EBV B95.8 strain32. Shown are the mean + SEM values from n=3 of biologically independent RNAseq datasets. c, UHRF1, DNMT1, DNMT3A and TET2 relative protein abundances detected by tandem-mass-tag-based proteomics at rest and at nine time points after EBV B95.8 infection of primary human peripheral blood B-cells at a multiplicity of infection of 0.1. DNMT3B expression was not detected. Data represent the average +/− SEM for four independent replicates8. For each protein, the maximum level detected across the time course was set to a value of one. d, Volcano plot visualization of -Log10 (p-value) statistical significance (y-axis) and Log2 fold-change in mRNA abundance (x-axis) of ex vivo GC B-cells that conditionally expressed control GFP or both LMP1 and LMP2A from an AICDA promoter, which is activated in GC B-cells. Data are from n=3 of biologically independent RNA-seq datasets34. P-value and log fold change were generated with DESeq under default settings with Wald test and Normal shrinkage, respectively. UHRF1, DNMT1, DNMT3A and DNMT3B values are highlighted. e, Normalized EBNA1 mRNA reads from RNAseq analysis of MUTU I (n=3) or Rael cells (n=2) that expressed control or UHRF1 sgRNAs, as indicated. p-values were calculated by unpaired two-sided student’s t-test with equal variance assumption. f, Immunoblot analysis of WCL from MUTU III or from MUTU I that expressed the indicated control or UHRF1 sgRNAs. Cells were harvested at the indicated day post sgRNA delivery by lentivirus transduction. Blots in a and f are representative of n=3 biologically independent replicates.
Extended Data Fig. 3
Extended Data Fig. 3. UHRF1 is necessary for silencing of latency III antigen expression.
a, Confocal immunofluoresence analysis of LMP1 or LMP2A in Rael cells with control or UHRF1 sgRNAs. Nuclei are counterstained with Hoechst 33342. Scale bar, 10μm. Images are representative of n=3 biologically independent experiments. b, Confocal immunofluoresence analysis of EBNA2 in Rael cells with control or UHRF1 sgRNAs. Nuclei are counterstained with Hoechst 33342. Scale bar, 10μm. Images are representative of n=3 biologically independent experiments.
Extended Data Fig. 4
Extended Data Fig. 4. UHRF1 depletion induces latency III and induces ICAM-1 in EBV+ but not EBV- B-cells.
a, Volcano plot visualization of -Log10 (p-value) statistical significance (y-axis) and Log 2 (fold-change in mRNA abundance) in Rael cells that expressed control or UHRF1 sgRNAs. Data are from n=2 of biologically independent RNA-seq datasets. P-value and log fold change were generated with DESeq under default settings with Wald test and Normal shrinkage, respectively. Values for selected genes upregulated (red) or downregulated (blue) by UHRF1 sgRNA are highlighted. b, Enrichr pathway analysis of gene sets significantly upregulated in MUTU III versus MUTU I (gray bars), or by UHRF1 versus control sgRNA expression in MUTU I (black bars) or Rael (blue bars). Shown are the adjusted p-values from Enrich analysis of triplicate RNAseq datasets using Fisher exact test. See alsoExtended Data Table 5. c, Heatmap representation of abundances of mRNAs encoding latency III antigens in Rael BL with control or UHRF1 sgRNAs. Shown are data from n=2 biologically independent replicates. d, FACS analysis of total cell ICAM-1 and LMP1 expression in Rael cells with control (left) or UHRF1 sgRNA #2 (right). e, Immunoblot analysis of WCL from EBV- (left) or EBV+ Akata BLs with the indicated sgRNA expression. f, FACS analysis of plasma membrane ICAM-1 expression in the indicated cell lines with control or UHRF1 sgRNA #2 expression. KEM I and Rael are EBV+ BL. REH is an EBV-negative B-cell acute lymphoblastic leukemia cell line. Shown below are immunoblots of WCL from KEM I BLs with the indicated sgRNA expression. All FACS plots and blots are representative of n=3 biologically independent replicates.
Extended Data Fig. 5
Extended Data Fig. 5. MeDIP analysis of promoter CpG methylation in LCLs or in CRISPR edited BL treated with acyclovir.
a. 5 mC MeDIP was performed on DNA from GM12878 (black bars), GM11830 (gray bars) or GM12881 LCLs (blue bars) followed by qPCR for the Qp, Cp, Wp or LMP1p. Mean ± SEM for n=3 of biologically independent replicates are shown. p-values were calculated using two-way ANOVA with Turkey’s multiple comparisons test. b, FACS plots of PM gp350 and ICAM-1 abundances in MUTU I cells that expressed the indicated sgRNAs and that were treated with acyclovir (50 μg/ml) to block new EBV genome synthesis by the viral polymerase. The indicated populations from sgControl versus sgUHRF1 expressing cells were sorted and used for 5 mC MeDIP-qPCR analysis. n=3 biologically independent experiments. c, 5 mC MeDIP was performed on chromatin from sorted sgControl (black bars) or sgUHRF1 (gray bars) followed by qPCR for Cp, Wp or Qp. Mean ± SEM for n=3 biologically independent replicates are shown. p-values were calculated by unpaired two-sided student’s t-test with equal variance assumption. d, 5 mC MeDIP was performed on chromatin from sorted sgControl (black bars) or sgUHRF1 (gray bars) followed by qPCR for the host STAT3 or TRAF1 promoters (n=3 of biologically independent experiments). Shown also are normalized mRNA reads from n=3 of biologically independent RNAseq datasets of MUTU I expressing control or UHRF1 sgRNAs. p-values were calculated by unpaired two-sided student’s t-test with equal variance assumption.
Extended Data Fig. 6
Extended Data Fig. 6. UHRF1 depletion induced lytic reactivation in a small percentage of cells.
a, FACS analysis of ICAM-1 and gp350 plasma membrane abundances in MUTU I cells with control or UHRF1 sgRNAs. DN = double negative. Plots are representative of n=3 biologically independent replicates. b, Immunoblot analysis of WCL from the indicated populations of FACSorted MUTU I cells, representative of n=3 biologically independent replicates. c, Heatmap of EBV gene expression in the indicated FACSorted MUTU I populations. Heatmap values displace Z-score values of mRNAs of EBV lytic genes, which describe the standard deviation variation from the mean value of each gene. Individual data from n=3 biologically independent samples are shown. d, Principal component (PC) analysis of mRNA expression in sorted MUTU I populations. RNAseq of n=3 biologically independent replicates was performed. e-g 5 mC MeDIP was performed on chromatin isolated from MUTU I cells followed by qPCR using primers specific for Zp (e), Qp (f), or Wp (g). Mean ± SEM are shown for n=3 biologically independent replicates. p-values were calculated using one-way ANOVA with Sidak’s multiple comparisons test.
Extended Data Fig. 7
Extended Data Fig. 7. Effects of UHRF1 or DNMT1 depletion in EBV+ primary effusion lymphoma, gastric carcinoma or nasopharyngeal carcinoma cells.
a, Immunoblot analysis of WCL from EBV+ and KSHV+ primary effusion cell line JSC-1 that expressed the indicated control, UHRF1 or DNMT1 sgRNAs or from MUTU III WCL as a control. b, 5 mC MeDIP analysis of chromatin from JSC-1 expressing control or UHRF1 sgRNA #2 followed by qPCR using primers specific for Cp or LMP1p. Mean ± SEM are shown for n=3 biologically independent replicates. p-values were calculated by unpaired two-sided student’s t-test with equal variance assumption. c, Immunoblot analysis of WCL from EBV+ NUGC3 gastric carcinoma cells that expressed the indicated sgRNAs. Quantification of EBNA2:GAPDH and LMP1:GAPDH ratios are indicated. d, Immunoblot analysis of WCL from EBV+ C666.1 nasopharyngeal carcinoma (NPC) cells that expressed the indicated control or UHRF1 sgRNAs or from MUTU III as a control. e, Immunoblot analysis of WCL from EBV+ C666.1 nasopharyngeal carcinoma (NPC) cells that expressed the indicated control or DNMT1 sgRNAs or from MUTU III as a control. f, 5mC MeDIP analysis of chromatin from C666.1 cells that expressed sgControl (gray boxes) or sgUHRF1 (black boxes) followed by qPCR using primers specific for Cp or LMP1p. Mean ± SEM are shown for n=3 biologically independent replicates. p-values were calculated by unpaired two-sided student’s t-test with equal variance assumption. Blots in a, c, d, and e are representative of n=3 biologically independent replicates.
Extended Data Fig. 8
Extended Data Fig. 8. Initiator DNA methyltransferase expression in human tonsil B-cell subsets and overexpression effects on LCL growth and survival.
a. DNMT3A and 3B mRNA expression in published microarray analysis of human tonsil B-cell naïve, GC, memory or plasma cell subsets53. b, Propidium iodide (PI) cell cycle analysis of GM12878 LCLs that expressed control GFP, DNMT3A or DNMT3B. Data are representative of n=2 biologically independent replicates. c, Percentages of the indicated cell populations in GM12878 that expressed GFP, DNMT3A or DNMT3B. Data are the average of n=2 biologically independent replicates. d, qPCR analysis of LMP1 mRNA abundances in GM12878 that expressed the indicated GFP, DNMT3A or DNMT3B cDNAs. Mean ± SEM from n=3 biologically independent replicates are shown. p-values were calculated using one-way ANOVA with Turkey’s multiple comparisons test. e, Immunoblot analysis of WCL from GM11380 LCLs that expressed GFP, DNMT3A or DNMT3B cDNAs, as indicated. f, Immunoblot analysis of WCL from MUTU III that expressed GFP, DNMT3A or DNMT3B cDNAs. g, Normalized MUTU III live cell numbers at the indicated timepoints after expression of GFP, DNMT3A or DNMT3B. Mean ± SEM from n=3 biologically independent replicates are shown. p-values were calculated by two-sided student’s t-test with equal variance assumption. h, 5 mC MeDIP analysis of chromatin from GM12878 expressing GFP (gray box), DNMT3A (blue box) or DNMT3B (black box) followed by qPCR using a second primer set specific for LMP1p (from the same experiment as in Fig. 4f). Mean ± SEM are shown for n=3 biologically independent replicates. p-values were calculated using two-way ANOVA with Sidak’s multiple comparisons test. i, Immunoblot analysis of WCL from MUTU I, from the EBV+/KSHV+ PELs JSC-1 or BC-1, or from the EBV-/KSHV+ PEL BCBL-1. Blots in e, f, and i are representative of n=3 biologically independent replicates.
Extended Data Fig. 9
Extended Data Fig. 9. PRC1 is a BL host factor important for silencing of LMP1 and LMP2a expression.
a, Volcano plots showing the -Log10 (p-value) statistical significance (y-axis) and Log2 fold-change (x-axis) calculated by STARS analysis of sgRNA abundance in the input versus FACSorted ICAM-1high/CD10low population. Values for genes encoding the PRC1 subunits SCML2 and RING1 are highlighted in blue, and values for genes encoding UHRF1 and DNMT1 are shown in purple for comparison. n=3 of biologically independent replicates. P-values were determined by one-sided Fisher’s exact test. b, Mean + SEM normalized SCML2 mRNA reads from triplicate RNAseq analysis of MUTU I versus III (left) or of MUTU I that expressed control or UHRF1 sgRNA (right). n=3 of biologically independent replicates. p-values were calculated by unpaired two-sided student’s t-test with equal variance assumption. c, Immunoblot analysis of WCL from MUTU III or from MUTU1 that expressed the indicated sgRNAs. d, qPCR analysis of EBNA3C expression. Values were normalized by 18s rRNA qPCR levels and the ratio in control cells was set to 1. Mean ± SEM from n=3 biologically independent replicates are shown. p-values were calculated using one-way ANOVA with Sidak’s multiple comparisons. , Immunoblot analysis of WCL from MUTU III or Daudi that expressed the indicated sgRNAs. f, Fold change of the LMP1:GAPDH immunoblot ratio (left) or BCL6:GAPDH immunoblot ratio (right) from n=3 of biologically independent replicates, as in ED Fig. 9e. p-values were calculated using one-way ANOVA with Sidak’s multiple comparisons. g, Immunoblot analysis of WCL from MUTU III or from REH acute lymphoblastic leukemia EBV-negative B-cells or from Akata EBV-negative BL expressing the indicated sgRNAs. h, Immunoblot analysis of WCL from MUTU I that expressed the indicated sgRNAs. i, Normalized IRF4 mRNA reads from n=3 of biologically independent triplicate RNAseq datasets of MUTU I cells that expressed sgControl or sgUHRF1. p-values were calculated by unpaired two-sided student’s t-test with equal variance assumption. Blots in c, e, g and h are representative of at least 3 biologically independent replicates.
Extended Data Fig. 10
Extended Data Fig. 10. PRC1 effects on latency III expression and EBV H2Ak119 monoubiquitylation.
a, Immunoblot analysis of WCL from GM12878 LCLs that expressed GFP versus RING1 cDNAs or from MUTU I or III as controls. b, FACS analysis of PM abundances of LMP1/NF-kB targets Fas/CD95 (left) and ICAM-1 (right) in GM21878 LCL expressing GFP (blue) versus RING1 (red). c, ChIP analysis of chromatin from MUTU 1 (black bar) or MUTU III (blue bar) using control IgG versus anti-H2A lysine 119 monoubiquitin (H2AK119Ub) followed by qPCR with primers specific for LMP1p, LMP2p or Cp. Mean ± SEM from n=3 biologically independent replicates are shown, p-values were calculated by unpaired two-sided student’s t-test with equal variance assumption. d, Schematic model of PRC1 complex-mediated ubiquitination of chromatin. a and b are representative of n=3 biologically independent replicates.
Fig. 1
Fig. 1. CRISPR/Cas9 Screen for host factors that maintain latency I in BL.
a, CRISPR/Cas9 screen workflow. Cas9+ MUTU I BL cells transduced with the Brunello sgRNA library, puromycin selected and then FACSorted at 8 days post-transduction. N=3 of biologically independent screen replicates were performed. b, Volcano plots showing the -Log10(p-value) statistical significance (y-axis) and Log2 fold-change (x-axis) calculated by STARS analysis of sgRNA abundance in the input versus FACSorted ICAM-1high/CD10low (left), ICAM-1high/CD10high (middle), and ICAMlow/CD10low (right) populations. Top screen hits are highlighted in purple. n=3 of biologically independent replicates. P-values were determined by one-sided Fisher’s exact test.
Fig. 2
Fig. 2. UHRF1 is necessary for Latency III oncoprotein restriction in BL
a, FACS analysis of plasma membrane (PM) ICAM-1 abundance in MUTU I with indicated sgRNAs. b, Immunoblot analysis of whole cell lysates (WCL) of MUTU I with indicated sgRNAs. MUTU III WCL was used as a positive control. c, Heatmap visualization of RNAseq mRNA abundances of MUTU I cells with indicated sgRNAs. Z-scores describe normalized read count positions in terms of distance from the mean in the standard deviation unit. d, Phase microscopy images of Rael BL expressing control (top) or UHRF1 (middle) sgRNAs or GM12878 LCLs. Scale bar, 100 μm. e, RNAseq volcano plot of -Log10 (p-value) statistical significance and Log2 fold-change mRNA abundance in MUTU III versus MUTU I cells. Selected genes induced in MUTU III (red dots) versus MUTU I (blue dots) are highlighted. f, RNA-seq volcano plot of -Log10 (p-value) statistical significance versus Log2 fold-change in mRNA abundance of MUTU I cells with indicated sgRNAs. Selected genes highly induced in UHRF1 sgRNA (red dots) versus in control sgRNA cells (blue dots) are highlighted. g, FACS analysis of PM ICAM-1 in EBV negative or positive Akata BL with indicated sgRNA expression. h, Model of UHRF1 and DNMT1 roles at newly synthesized DNA. Interaction between UHRF1 UBL and hemimethylated DNA (yellow ball), PHD and histone H3 tail, TTD and H3K9me2/3 (green ball) and RING domain-mediated H3, K18, and K23 monoubiquitination (purple balls) are shown. i, Model of UHRF1 and truncation mutants. Deletions are indicated by dotted lines. j, FACS analysis of PM ICAM-1 mean fluorescence intensity (MFI) in MUTU I with indicated sgRNA and GFP, full-length (FL) or deletion mutant UHRF1 rescue constructs, as indicated. Mean + SD from n=3 technical replicates. Data are representative of n=2 biologically independent experiments. k, Immunoblot analysis of WCL from MUTU I cells with GFP, FL or domain truncated UHRF1 together with indicated sgRNAs. Data were from n=3 biologically independent replicates except where indicated. Blots in b and k and FACS plots in a and g were representative of n=3 biologically independent experiments. P-value and log fold change in e-g were generated with DESeq under default settings with Wald test and Normal shrinkage, respectively.
Fig 3.
Fig 3.. UHRF1 maintains EBV latency promotor methylation.
a, Schematic diagram of EBV latency Cp, Wp and Qp promotor usage in latency I (left) versus latency III (right). Brown circle indicates DNA CpG methylation, red “x” indicates epigenetically blocked transcription. b, ChIP for UHRF1 or H3K9me3 was performed on chromatin from MUTU I (blue columns) or MUTU III (gray columns) followed by qPCR with primers specific for Cp, LMP1p, LMP2p or Qp. Mean ± SEM are shown for n=3 biologically independent replicates are shown. p-values were calculated by two-way ANOVA with Sidak’s multiple comparisons test. c, MeDIP was performed on DNA from MUTU III (gray bars) or in MUTU I (blue bars) that expressed control or independent UHRF1 sgRNAs followed by qPCR with primers specific for Cp, Wp, LMP1p, LMP2p or Qp. Mean ± SEM for n=3 biologically independent replicates are shown. p-values were calculated using one-way ANOVA with Sidak’s multiple comparisons test.
Fig. 4
Fig. 4. DNMT1 depletion causes Cp and LMPp demethylation and de-repression of Latency III
a, FACS analysis of PM ICAM-1 abundance in MUTU I (left) or Rael (right) BL expressing control or DNMT1 sgRNAs. b, Immunoblot analysis of WCL from MUTU I (left) or Rael (right) BL that expressed control or independent DNMT1 sgRNAs. * marks a non-specific band in the EBNA2 immunoblot. MUTU III WCL was used as positive controls. c, 5 mC MeDIP was performed on DNA from MUTU III or MUTU I that expressed control or independent DNMT1 sgRNAs followed by qPCR for Cp (left) or LMP1p (right). Shown are the mean ± SEM for n=3 biologically independent replicates. p-values were calculated using one-way ANOVA with Sidak’s multiple comparisons test. d, Immunoblot analysis of WCL from GM12878 LCLs that stably expressed control GFP, DNMT3A or DNMT3B. e, Growth curve analysis of GM12878 LCLs that stably expressed control GFP, DNMT3A or DNMT3B cDNAs. Mean ± SEM are shown for n=3 biologically independent replicates. p-values were calculated using two-way ANOVA with Turkey’s multiple comparisons test. f, 5 mC MeDIP was performed on DNA from GM12878 LCLs that expressed control GFP (black bars), DNMT3A (gray bars) or DNMT3B (blue bars) followed by qPCR for the Cp, Wp or LMP1p. Mean ± SEM for n=3 biologically independent replicates are shown. p-values were calculated using one-way ANOVA with Sidak’s multiple comparisons test. g, Model of epigenetic initiation versus maintenance of DNA CpG methylation as EBV-infected B-cells progress from latency III to I. DNMT3B initiates CpG methylation, which is subsequently maintained by UHRF1/DNMT1. Gray circle, unmethylated CpG site; orange circle, methylated CpG site. FACS plots in 4a and blots in 4b and c are representative of at least n=3 biologically independent replicates.
Fig. 5.
Fig. 5.. UHRF1 and DNMT1 maintenance of DNA methylation is important for silencing BL LMP1 and 2A expression in the absence of EBNA2.
a, Immunoblot analysis of WCL from MUTU III or from P3HR-1 BL that expressed the indicated control, UHRF1 or DNMT1 sgRNAs. P3HR-1 harbor EBNA2-deleted EBV genomes that preclude Cp-activated latency III expression. b, 5 mC MeDIP was performed on DNA from P3HR-1 BL that expressed control sgRNA (black bars), UHRF1 sg2 (gray bars) or DNMT1 sg2 (blue bars), followed by qPCR for Cp or LMP1p. Mean ± SEM for n=3 biologically independent replicates are shown. p-values were calculated by calculated using one-way ANOVA with Sidak’s multiple comparisons test. c, Immunoblot analysis of WCL from MUTU III or from Daudi BL that expressed the indicated control, UHRF1 or DNMT1 sgRNAs. Daudi cells harbor EBNA2-deleted EBV genomes that preclude Cp-activated latency III expression. d, 5 mC MeDIP was performed on DNA from Daudi BL that expressed control sgRNA (black bars), UHRF1 sg2 (gray bars) or DNMT1 sg2 (blue bars) followed by qPCR for the Cp or LMP1p. Mean ± SEM for n=3 biologically independent replicates are shown. p-values were calculated by paired two-sided student’s t-test with equal variance assumption. e, Confocal immunofluorescence analysis of LMP1 or LMP2A expression in Daudi BL with control or UHRF1 sgRNAs. Nuclei are stained by Hoechst. White scale bar indicates 100 μM.
Fig. 6.
Fig. 6.. DNA methylation and PRC1-mediated histone ubiquitylation non-redundantly control latent membrane protein expression.
a, Immunoblot analysis of WCL from MUTU III or from MUTU I that expressed control or independent RING1 sgRNAs. b, Confocal immunofluorescence analysis of LMP1 or LMP2A expression in MUTU I cells with control or UHRF1 sgRNAs. Nuclei are stained by Hoechst. White scale bar indicates 50 μm. c, ChIP using control IgG versus anti-H2Ak119Ub antibody was performed on DNA from MUTU I with control (black bars) or RING1 (blue bars) sgRNAs followed by qPCR for the LMP1, LMP2 or C promoters. Shown are the mean ± SEM values from n=3 biologically independent replicates. p-values were calculated by calculated using two-way ANOVA with Sidak’s multiple comparisons test. d, Schematic germinal center model of EBV latency gene epigenetic regulation. Wp and subsequently Cp drive EBNA expression in newly infected cells. UHRF1 and DNMT1 are upregulated early after infection, but EBNA2 also upregulates the TET2 DNA demethylase, which limits DNA methylation. The initiator methyltransferase DNMT3B is not yet expressed, thereby allowing EBV C promoter activation. As MYC levels diminish, LMP promoters are activated and latency III becomes operative. Latency III cells migrate to GCs, where the initiator DNMT3B is induced and where DNMT1 and UHRF1 levels increase. DNMT3b-mediated Cp methylation silences expression of all EBNAs except EBNA1, which instead becomes expressed from Qp. TET2 levels decrease with EBNA2 silencing, further supporting EBV genomic DNA methylation. As infected cells differentiate into memory B-cells, DNA methylation and PRC1-mediated H2AK119Ub1 jointly silence the LMP promoters, allowing transition to latency I, where Qp drives the EBNA1-only program. UHRF1 and DNMT1 maintain DNA methylation in latency I and PRC1 maintains H2AK119UB1, enforcing Cp, Wp and LMPp silencing. Blots in 6a, b and images in 6e are representative of at least n=3 biologically independent replicates.

References

    1. Longnecker RM, Elliott K; Cohen Jeffrey I. Epstein-barr virus Fields Virology Sixth Edition Vol. 1 Wolters Kluwer Health Adis (ESP) (2013).
    1. Cohen JI Epstein-Barr virus infection. N Engl J Med 343, 481–492, doi: 10.1056/nejm200008173430707 (2000). - DOI - PubMed
    1. Thorley-Lawson DA EBV Persistence--Introducing the Virus. Current topics in microbiology and immunology 390, 151–209, doi: 10.1007/978-3-319-22822-8_8 (2015). - DOI - PMC - PubMed
    1. Price AM & Luftig MA To Be or Not IIb: A Multi-Step Process for Epstein-Barr Virus Latency Establishment and Consequences for B Cell Tumorigenesis. PLOS Pathogens 11, e1004656, doi: 10.1371/journal.ppat.1004656 (2015). - DOI - PMC - PubMed
    1. Woellmer A & Hammerschmidt W Epstein-Barr virus and host cell methylation: regulation of latency, replication and virus reactivation. Current opinion in virology 3, 260–265, doi: 10.1016/j.coviro.2013.03.005 (2013). - DOI - PMC - PubMed

Publication types

MeSH terms