. 2020 Jun;52(6):626-633.
doi: 10.1038/s41588-020-0625-2. Epub 2020 May 18.

Quantifying genetic effects on disease mediated by assayed gene expression levels

Affiliations

Quantifying genetic effects on disease mediated by assayed gene expression levels

Douglas W Yao et al. Nat Genet. 2020 Jun.

Abstract

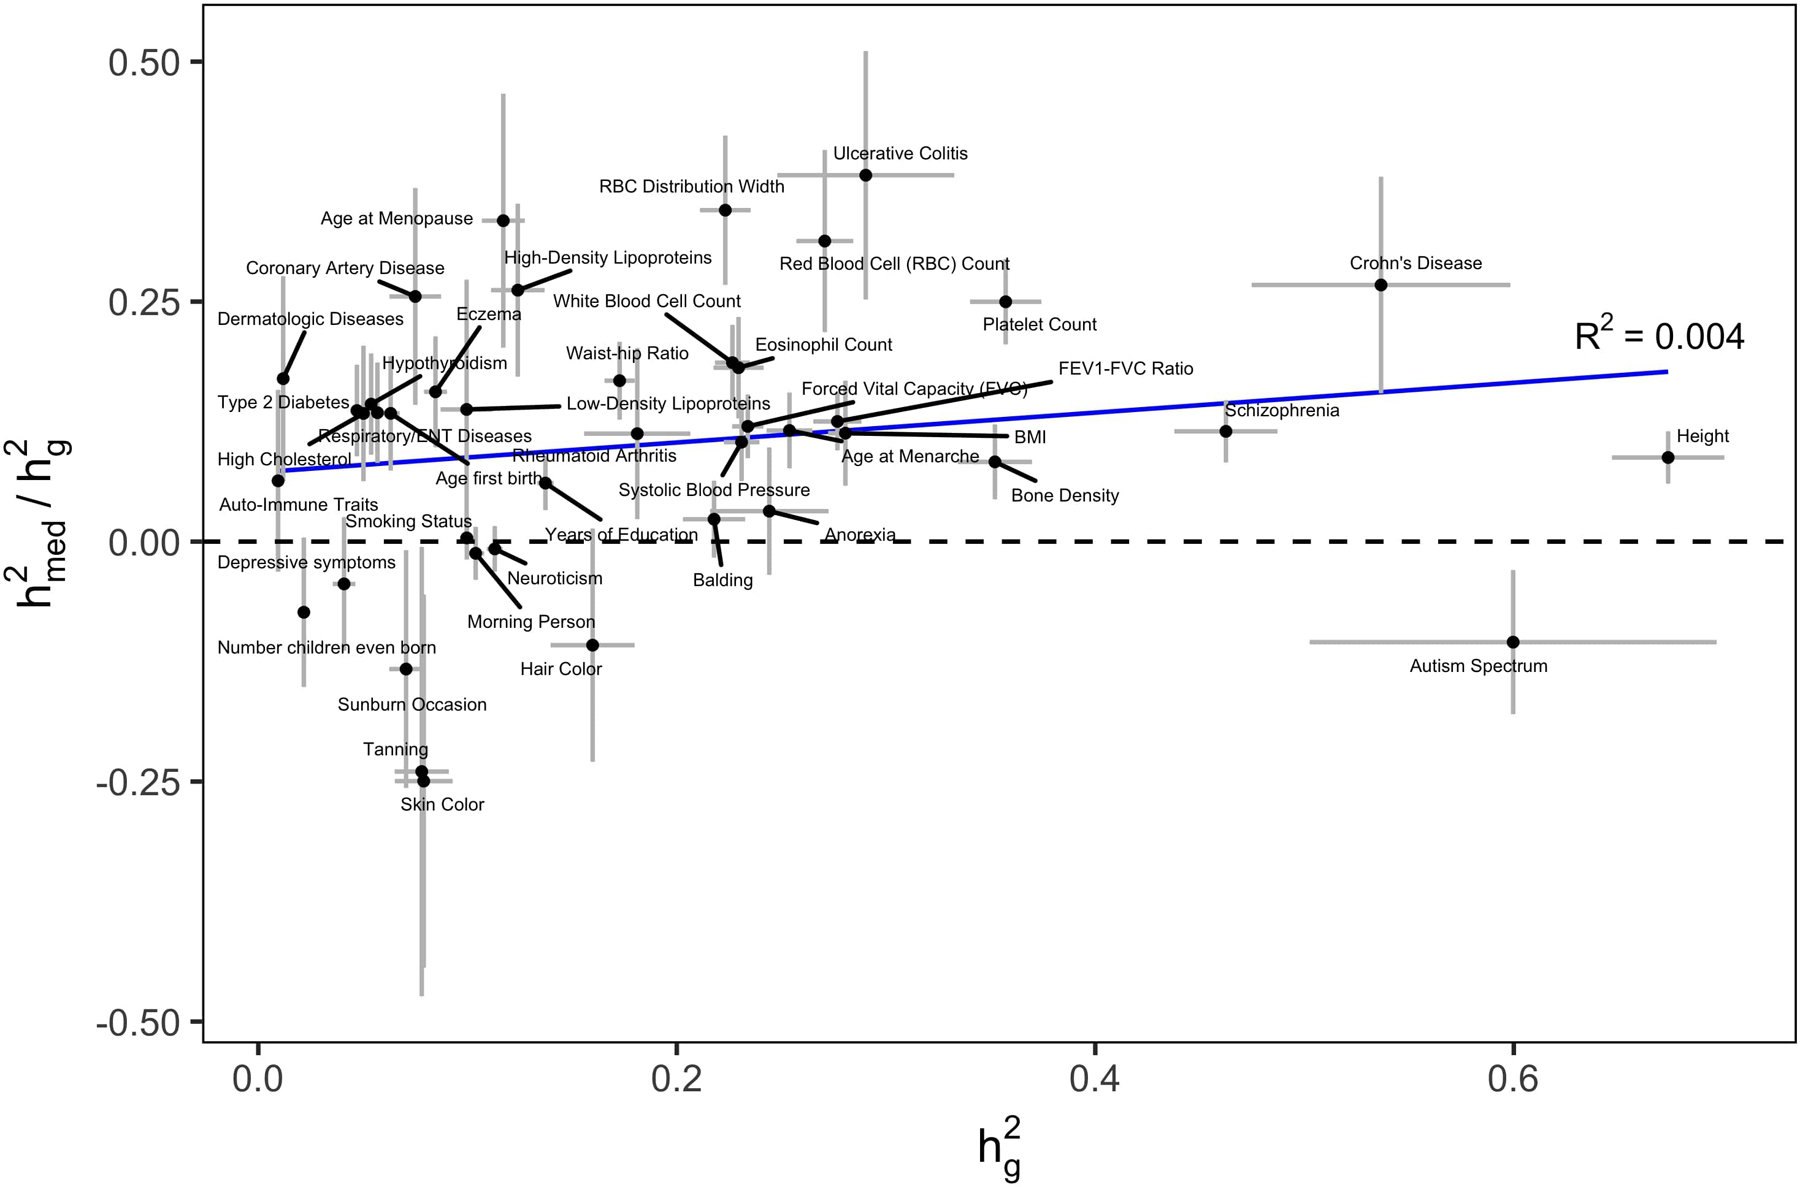
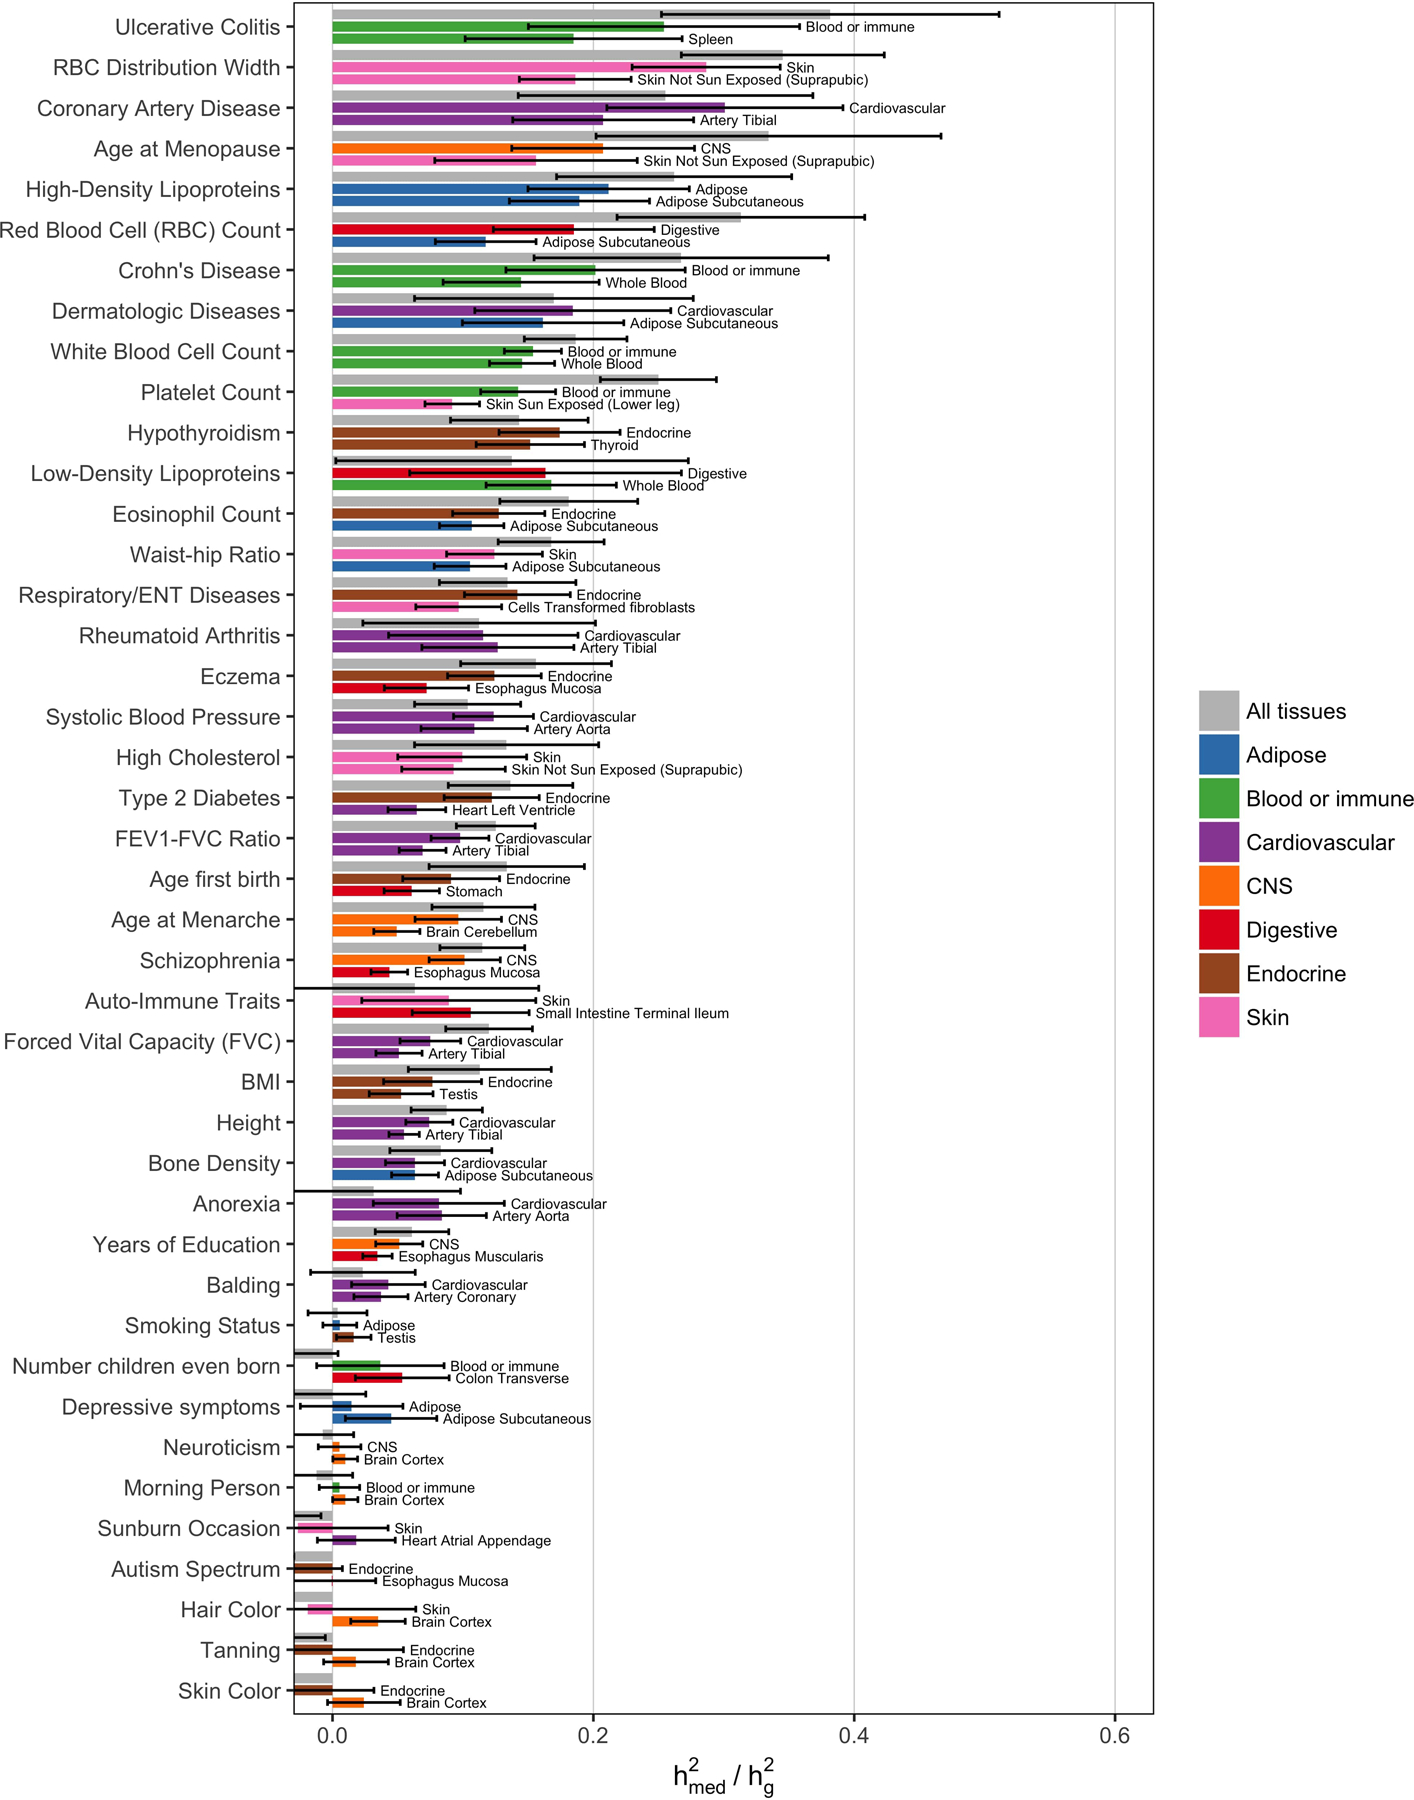
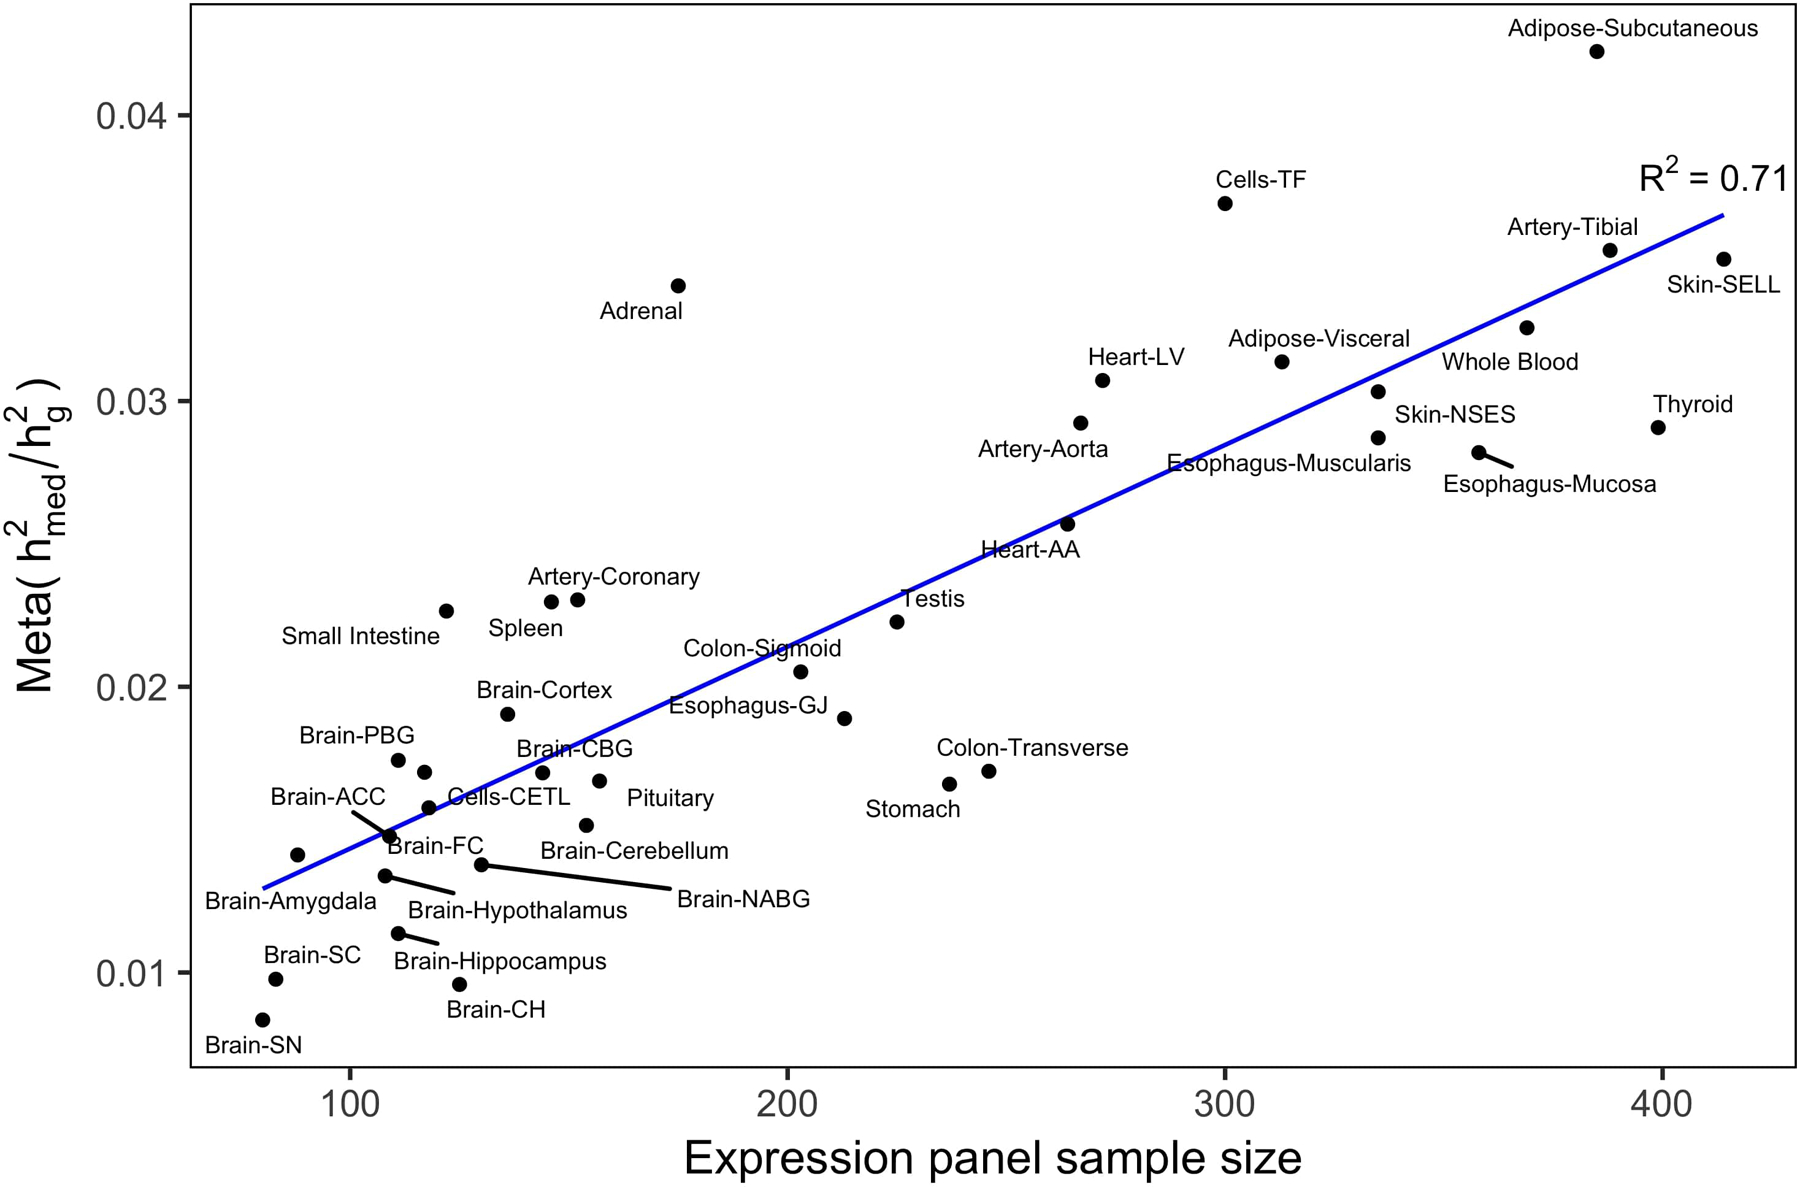
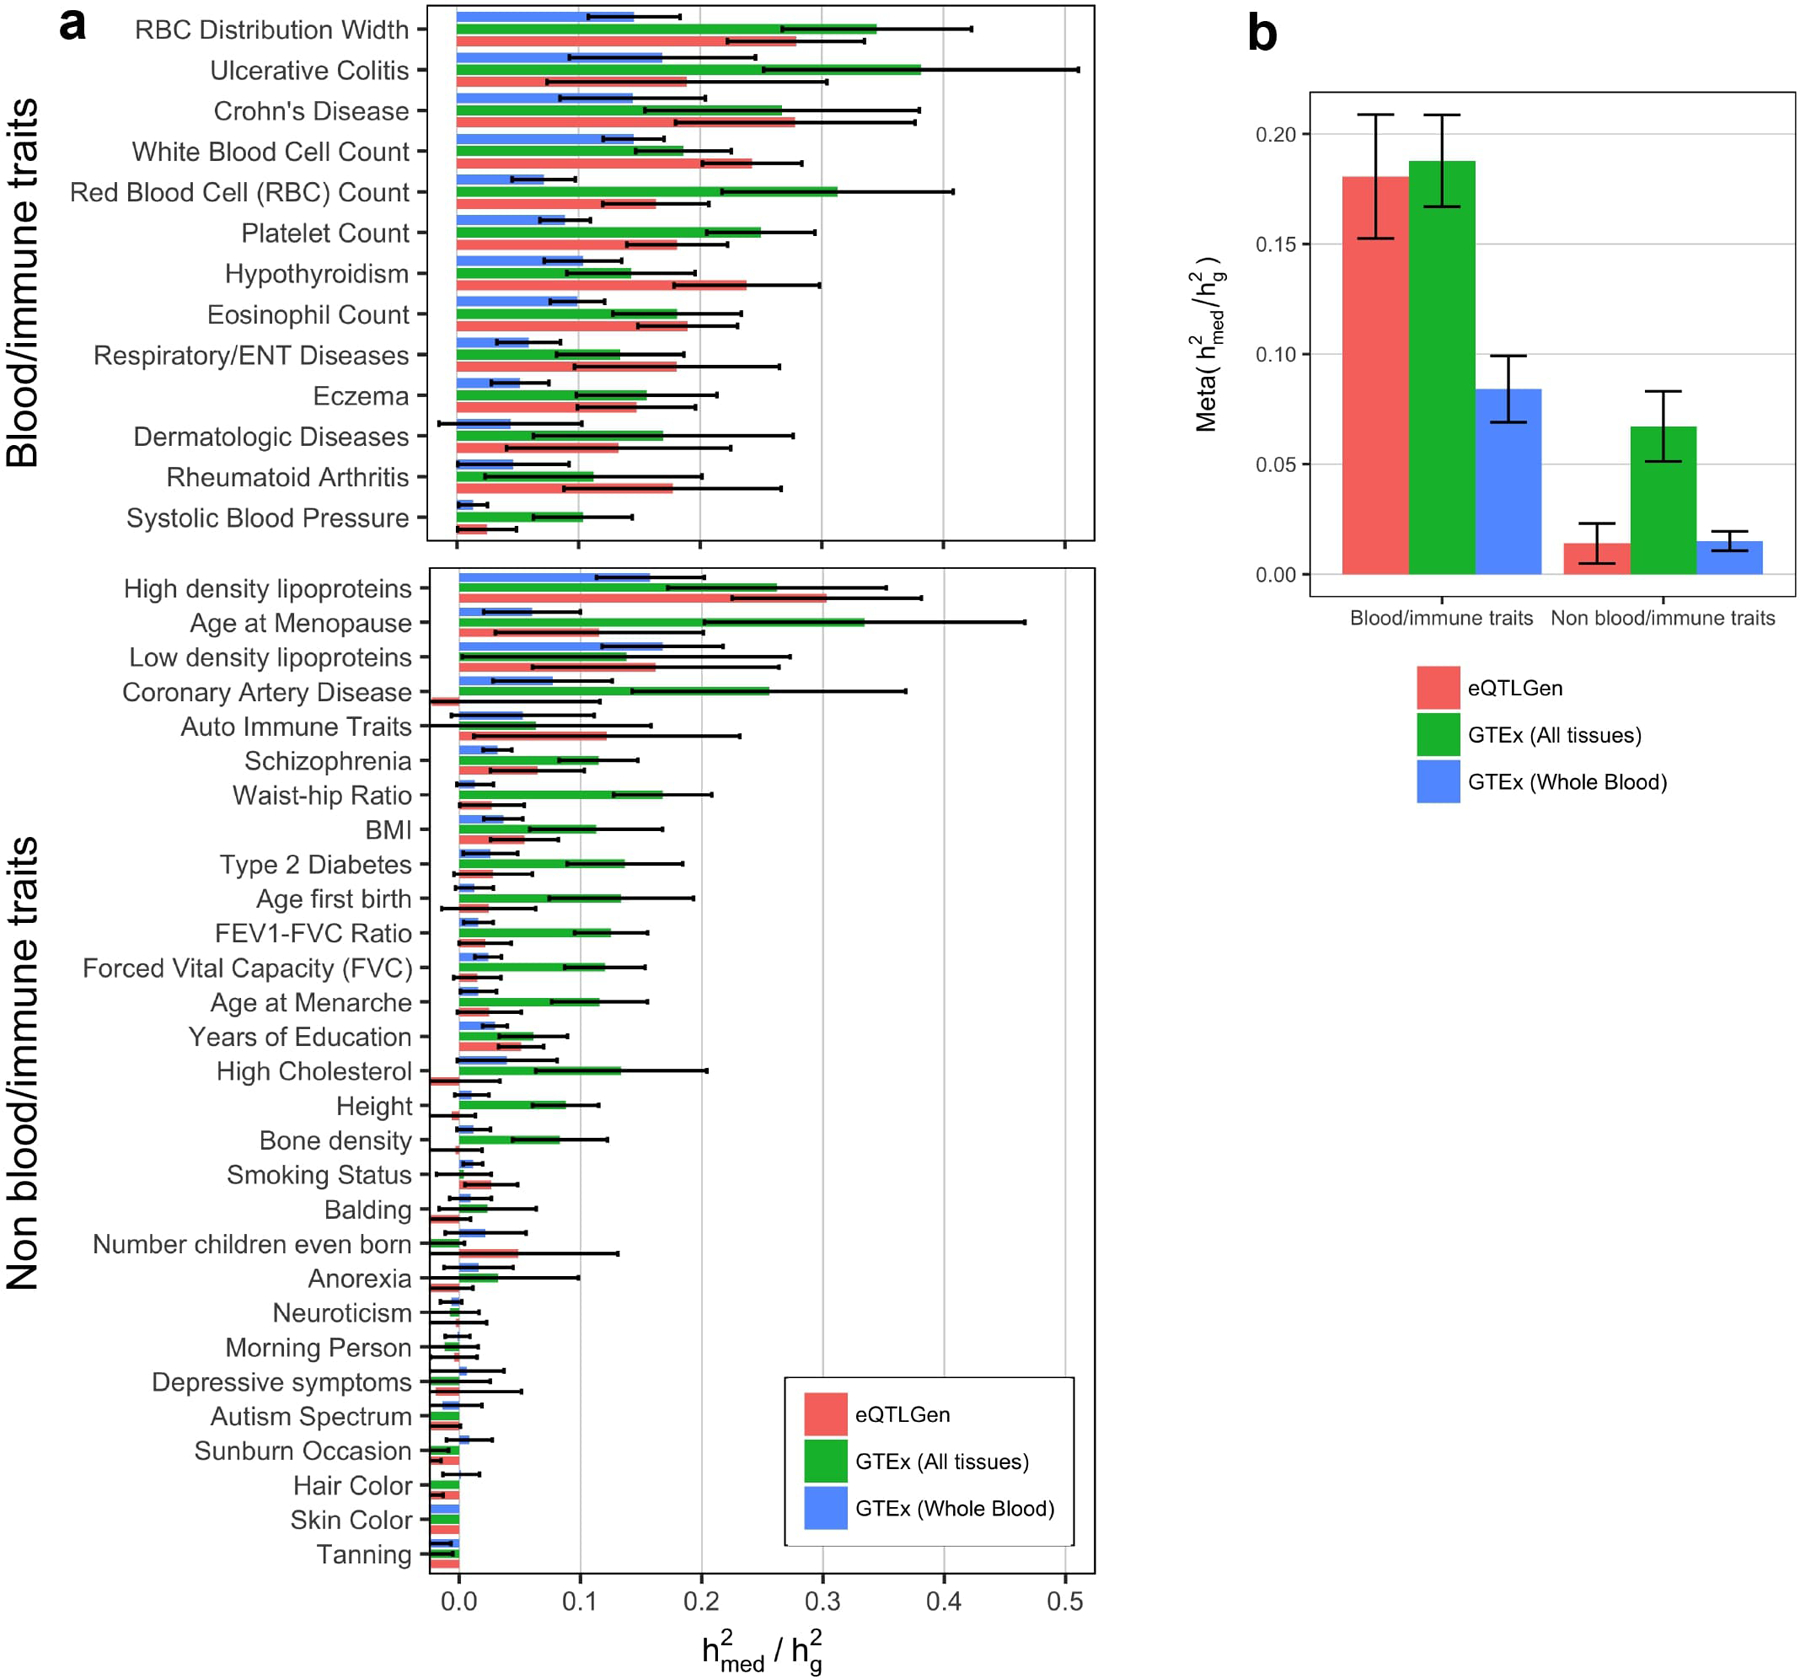
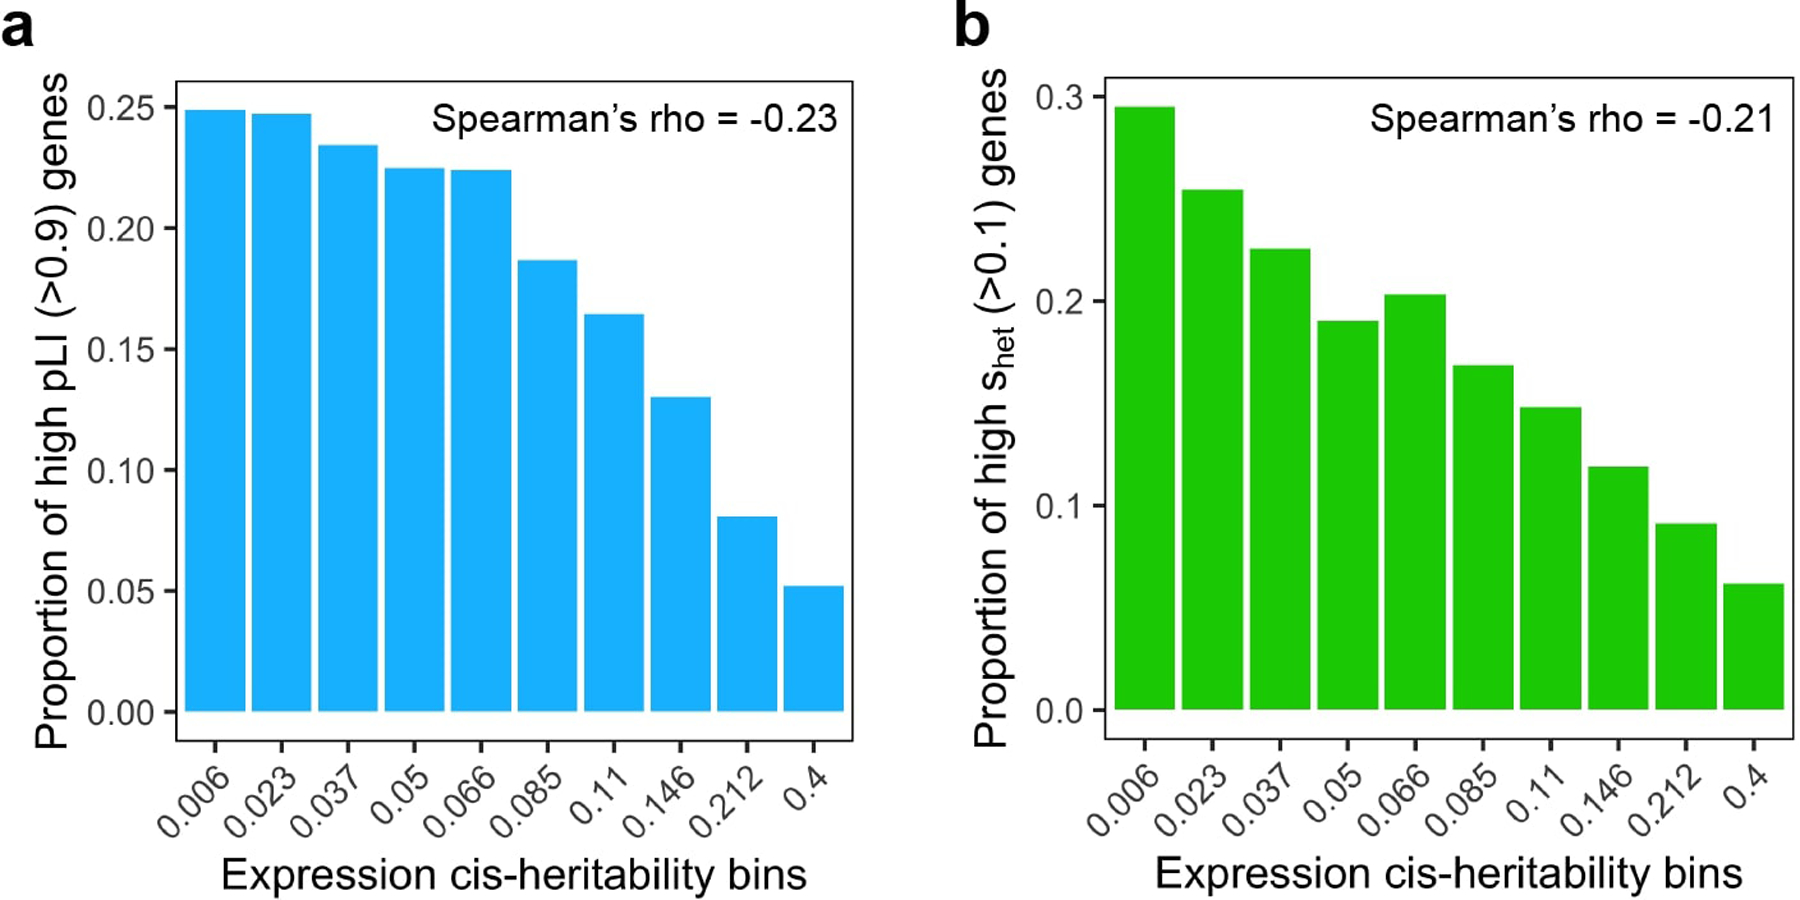
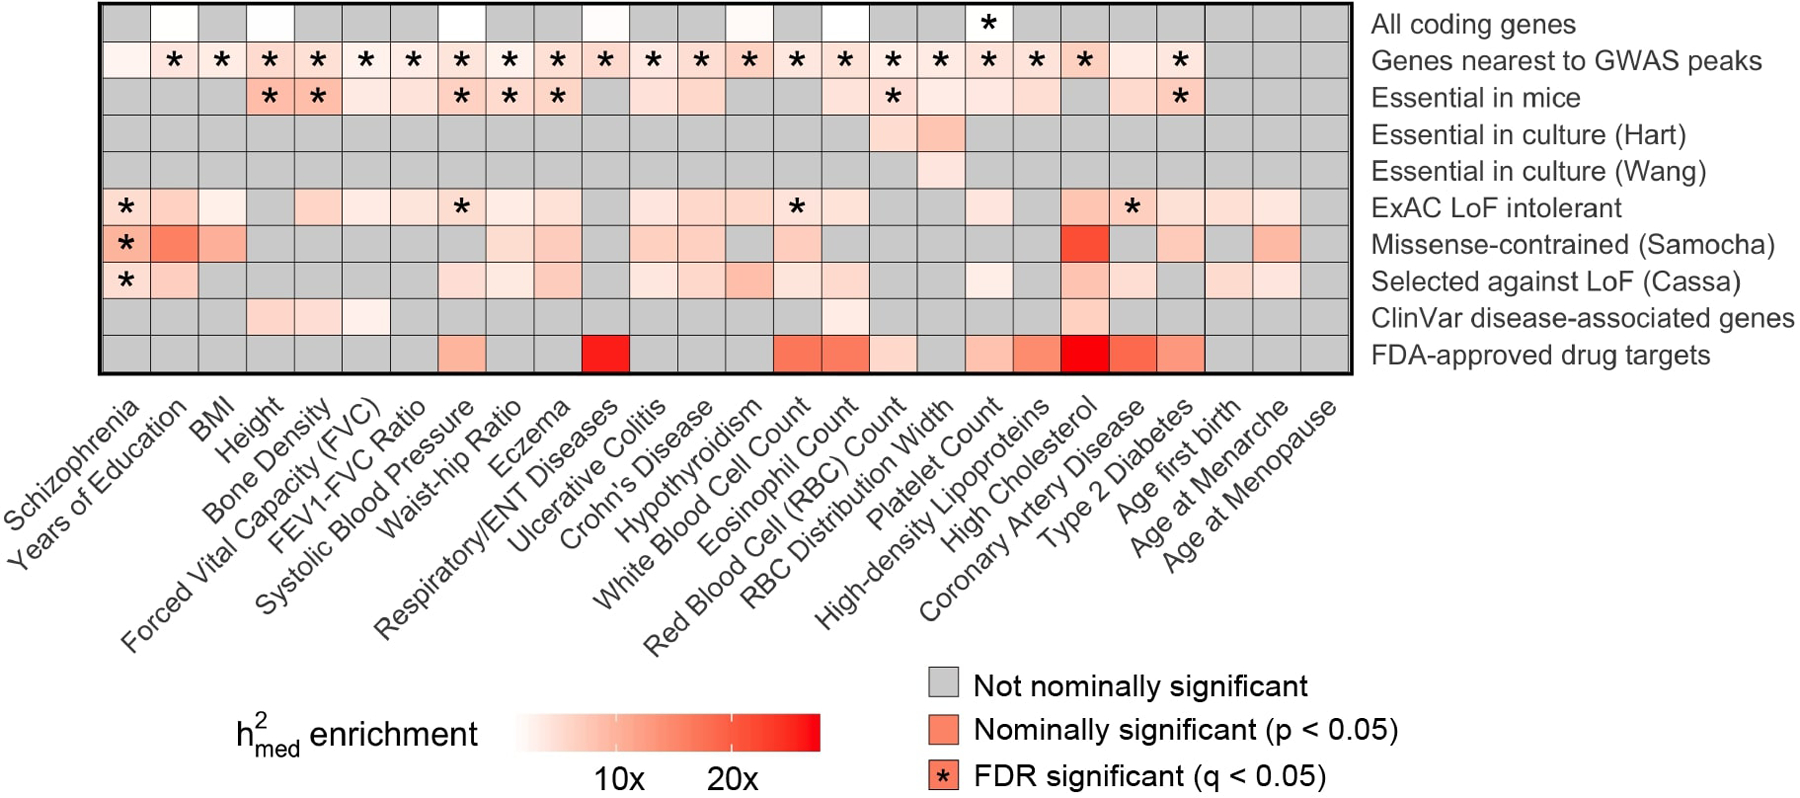
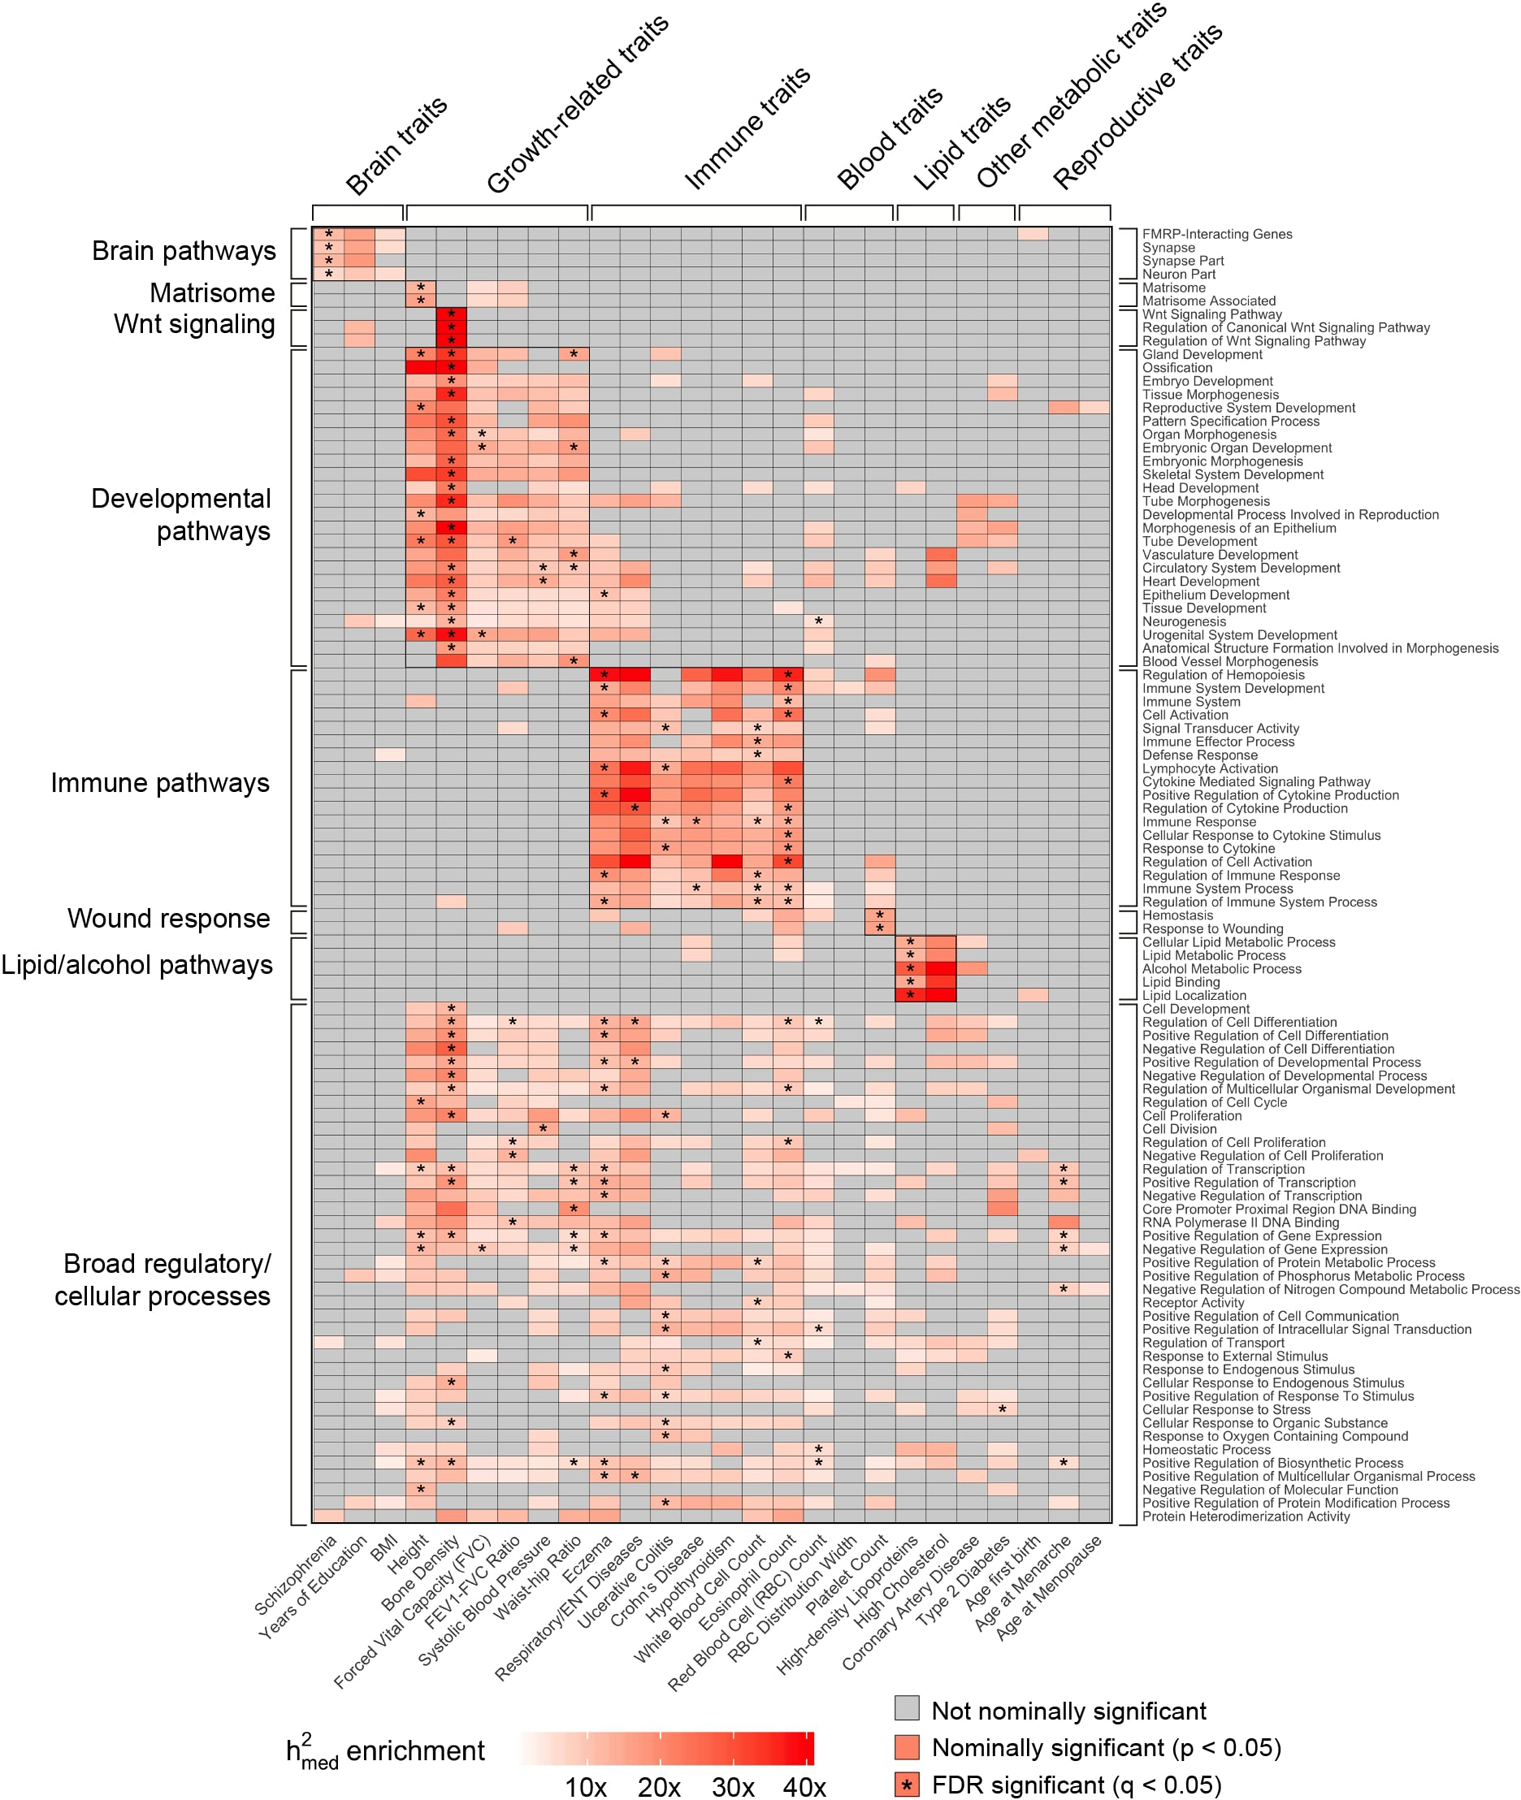
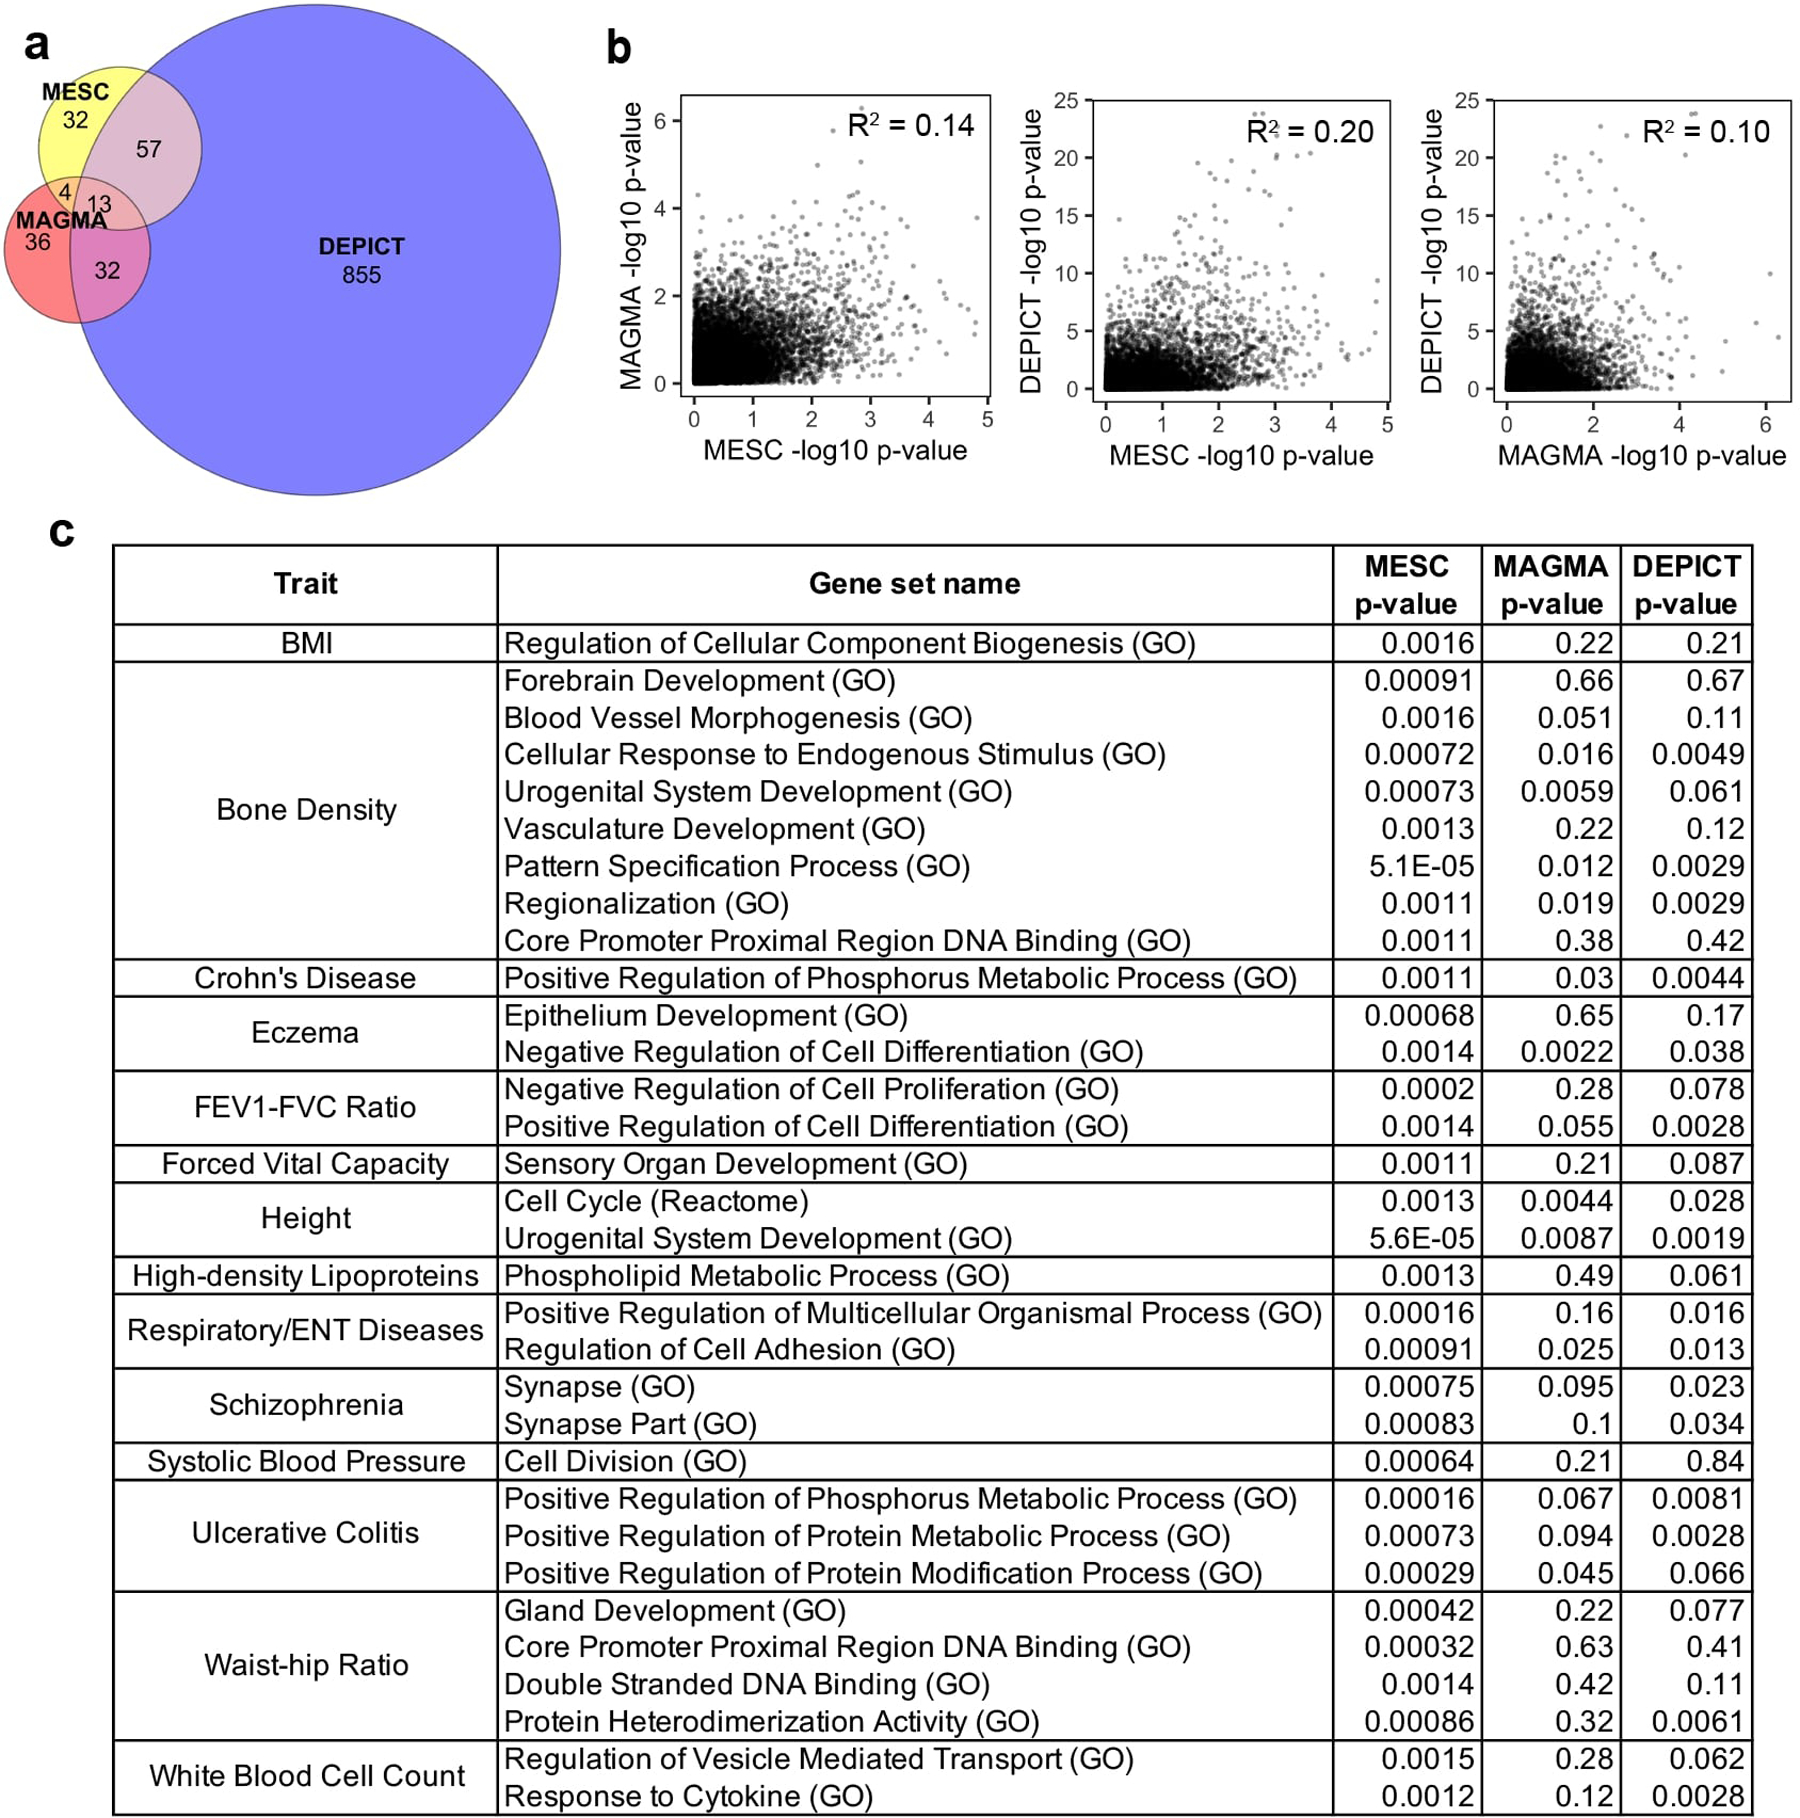
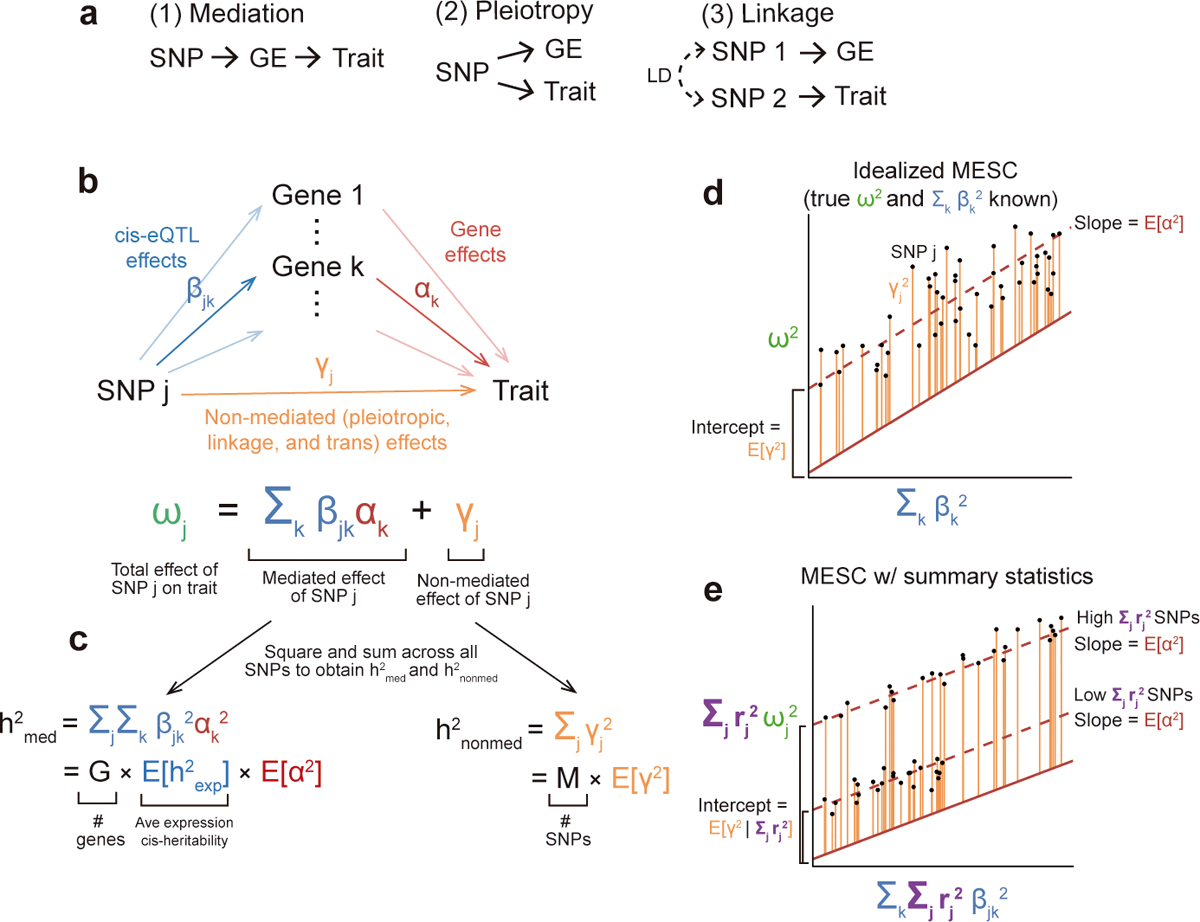
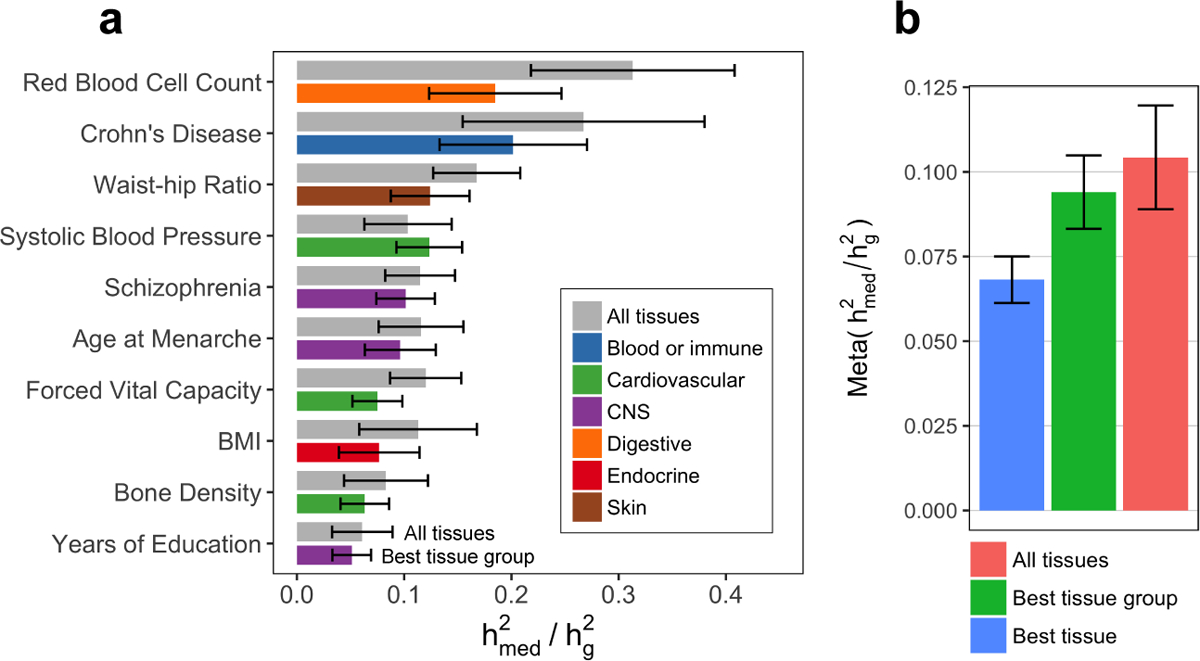
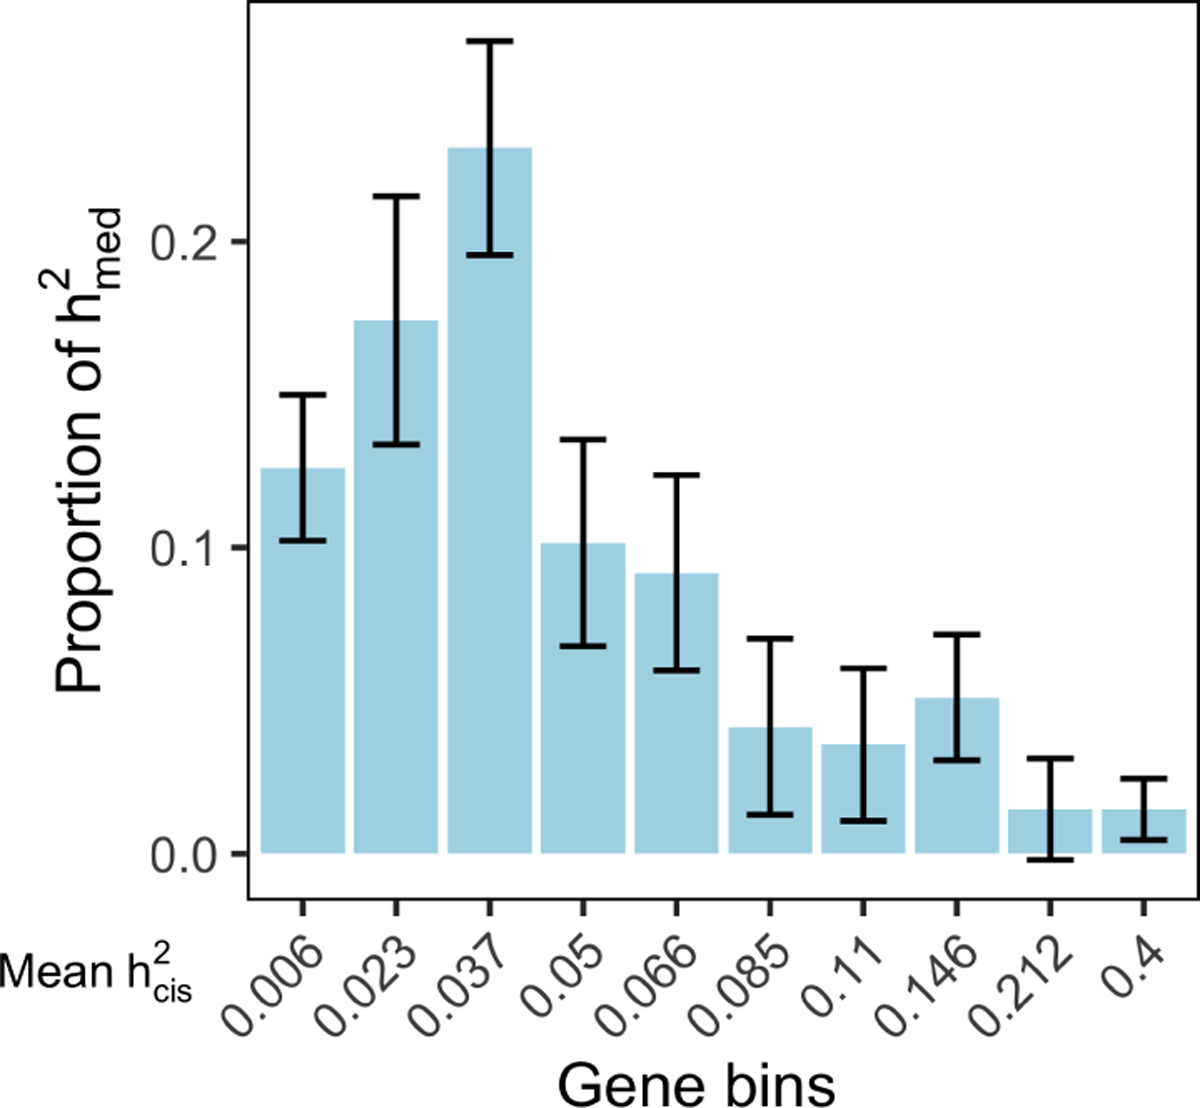
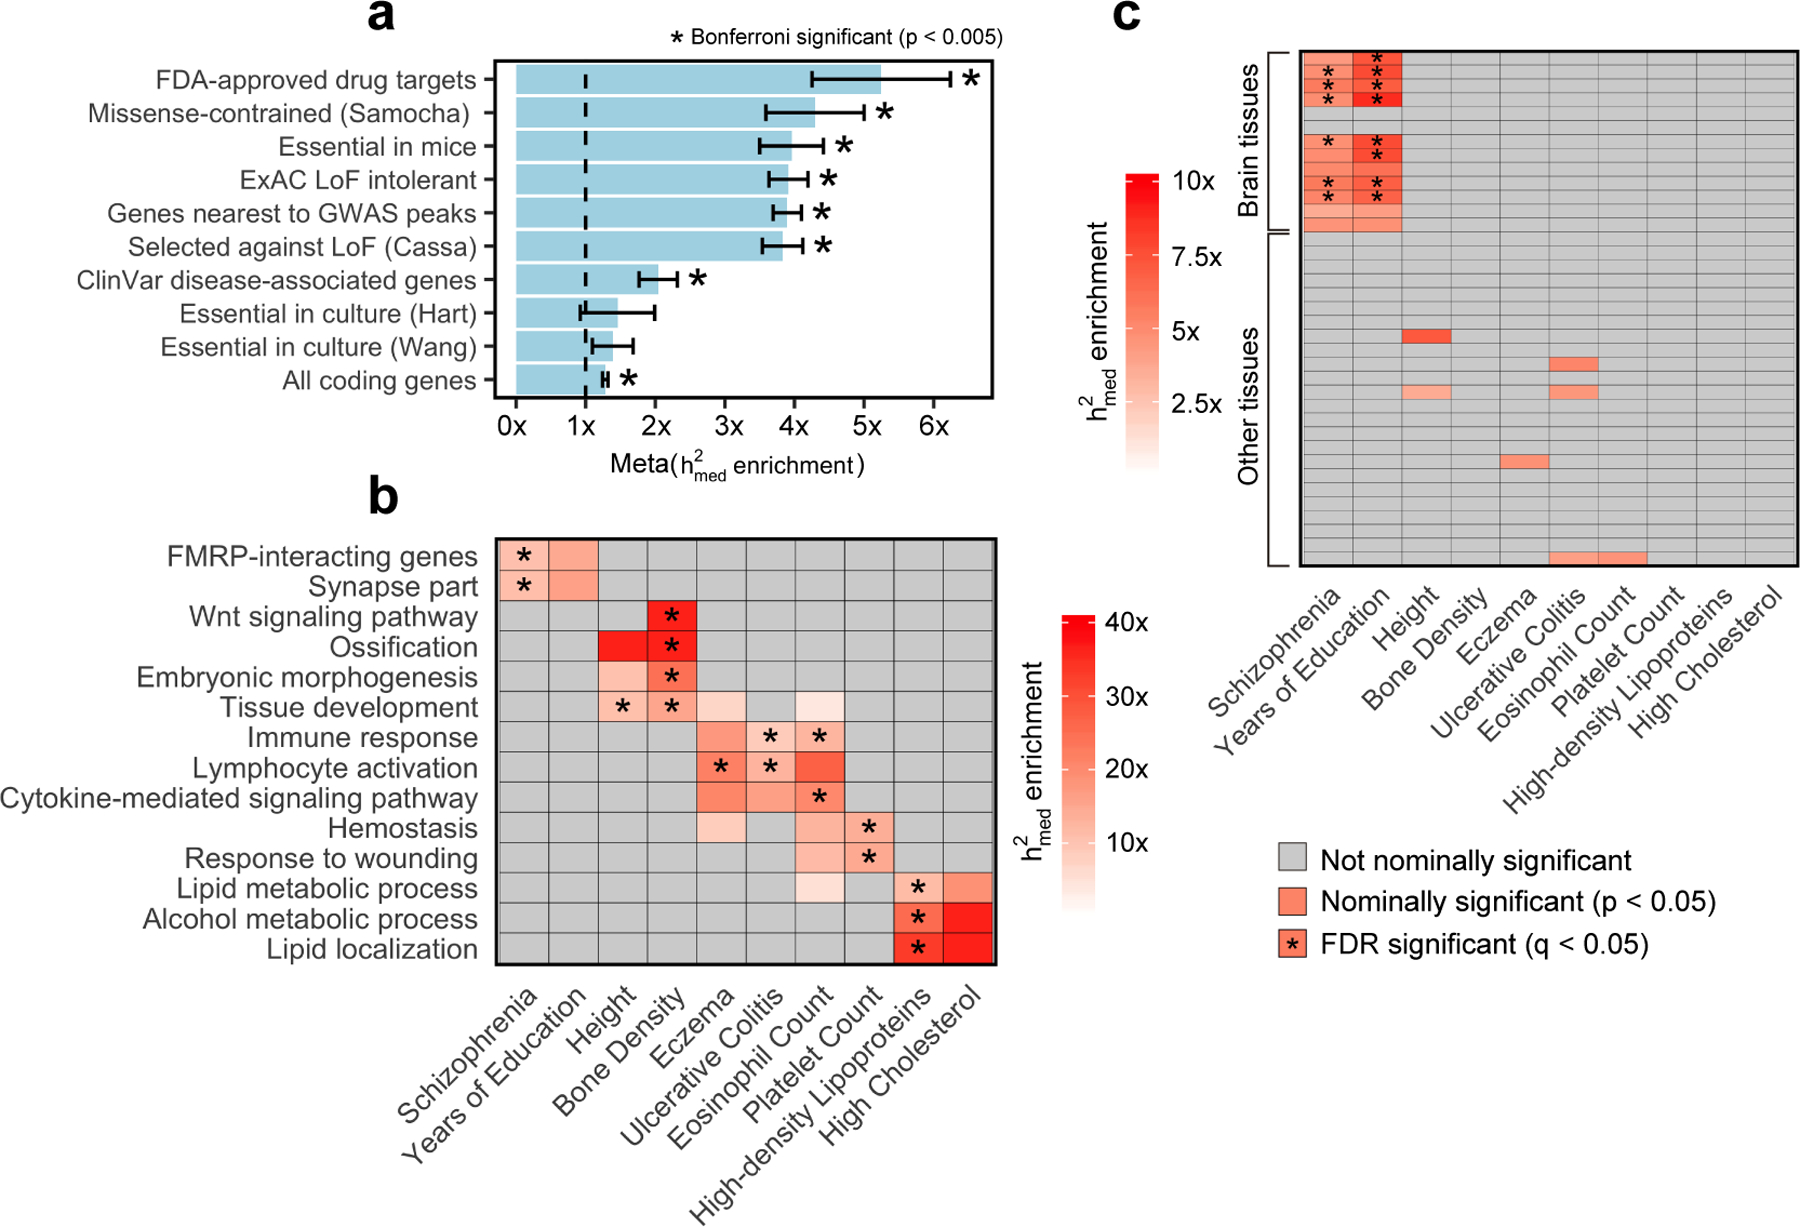
Disease variants identified by genome-wide association studies (GWAS) tend to overlap with expression quantitative trait loci (eQTLs), but it remains unclear whether this overlap is driven by gene expression levels 'mediating' genetic effects on disease. Here, we introduce a new method, mediated expression score regression (MESC), to estimate disease heritability mediated by the cis genetic component of gene expression levels. We applied MESC to GWAS summary statistics for 42 traits (average N = 323,000) and cis-eQTL summary statistics for 48 tissues from the Genotype-Tissue Expression (GTEx) consortium. Averaging across traits, only 11 ± 2% of heritability was mediated by assayed gene expression levels. Expression-mediated heritability was enriched in genes with evidence of selective constraint and genes with disease-appropriate annotations. Our results demonstrate that assayed bulk tissue eQTLs, although disease relevant, cannot explain the majority of disease heritability.


Conflict of interest statement

Competing Interests

The authors declare no competing interests.

Figures

Extended Data Fig. 1
Extended Data Fig. 1. Relationship between hmed2/hg2 and hg2.
hmed2/hg2 estimates were obtained using all-tissue meta-analyzed expression scores. hg2 estimates were obtained using stratified LD-score regression. Error bars represent jackknife standard errors.
Extended Data Fig. 2
Extended Data Fig. 2. hmed2/hg2 estimates for all diseases and expression scores.
Same as Figure 3a, but containing hmed2/hg2 estimates for all 42 traits from all three types of expression scores: “All tissues” (expression scores meta-analyzed across all 48 GTEx tissues), “Best tissue group” (expression scores meta-analyzed within 7 tissue groups), and “Best tissue” (expression scores computed within individual tissues). Here, “best” refers to the tissue/tissue group resulting in the highest estimates of hmed2/hg2 compared to all other tissues/tissue groups. Error bars represent jackknife standard errors.
Extended Data Fig. 3
Extended Data Fig. 3. Relationship between individual tissue sample size and magnitude of hmed2/hg2.
hmed2/hg2 estimates from expression scores estimated in each of 48 individual GTEx tissues were meta-analyzed across 42 complex traits, then plotted against the number of samples in each tissue. We use the following abbreviations: adipose visceral, adipose visceral omentum; brain ACC, brain anterior cingulate cortex BA24; brain CBG, brain caudate basal ganglia; brain CH, brain cerebellar hemisphere; brain FC, brain frontal cortex BA9; brain NABG, brain nucleus accumbens basal ganglia; brain PBG brain putamen basal ganglia; cells CETL, cells EBV-transformed lymphocytes; cells TF, cells transformed fibroblasts; esophagus GJ, esophagus gastroesophageal junction; heart AA, heart atrial appendage; heart LV, heart left ventricle; skin NSES, skin not sun exposed suprapubic; skin SELL, skin sun exposed lower leg; small intestine, small intestine terminal ileum.
Extended Data Fig. 4
Extended Data Fig. 4. hmed2/hg2 estimates for 42 diseases and complex traits using data from eQTLGen.
We estimated expression scores for all SNPs using cis-eQTL summary statistics from eQTLGen (N = 31,684 blood samples), then estimated hmed2/hg2 using GWAS summary statistics for the same 42 traits analyzed in the main text. Expression cis-heritability estimates for eQTLGen data were obtained using LD-score regression. For sake of comparison, we also display hmed2/hg2 estimates obtained from expression scores from GTEx all-tissue meta-analysis and GTEx whole blood only. (a) hmed2/hg2 estimates for 42 individual traits, organized into blood/immune and non-blood/immune traits. Error bars represent jackknife standard errors. (b) Results from a meta-analyzed across traits. Error bars represent standard errors from random-effects meta-analysis. Note that low estimates of hmed2/hg2 for GTEx whole blood expression scores are caused by the small sample size of the GTEx whole blood data set (N = 369).
Extended Data Fig. 5
Extended Data Fig. 5. Relationship between expression cis-heritability and metrics of gene essentiality.
For each gene, pLI (probability of loss-of-function intolerance) was obtained from Lek et al. 2016 Nature and shet (selection against protein-truncating variants) was obtained from Cassa et al. 2017 Nature Genetics.
Extended Data Fig. 6
Extended Data Fig. 6. hmed2 enrichment estimates for all 10 broadly essential gene sets across all 26 complex traits.
Same as Figure 5a, but showing hmed2 enrichment estimates for individual traits rather than meta-analyzed estimates.
Extended Data Fig. 7
Extended Data Fig. 7. hmed2 enrichment estimates for 97 pathway-specific gene sets across all 26 complex traits.
Same as Figure 5b, but plotting all pathway-specific gene sets (out of 780 total) with FDR-significant hmed2 enrichment in at least one of the 26 complex traits. For ease of display, we grouped together related traits and gene sets.
Extended Data Fig. 8
Extended Data Fig. 8. Comparison between gene set enrichment estimates from MESC, MAGMA, and DEPICT.
See Supplementary Note for details on these analyses. (a) Venn diagram showing the overlap between significantly enriched trait-gene set pairs (FDR < 0.05) identified by the three methods. (b) Scatterplots of -log10 enrichment p-values from MESC vs. MAGMA (left), MESC vs. DEPICT (middle), and MAGMA vs. DEPICT (right). Each point represents a trait-gene set pair. (c) List of all 32 gene sets-complex traits pairs detected as significant by MESC (FDR q-value < 0.05) that are not detected as significant by MAGMA or DEPICT. See Supplementary Table 9 for enrichment estimates for all gene set-complex traits pairs.
Figure 1.
Figure 1.. Schematic of MESC
(a) Three possible causal scenarios explaining enrichment/overlap between GWAS loci and eQTLs. GE, gene expression levels. (b) SNP effect sizes are modeled as the sum of a mediated component (defined as causal cis-eQTL effect sizes β multiplied by gene-trait effect sizes α) and a non-mediated component γ. (c) Heritability mediated by the cis-genetic component of gene expression levels (hmed2) is defined as the squared mediated component of SNP effect sizes summed across all SNPs (assuming that genotypes and phenotypes are standardized). hmed2 can be rewritten as the product of the number of genes G, the average expression cis-heritability Ehcis2, and the average gene-trait effect size E[α2] (d) The basic premise behind MESC is to regress squared GWAS effect sizes on squared eQTL effect sizes. Non-directional non-mediated effects are captured by the intercept, while directional mediated effects are captured by the slope, which equals E[α2] given appropriate effect size independence assumptions (see Methods). (e) In practice, MESC involves regressing squared GWAS summary statistics on squared eQTL summary statistics. Differences in the level of LD between SNPs are captured by an LD score covariate. In the figure, we show a simplified LD architecture with two discrete levels of LD.
Figure 2.
Figure 2.. Simulation results.
We simulated expression and complex trait architectures corresponding to various levels of hmed2/hg2. GWAS sample size was fixed at 10,000 and hg2 was fixed at 0.5. Error bars represent mean standard errors across 300 simulations. (a) Impact of expression panel sample size on hmed2/hg2 estimates. Expression scores were estimated from simulated expression panel samples using LASSO with REML correction. (b) Impact of sparse genetic/eQTL architectures on hmed2/hg2 estimates. (c) hmed2/hg2 estimates with rg2T<1. (d) hmed2/hg2 estimates in the presence of a negative correlation between the magnitude of eQTL effect size and gene effect size (constituting a violation of gene-eQTL independence). Results are shown with and without stratifying genes by 5 expression cis-heritability bins. See Supplementary Figure 5 for hmed2(D)/hg2 estimates of individual bins. (e) hmed2/hg2 estimates when 100% of eQTL effects and non-mediated effects lie within coding regions (constituting a violation of gene-eQTL independence). Results are shown stratifying SNPs by the baselineLD model and a version of the baselineLD model with the coding annotation removed. See Supplementary Figure 6 for additional similar simulations. (f) With hmed2/hg2 fixed at 0, we varied the heritability enrichment of three eQTL-enriched SNP categories (coding, TSS, and conserved regions) from 2.5x to 10x. In the figure, we show the proportion of simulations in which the null hypothesis that hmed2/hg2=0 is rejected by MESC, and the proportion of simulations in which the null hypothesis of no hg2 enrichment for the set of all eQTLs is rejected by stratified LD-score regression (S-LDSC).
Figure 3.
Figure 3.. Estimates of proportion of heritability mediated by expression from GTEx.
(a) Estimated proportion of heritability mediated by the cis-genetic component of assayed gene expression levels (hmed2/hg2) for 10 genetically uncorrelated traits (average N = 339K). See Supplementary Note for procedure behind selecting these 10 traits and Extended Data 2 for estimates of hmed2/hg2 for all 42 traits. Error bars represent jackknife standard errors. For each trait, we report the hmed2/hg2 estimate for “All tissues” (expression scores meta-analyzed across all 48 GTEx tissues) and “Best tissue group” (expression scores meta-analyzed within 7 tissue groups). Here, “best” refers to the tissue group resulting in the highest estimates of hmed2/hg2 compared to all other tissue groups. (b) hmed2/hg2 estimates meta-analyzed across all 42 traits (average N = 323K). Error bars represent standard errors from random-effects meta-analysis. Here, “Best tissue” refers to the individual tissue resulting in the highest estimates of hmed2/hg2 compared to all other tissues. BMI, body mass index; CNS, central nervous system.
Figure 4.
Figure 4.. Low heritability genes explain more expression-mediated disease heritability.
(a) Estimated proportion of expression-mediated heritability (hmed2(D)/hmed2) for 10 gene bins stratified by magnitude of expression cis-heritability. Results are meta-analyzed across 26 traits with nominally significant hmed2. Error bars represent standard errors from random effects meta-analysis. Results for individual traits can be found in Supplementary Table 6.
Figure 5.
Figure 5.. Expression-mediated heritability enrichment estimates for functional gene sets.
For all plots, x axis represents complex traits and y axis represents gene sets. P-values for hmed2 enrichment are obtained using a two-tailed z-test using jackknife standard errors for hmed2 enrichment. (a) hmed2 enrichment estimates for 10 broadly essential gene sets meta-analyzed across 26 complex traits. hmed2 enrichment estimates for individual traits can be found in Extended Data 6. Error bars represent standard errors from random-effects meta-analysis. (b) For ease of display, we report hmed2 enrichment estimates for a representative set of 14 pathway-specific gene sets across 10 complex traits. hmed2 enrichment estimates for additional complex traits and gene sets can be found in Extended Data 7 and Supplementary Table 8. (c) hmed2 enrichment estimates for 37 gene sets corresponding to specifically expressed genes in 37 GTEx tissues. Brain tissues (13 total) are indicated as so in the figure. hmed2 enrichment estimates for additional complex traits, with individual GTEx tissues labelled, can be found in Supplementary Figure 7. LoF, loss of function.

References

    1. Maurano MT et al. Systematic Localization of Common Disease-Associated Variation in Regulatory DNA. Science 337, 1190–1195 (2012). - PMC - PubMed
    1. Finucane HK et al. Partitioning heritability by functional annotation using genome-wide association summary statistics. Nature Genetics 47, 1228–1235 (2015). - PMC - PubMed
    1. Visscher PM et al. 10 Years of GWAS Discovery: Biology, Function, and Translation. The American Journal of Human Genetics 101, 5–22 (2017). - PMC - PubMed
    1. Stunnenberg HG et al. The International Human Epigenome Consortium: A Blueprint for Scientific Collaboration and Discovery. Cell 167, 1145–1149 (2016). - PubMed
    1. GTEx Consortium. Genetic effects on gene expression across human tissues. Nature 550, 204–213 (2017). - PMC - PubMed

Publication types

MeSH terms