. 2020 Jun;52(6):604-614.
doi: 10.1038/s41588-020-0624-3. Epub 2020 May 18.

Spatial competition shapes the dynamic mutational landscape of normal esophageal epithelium

Affiliations

Spatial competition shapes the dynamic mutational landscape of normal esophageal epithelium

Bartomeu Colom et al. Nat Genet. 2020 Jun.

Abstract

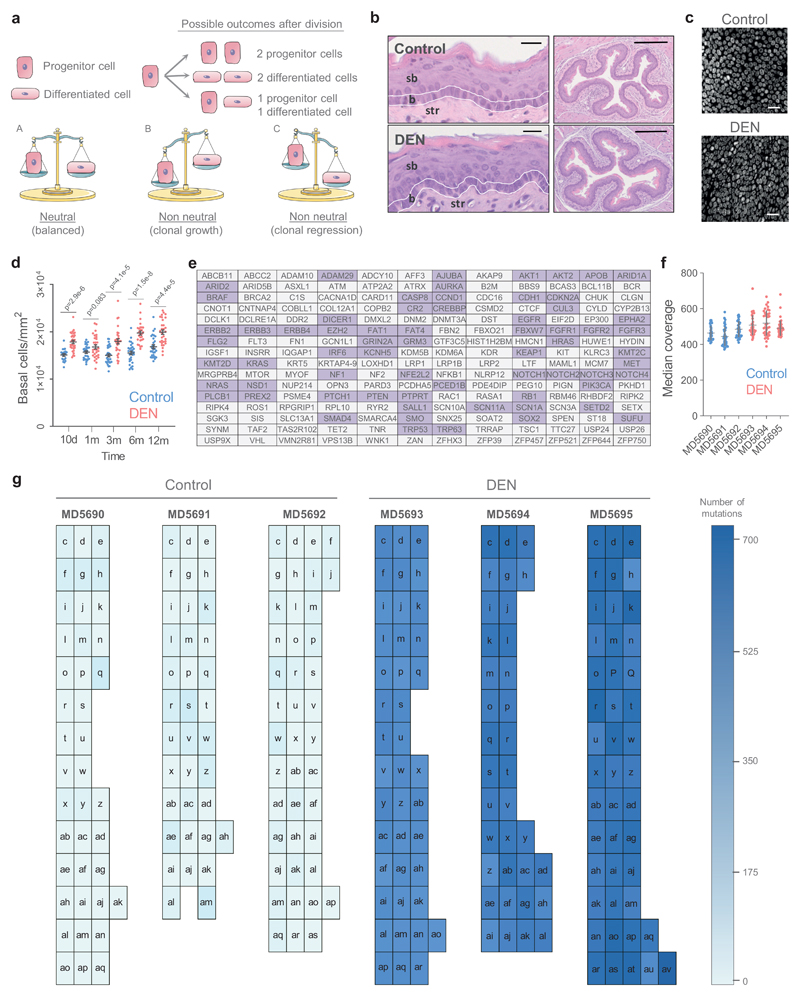
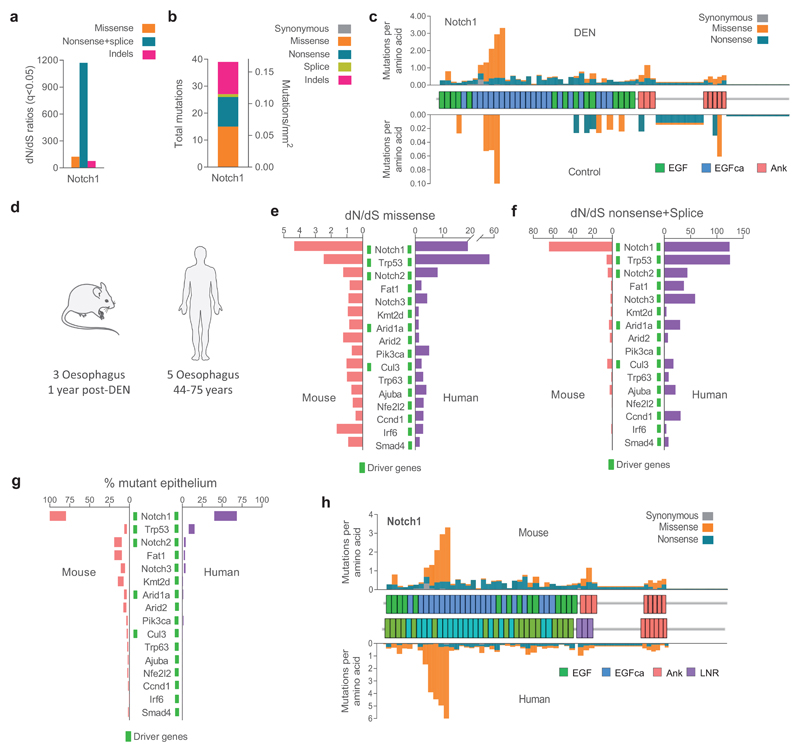
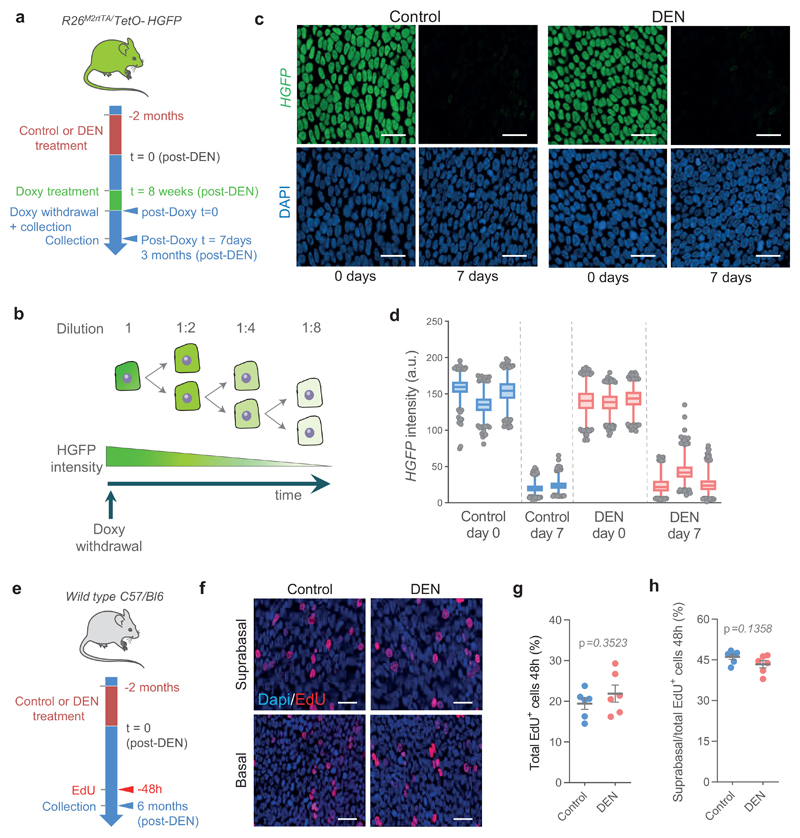
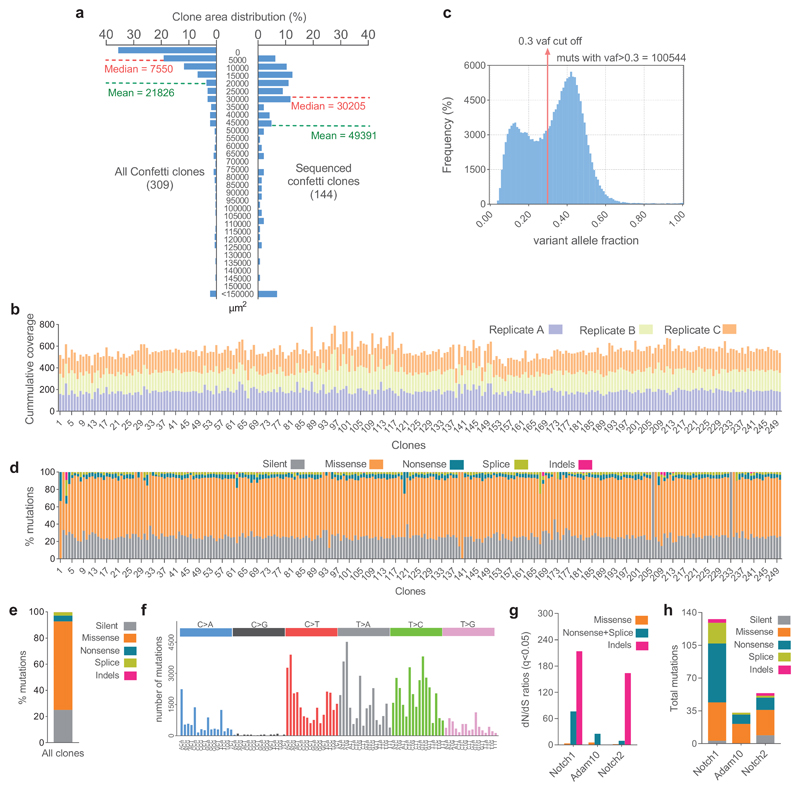
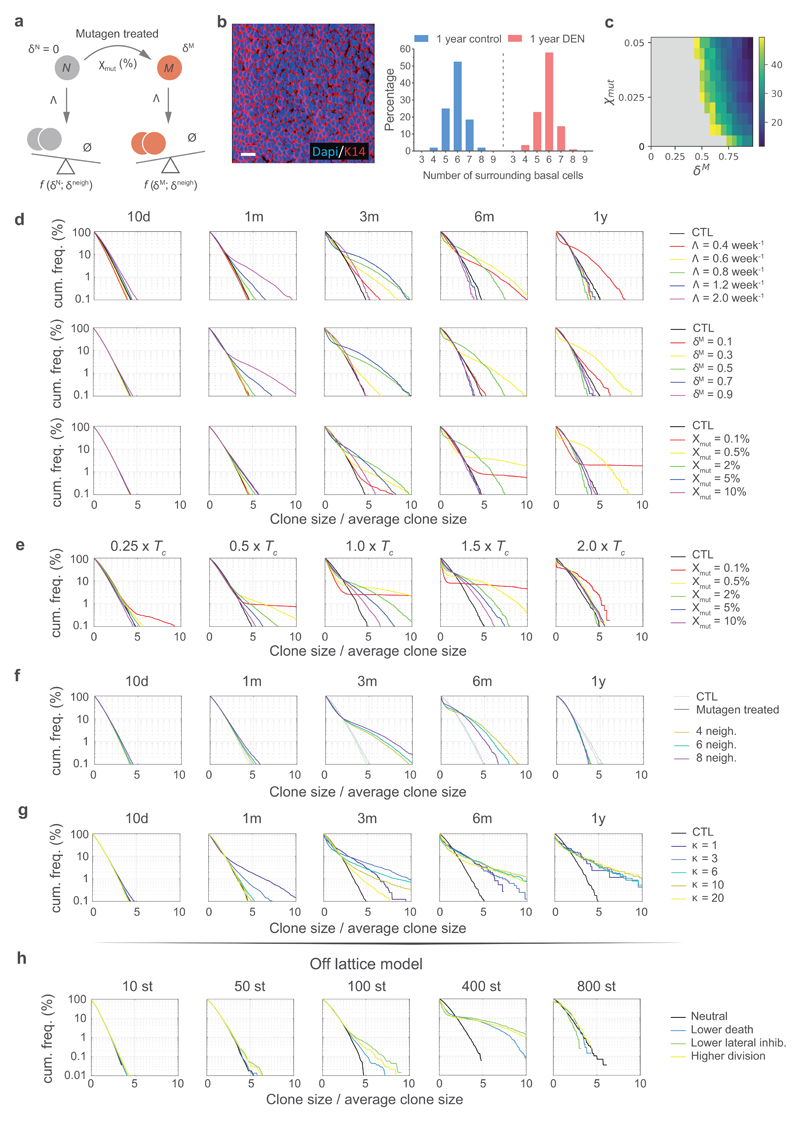
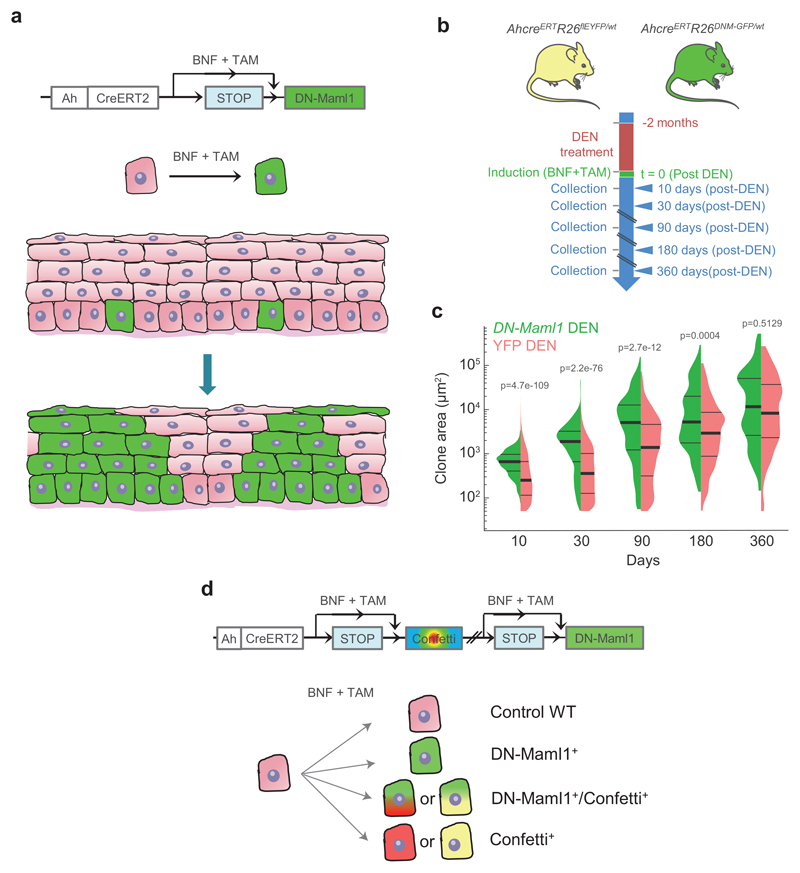
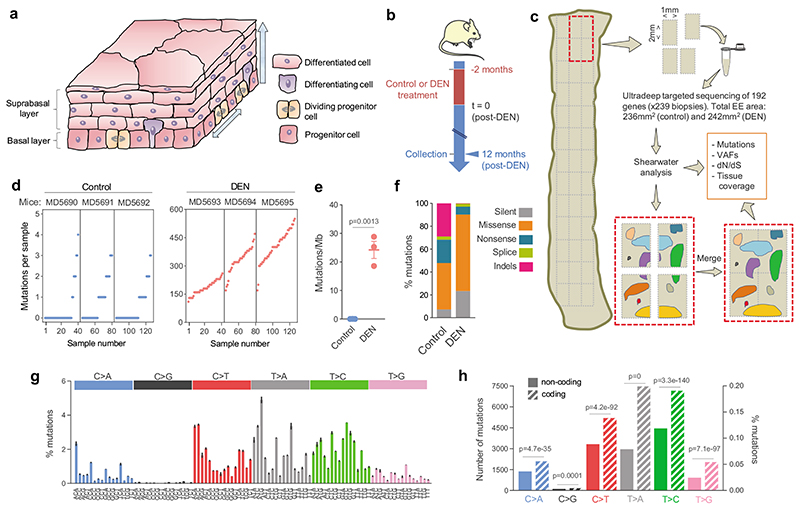
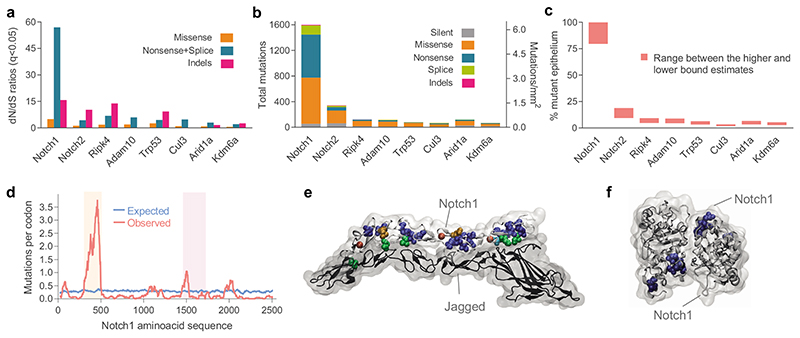
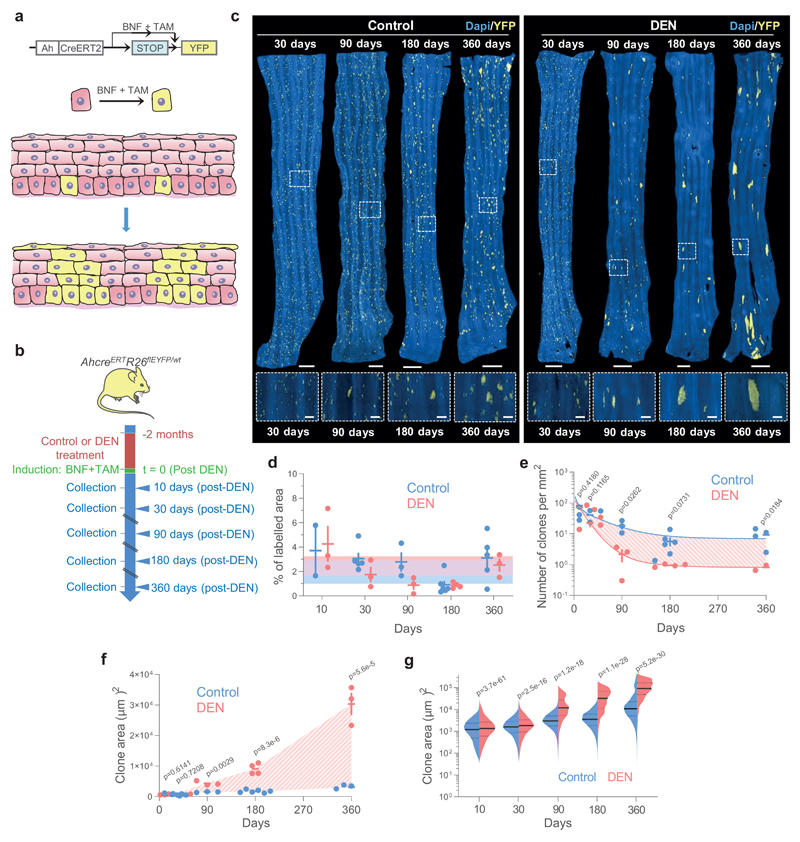
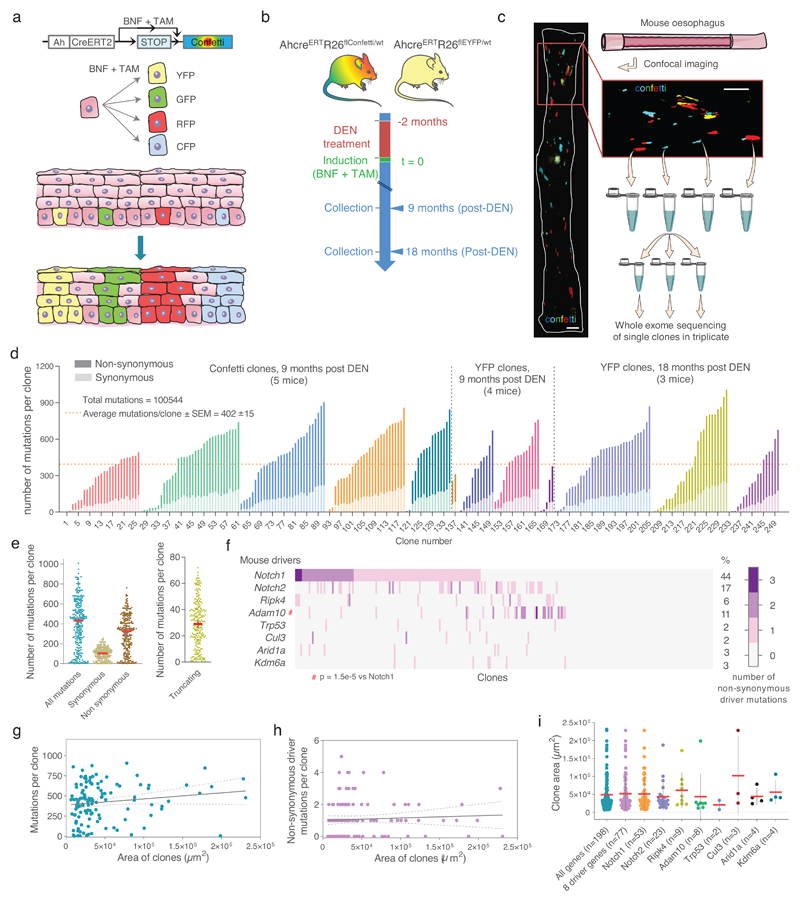
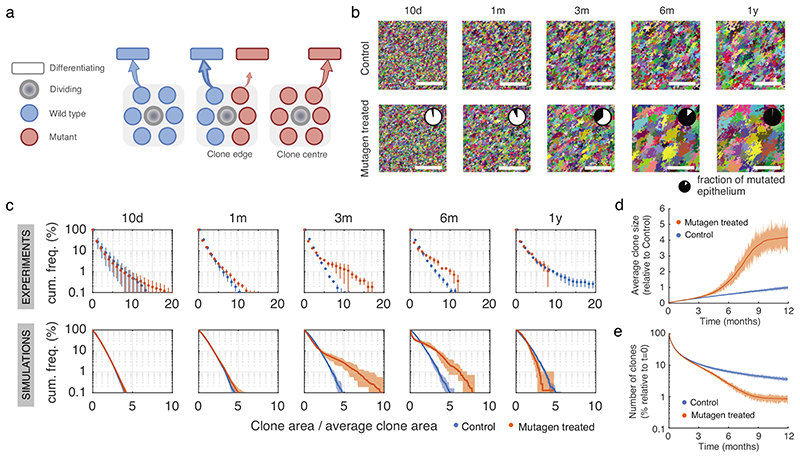
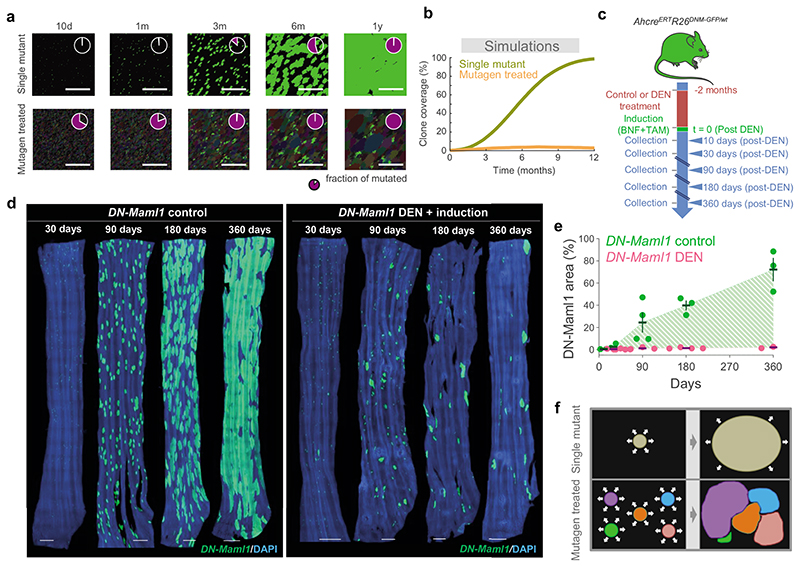
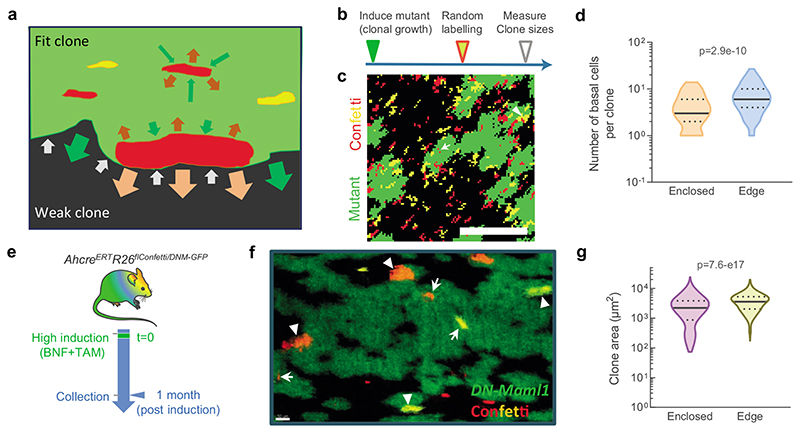
During aging, progenitor cells acquire mutations, which may generate clones that colonize the surrounding tissue. By middle age, normal human tissues, including the esophageal epithelium (EE), become a patchwork of mutant clones. Despite their relevance for understanding aging and cancer, the processes that underpin mutational selection in normal tissues remain poorly understood. Here, we investigated this issue in the esophageal epithelium of mutagen-treated mice. Deep sequencing identified numerous mutant clones with multiple genes under positive selection, including Notch1, Notch2 and Trp53, which are also selected in human esophageal epithelium. Transgenic lineage tracing revealed strong clonal competition that evolved over time. Clone dynamics were consistent with a simple model in which the proliferative advantage conferred by positively selected mutations depends on the nature of the neighboring cells. When clones with similar competitive fitness collide, mutant cell fate reverts towards homeostasis, a constraint that explains how selection operates in normal-appearing epithelium.


Conflict of interest statement

Competing Interests

The authors declare no competing interests.

Figures

Extended Data 1
Extended Data 1
Extended Data 2
Extended Data 2
Extended Data 3
Extended Data 3
Extended Data 4
Extended Data 4
Extended Data 5
Extended Data 5
Extended Data 6
Extended Data 6
Extended Data 7
Extended Data 7
Extended Data 8
Extended Data 8
Figure 1
Figure 1. The mutational landscape of normal EE in control and DEN-treated mice.
a, Mouse esophageal epithelium (EE). Progenitor cells are confined to the basal layer. Differentiating cells exit the cell cycle, migrate out of the basal layer, through the suprabasal layers and are finally shed into the esophageal lumen. b, Protocol: wild-type mice were treated for 2 months with diethylnitrosamine (DEN) or vehicle and the esophagus collected 12 months later. c, Sequencing protocol: EEs from 3 control and 3 DEN-treated mice were cut into a contiguous grid of 2mm2 pieces, DNA extracted from each sample and ultradeep targeted sequencing performed. Mutations were called with the Shearwater algorithm. Mutant clones spanning adjacent samples were merged for analysis. d, Number of mutations per sample (each dot represents a sample). e, Estimated mutation burden in the 3 control and 3 DEN-treated EEs, bars indicate mean ± SEM (p value is with unpaired two-sided Student’s t-test). f, Percentage of mutation types identified in control and DEN-treated mouse EE. g, Mutational spectrum of DEN-treated samples. The bar plot illustrates the percentage of mutations in each of the 96 possible trinucleotides (mean ± SEM, n=3 mice). h, Strand asymmetry. Total substitutions in the coding (untranscribed, striped-bars) and non-coding (transcribed, solid-bars) strands for each mutation type in DEN-treated EE. Number of mutations in non-coding/coding strands: C>A = 1372/2098, C>G = 112/179, C>T = 3327/5200, T>A = 2963/7475, T>C = 4450/7154, T>G = 918/2041. Two-sided Poisson test. Sequencing data is detailed in Supplementary Table 2. VAF, variant allele frequency.
Figure 2
Figure 2. Positive selection of somatic mutations in DEN-treated EE.
a, dN/dS ratios for missense and truncating (nonsense + essential splice site) substitutions and insertions or deletions (indels) indicating genes under significant positive selection in normal EE from DEN-treated mice (29,491 mutations; q<0.05, R package dndscv ). Data and statistics are available in Supplementary Table 3. b, Number and type of mutations in the significantly positively selected genes. c, Estimated percentage of DEN-treated EE carrying non-synonymous mutations for each gene. d, Number of missense mutations/codon within Notch1. Blue line is the expected distribution calculated from the mutational spectrum of DEN and the Notch1 coding sequence; red line is the observed distribution. Mutations were clustered in the extracellular EGF8-EGF12 repeats that form the Notch 1 ligand binding domain (light orange shadow) and in the negative regulatory region (NRR) of Notch1 (light purple shadow). e-f, 3D structures of the highly mutated regions. e, Ligand binding domain showing NOTCH1 bound to JAGGED1 (Protein Data Bank code: 5UK5); see also Supplementary video 1. f, NRR domain and cleavage site for NOTCH1 after ligand binding (Protein Data Bank code: 3ETO), see also Supplementary video 2. Recurrently mutated codons were: cysteine residues in disulfide bonds (blue), leucine to proline in β-sheets (orange), mutations affecting D469 (cyan), mutations of calcium binding residues (red) and mutations on the ligand binding interface (green), all predicted to disrupt the protein structure or the binding to the ligand.
Figure 3
Figure 3. Lineage tracing reveals hallmarks of strong clonal competition in DEN-treated EE.
a, In vivo genetic lineage tracing using AhcreERTRosa26flEYFP/wt reporter mice.Cre-mediated excision of the stop codon by tamoxifen (TAM) and ß-napthoflavone (BNF) injection results in the heritable expression of yellow fluorescent protein (YFP), generating YFP-labelled clones. b, Protocol: AhcreERTRosa26flEYFP/wt mice were treated with DEN or vehicle control for 2 months, followed by clonal labelling. EE was collected at the indicated time points. c, Representative 3D-projected confocal images of control and DEN-treated EE collected at the indicated time points. Nuclear (DAPI) staining is blue and YFP-labelled clones are yellow. Insets are enlarged views of dashed areas. Scale-bars: main panels 1mm, insets 200μm. d, Percentage of EE area labelled. Shaded areas indicate mean and 95% confidence bounds across all time points. Each dot represents a mouse, error-bars correspond to mean ± SEM (see n numbers below). e-f, Number of clones per mm2 of EE (e) and average area of clones (f) in control and DEN-treated mice collected at the indicated time points. Shading indicates the difference between the fitted curves. Each dot represents a mouse. Error-bars: mean ± SEM (p values from two-sided Student’s t-test; see n numbers below). g, Violin plots depicting the distributions of individual clone areas in control and DEN-treated mice. Lines show median and quartiles. p values are from two-sided two-sample Kolmogorov-Smirnov test. Number of mice (clones) for d-g (control/DEN): 10d = 2/3 (11552/15092), 1m = 5/3 (15865/5682), 3m = 3/3 (4152/539), 6m = 6/4 (2474/281), 12m = 5/3 (3485/188). See Supplementary Table 6.
Figure 4
Figure 4. Whole exome sequencing of single clones isolated from DEN-treated mice EE.
a, In vivo genetic lineage tracing using AhcreERTRosa26flConfetti/wt mice. TAM and BNF injections activate Cre-mediated inversion and excision recombination events in scattered single cells, conferring heritable expression of one of the four fluorescent proteins (YFP, GFP, RFP and CFP), resulting in labelled clones. b, Protocol: Single color AhcreERTRosa26flEYFP/wt (Fig. 3a) or multicolor AhcreERTRosa26flConfetti/wt mice received DEN for 2 months, followed by clonal labelling and tissue collection at the indicated time-points. c, Individual labelled clones were whole exome sequenced in triplicate. Scale bars =1mm. d, Number of synonymous (light colored) and non-synonymous (dark colored) mutations per clone (each mouse is shown in different colors), ranked by mutation burden (n=250 clones from 12 mice). e, Number of total, synonymous, non-synonymous and truncating (nonsense + essential splice site) mutations per clone (each dot represents a clone, n=250 clones), red line indicates median with 95% CI. f, Combinations of non-synonymous mutations in the 8 positively selected genes (see Fig. 2a) within individual clones. The percentage of clones mutant for each gene is indicated. g-h, Correlation between the area of individual clones and the number of mutations (g) or the number of non-synonymous mutations in the 8 selected genes (h). Fitted lines indicate linear regression (Pearson r; (g): r2=0.02, p = 0.1; (h): r2=0.003, p = 0.5; n=121 clones). i, Area of clones carrying mutations (non-exclusively) in the indicated genes (mean ± SD, sample size indicated in brackets). See Supplementary Table 11.
Figure 5
Figure 5. The “neighbour-constrained fitness” (NCF) model.
a, In the NCF model, progenitor cell division (bold outline) is linked to a neighboring cell differentiating and exiting from the basal layer. Mutations in neighboring cells may determine their likelihood of differentiating. When all neighbor cells are equivalent, either wild-type (left) or mutant (right), they all have equal probability of differentiation. When neighboring cells differ in their probability of differentiating (e.g. at mutant clone edges), cells with higher probability of differentiation are “losers” whereas those with a lower likelihood of differentiation will, on average, ‘win’ and persist (Supplementary Note). b, Simulations of wildtype (top) or mutant (bottom, mimicking an in vivo DEN treatment scenario) clones growing over time. Each colour represents a labelled clone. A simple setting was considered, with all mutant cells assigned the same fitness value (δ^M). Pie charts indicate the total fraction of mutated epithelium. See Supplementary Note. c, Cumulative distributions of clone sizes normalized by the average clone area at each time point, in control and mutagen-treated conditions. Experimental data (top panels) is shown as mean frequency ± SEM. Number of clones (control/DEN): 10d=11552/15092, 1m=15865/5682, 3m=4152/539, 6m=2474/281, 12m=3485/188. Results from the theoretical model simulations are displayed below (shaded areas correspond to 95% plausible interval frequencies from n=90.000 competing clones). d-e, NCF model predictions for the average clone size (d) and clone density (e) over time (shaded areas are 95% plausible intervals, n=90.000 clones). A simple setting was considered, with all mutant cells assigned the same δ^M. See supplementary Note.
Figure 6
Figure 6. Clonal growth is conditional to their fitness relative to surrounding clones.
a, Simulations of the expansion of high-competitive single mutant clones (green) induced within a wildtype environment (top) or within a highly mutated landscape (bottom), equivalent to that in DEN-treated mice (pale colors indicate mutant clones). In the later, every initial mutant cell is given a different competitive fitness, with δ^M randomly drawn from a distribution F=(1-Gamma(κ,1/κ)), with shape determined by parameter κ. Pie charts indicate the fraction of mutated epithelium. b, Simulated clonal expansion for highly competitive single mutant clones generated within a wildtype or a mutated environment, as in a. c, Protocol: AhcreERTRosa26wt/DNM-GFP (MAML-Cre) mice (Extended Data 8a) received DEN or vehicle control for 2 months followed by clonal labelling. Tissues were harvested at the indicated time points. d, Confocal images of control and DEN-treated MAML-Cre EEs collected at the indicated time points post-induction (blue = DAPI, green = DN-Maml1). Scale-bars: 1mm. e, Percentage of EE covered by DN-Maml1 clones in control and DEN-treated MAML-Cre mice, collected at the indicated time points (shadow indicates differences between averages). Each dot represents a mouse (mean ± SEM). Number of mice (control/DEN): 10d=3/3, 1m=3/5, 3m=4/3, 6m=3/4, 12m=3/3. See Supplementary Table 13. f, Schematic of the behaviour of mutant clones in the presence of wild type (top; black area represent wild-type clones) or other mutant clones (bottom; coloured areas represent clones carrying different mutations). Expansion of a particular clone is subject to the presence of other mutant clones around it.
Figure 7
Figure 7. A competitive advantage at clone borders drives clonal dynamics in the DEN-treated EE.
a, The neighbor-constrained fitness model implies that competitive mutant cells have an advantage over wild-type or less fit mutants that is neutralised when cells are surrounded by equally fit cells, so that expansion of highly competitive (“fit”) clones takes place at boundaries with “weak” clones. b, Simulation protocol to analyse the expanding behaviour of clones enclosed within or at the edges of mutant clones. c, Representative image of the simulations from (b) showing subclones (in red or yellow) growing within the mutant (green) clone (arrow) or at the edge of the clone, in contact with other wildtype clones depicted as black areas (arrowhead). d, Quantification of the simulations from (b) showing the size of subclones growing enclosed within (n=188) or at the edges (n=200) of mutant clones (from a 30,000-cells lattice simulation). Lines show median and quartiles. Two-sided Mann-Whitney test. See Supplementary video 5. e, Protocol: AhcreERTRosa26flConfetti/DNM-GFP mice (Extended Data 8d) were induced and the esophagus collected 1 month later. f, Representative image of EE tissues from (e) depicting the size of confetti labelled clones (red and yellow) in the edge of (arrowheads) or enclosed by (arrows) DN-Maml1 mutant areas (green). Scale bars: 50μm. g, Violin plots showing the area distribution of confetti clones quantified at the edge (n=493) or enclosed (n=434) within DN-Maml1 areas (from 6 mice/group). See Supplementary Table 15. Lines show median and quartiles. Two-sided Mann-Whitney test.

Comment in

  • Clonal competition in a confined space.
    Naxerova K. Naxerova K. Nat Genet. 2020 Jun;52(6):553-554. doi: 10.1038/s41588-020-0638-x. Nat Genet. 2020. PMID: 32424354 No abstract available.
  • Clone conflict.
    Dart A. Dart A. Nat Rev Cancer. 2020 Jul;20(7):362. doi: 10.1038/s41568-020-0278-6. Nat Rev Cancer. 2020. PMID: 32488199 No abstract available.
  • Clone wars: cells competing to win.
    Clyde D. Clyde D. Nat Rev Genet. 2020 Aug;21(8):446-447. doi: 10.1038/s41576-020-0256-6. Nat Rev Genet. 2020. PMID: 32504077 No abstract available.

References

    1. Fuster JJ, et al. Clonal hematopoiesis associated with TET2 deficiency accelerates atherosclerosis development in mice. Science (New York, N.Y.) 2017;355:842–847. doi: 10.1126/science.aag1381. - DOI - PMC - PubMed
    1. Lee-Six H, et al. Population dynamics of normal human blood inferred from somatic mutations. Nature. 2018;561:473–478. doi: 10.1038/s41586-018-0497-0. - DOI - PMC - PubMed
    1. Suda K, et al. Clonal Expansion and Diversification of Cancer-Associated Mutations in Endometriosis and Normal Endometrium. Cell reports. 2018;24:1777–1789. doi: 10.1016/j.celrep.2018.07.037. - DOI - PubMed
    1. Martincorena I, et al. Somatic mutant clones colonize the human esophagus with age. Science (New York, N.Y.) 2018;362:911–917. doi: 10.1126/science.aau3879. - DOI - PMC - PubMed
    1. Yokoyama A, et al. Age-related remodelling of oesophageal epithelia by mutated cancer drivers. Nature. 2019;565:312–317. doi: 10.1038/s41586-018-0811-x. - DOI - PubMed

Publication types

MeSH terms